13 Multiple Regression and morals()
If the second block only contains a single copy of a single variable then we choose transformations that maximize the multiple correlation of that variable and the variables in the first block.
13.1 Equations
13.2 Examples
13.2.1 Polynomial Regression
x <- center(as.matrix (seq (0, pi, length = 20)))
y <- center(as.matrix (sin (x)))
h<- morals (x, y, xknots = knotsE(x), xdegrees = 3, xordinal = TRUE)
plot(y, h$yhat)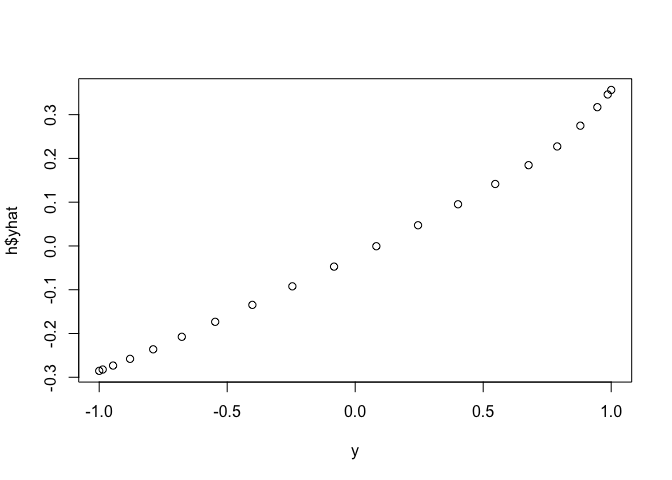
plot(x, h$xhat)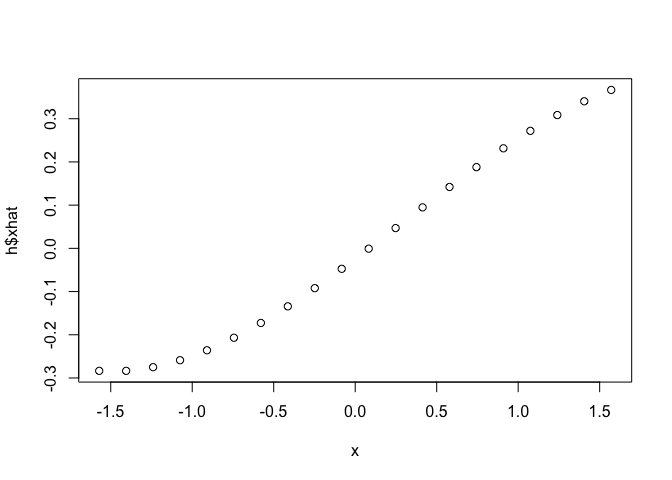
plot (x, y)
lines (x, h$ypred)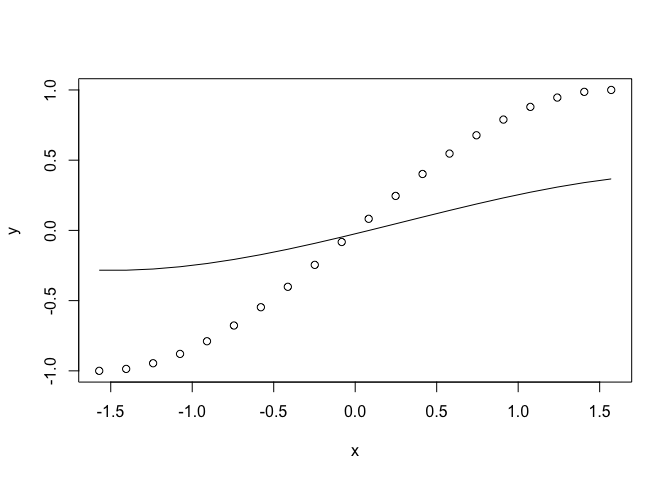
13.2.2 Gases with Convertible Components
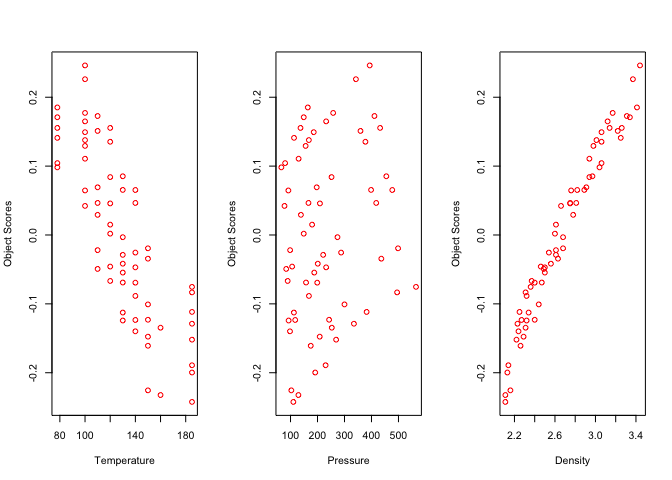
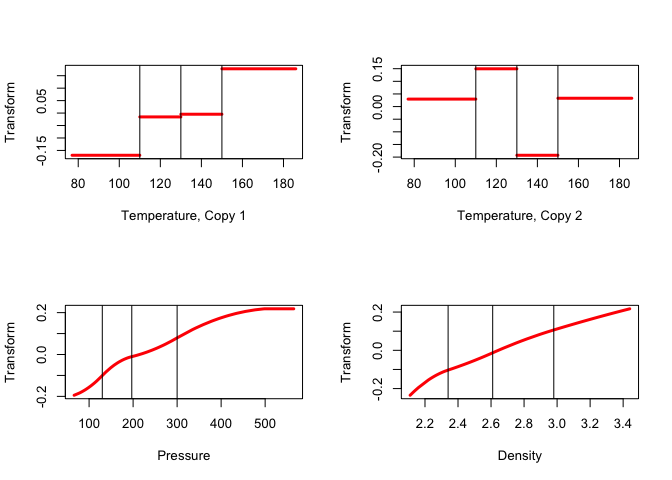
We analyze a regression example, using data from Neumann, previously used by Willard Gibbs, and analyzed with regression in a still quite readable article by Wilson (1926). Wilson’s analysis was discussed and modified using splines in Gifi (1990) (pages 370-376). In the regression analysis in this section we use two copies of temperature, with spline degree zero, and the first copy ordinal. For pressure and the dependent variable density we use a single ordinal copy with spline degree two.
data (neumann, package = "homals")
xneumann <- neumann[, 1:2]
yneumann <- neumann[, 3, drop = FALSE]
xdegrees <- c(0,2)
h <- morals (xneumann, yneumann, xdegrees = c(0,2), xcopies = c(2,1))In 58 iterations we find minimum loss 0.0268058, corresponding with a multiple correlation of 0.8956512. The object scores are in figure 21 plotted against the original variables (not the transformed variables), and the transformation plots in are figure 22.
References
Wilson, E.B. 1926. “Empiricism and Rationalism.” Science 64: 47–57.
Gifi, A. 1990. Nonlinear Multivariate Analysis. New York, N.Y.: Wiley.