1.7 Statistical association
We are often interested in the association between two variables. For example, we might wonder:
- Is reaction time associated with alcohol consumption?
- Is fuel efficiency associated with engine size?
- Is income associated with education?
- Is IQ associated with brain size?
1.7.1 Scatterplots
We can visualize the association between two variables using a scatterplot. In a scatterplot, one variable is on the x-axis and the other variable is on the y-axis. Each point in the scatterplot represents a case in the dataset. For example, the figure below shows a scatterplot for reaction time and alcohol consumption. The participant took a reaction test 10 times while completely sober. The 10 points associated with 0 drinks shows the distribution of reaction time for this part of the test, with each data point representing one outcome on the reaction test. The participant then completed the reaction test 10 times after 3 drinks and again after 6 drinks.
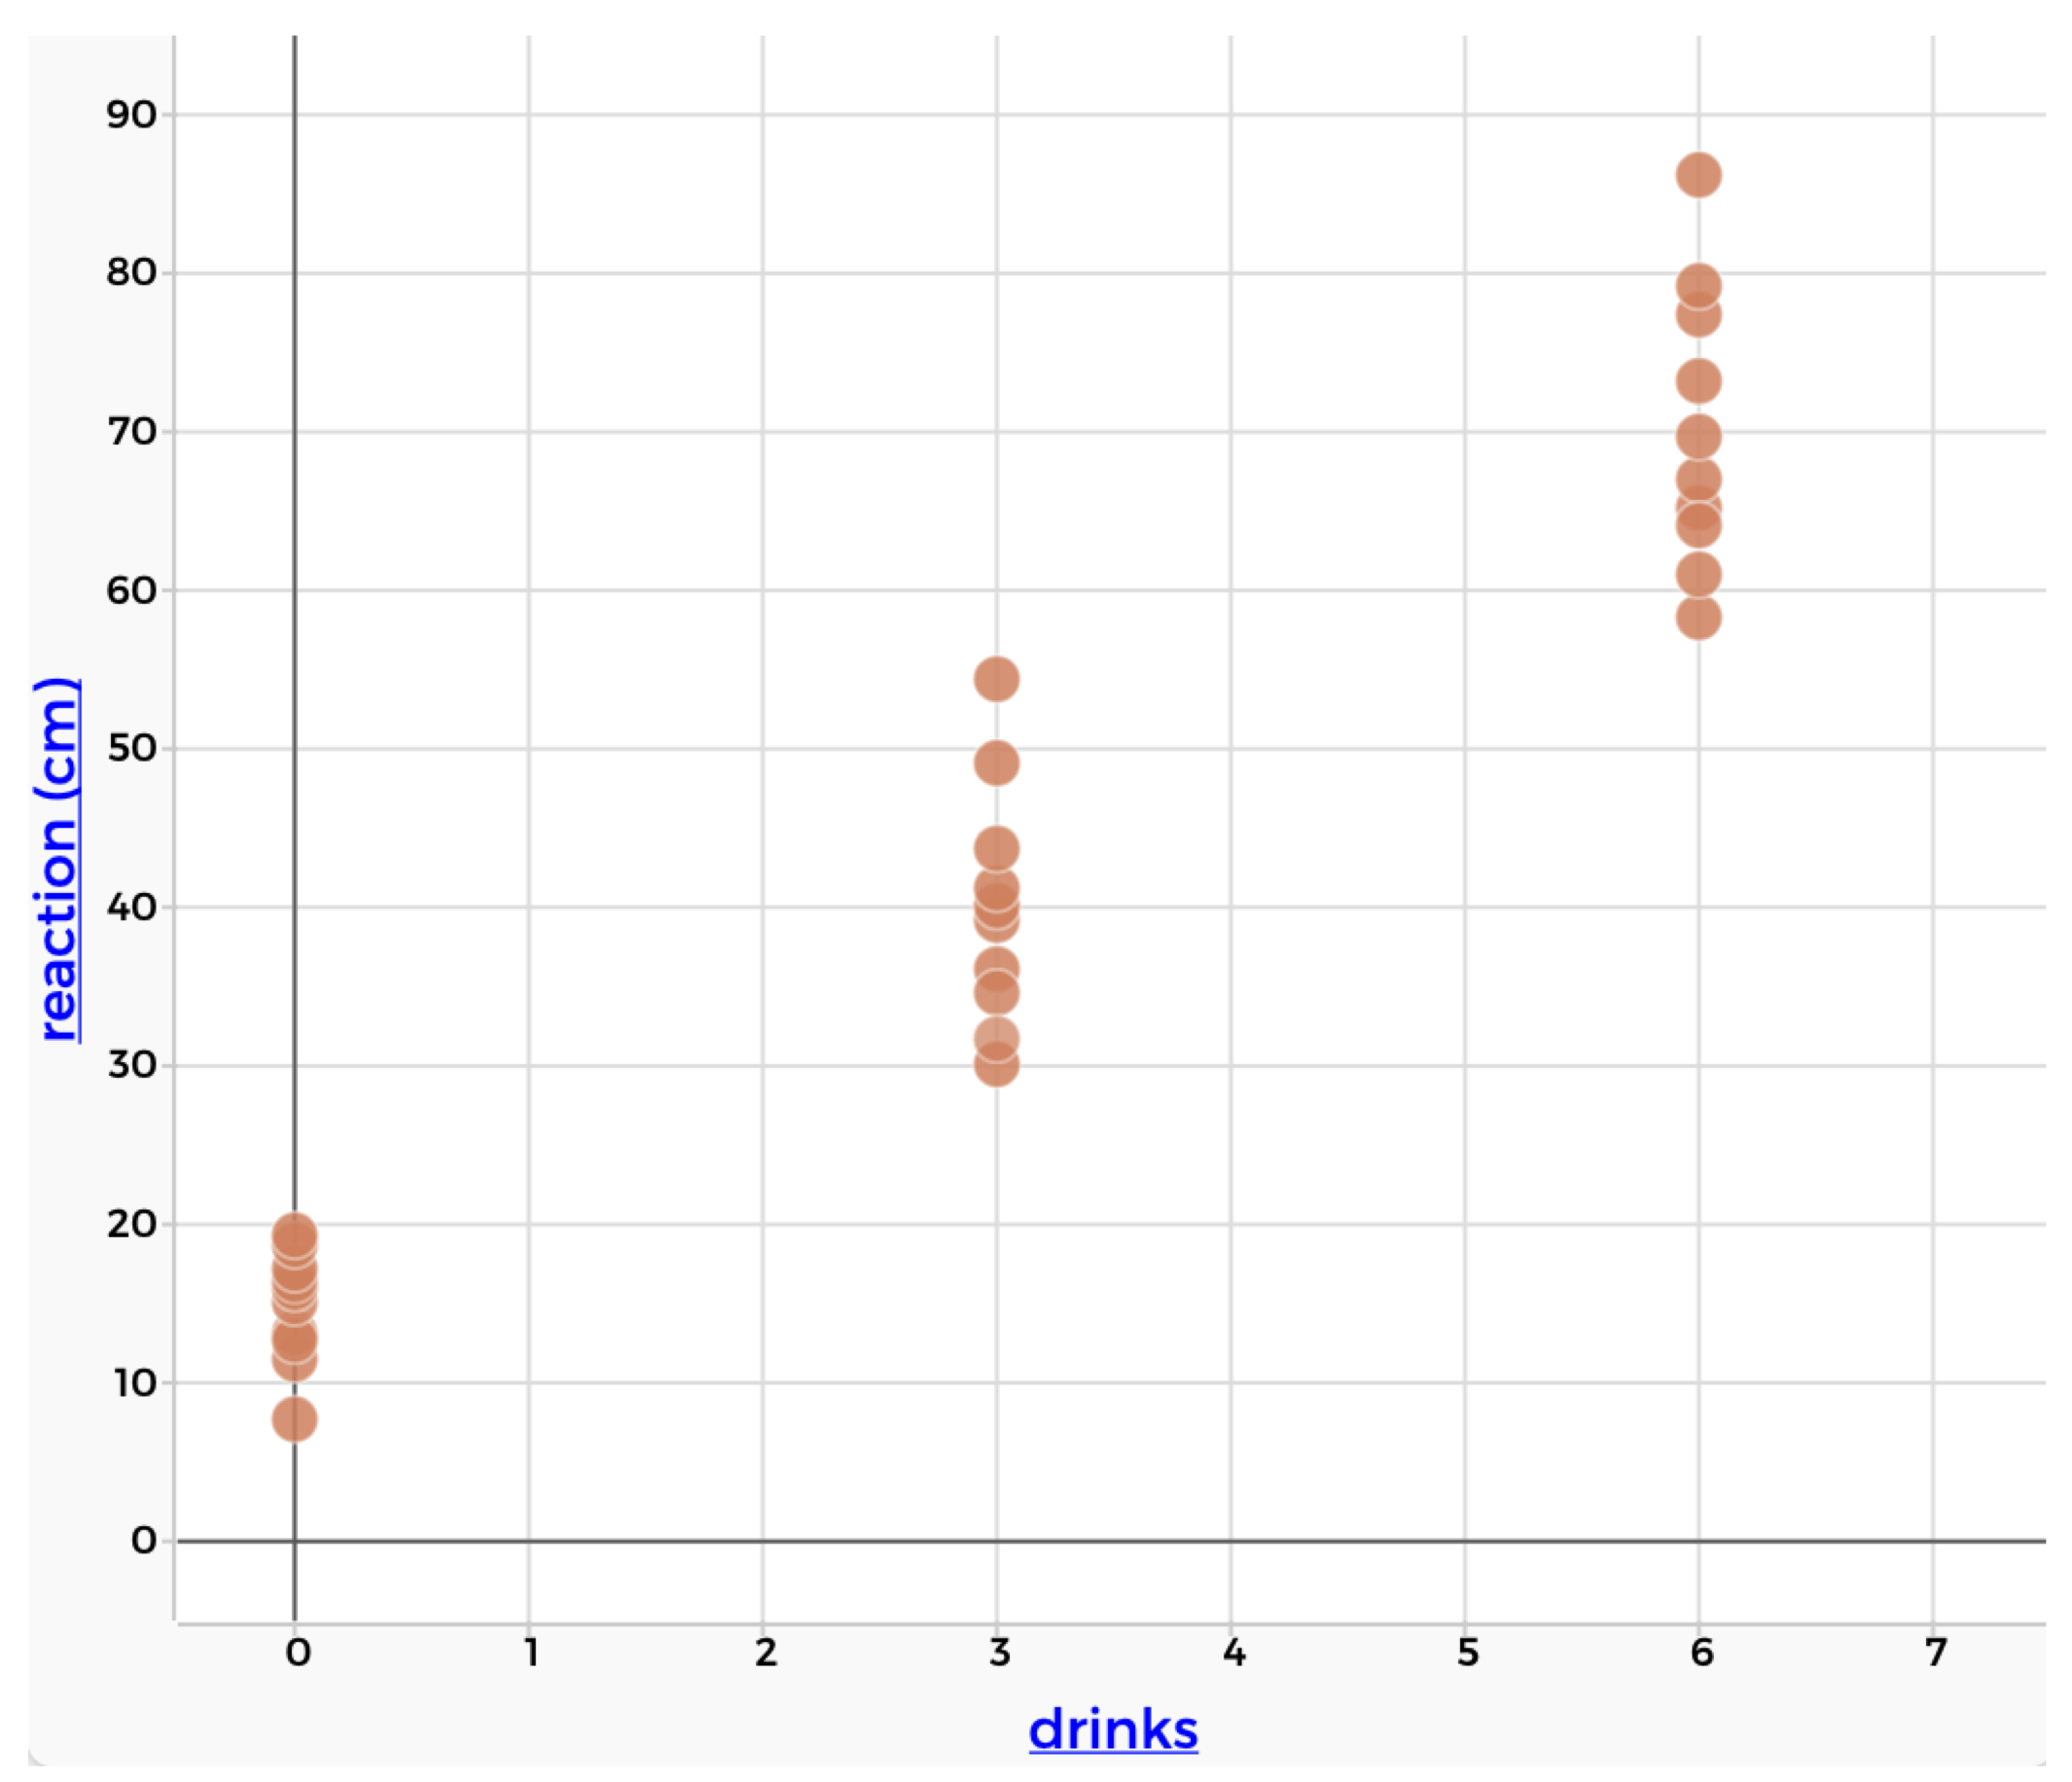
Figure 1.12: A scatterplot showing the association between alcohol and reaction time
1.7.2 Statistical association
As you can see, there is a distribution of reaction times associated with each level of alcohol consumption. Thus the statistical question is, how is the distribution of reaction times associated with alcohol consumption?
1.7.3 Describing statistical association
We can describe the statistical association visually, based on the scatterplot. When describing statistical association, we are interested in the strength and direction of the association.
1.7.3.1 Strength
Consider the three scatterplots below. The main difference in the scatterplots is with respect to the strength of the association between the variables. The strength of the association refers to how tightly the distributions follow a pattern. There is a relatively strong association between reaction time and alcohol consumption. There is a moderate association between income and education. There is no association between IQ and brain size.
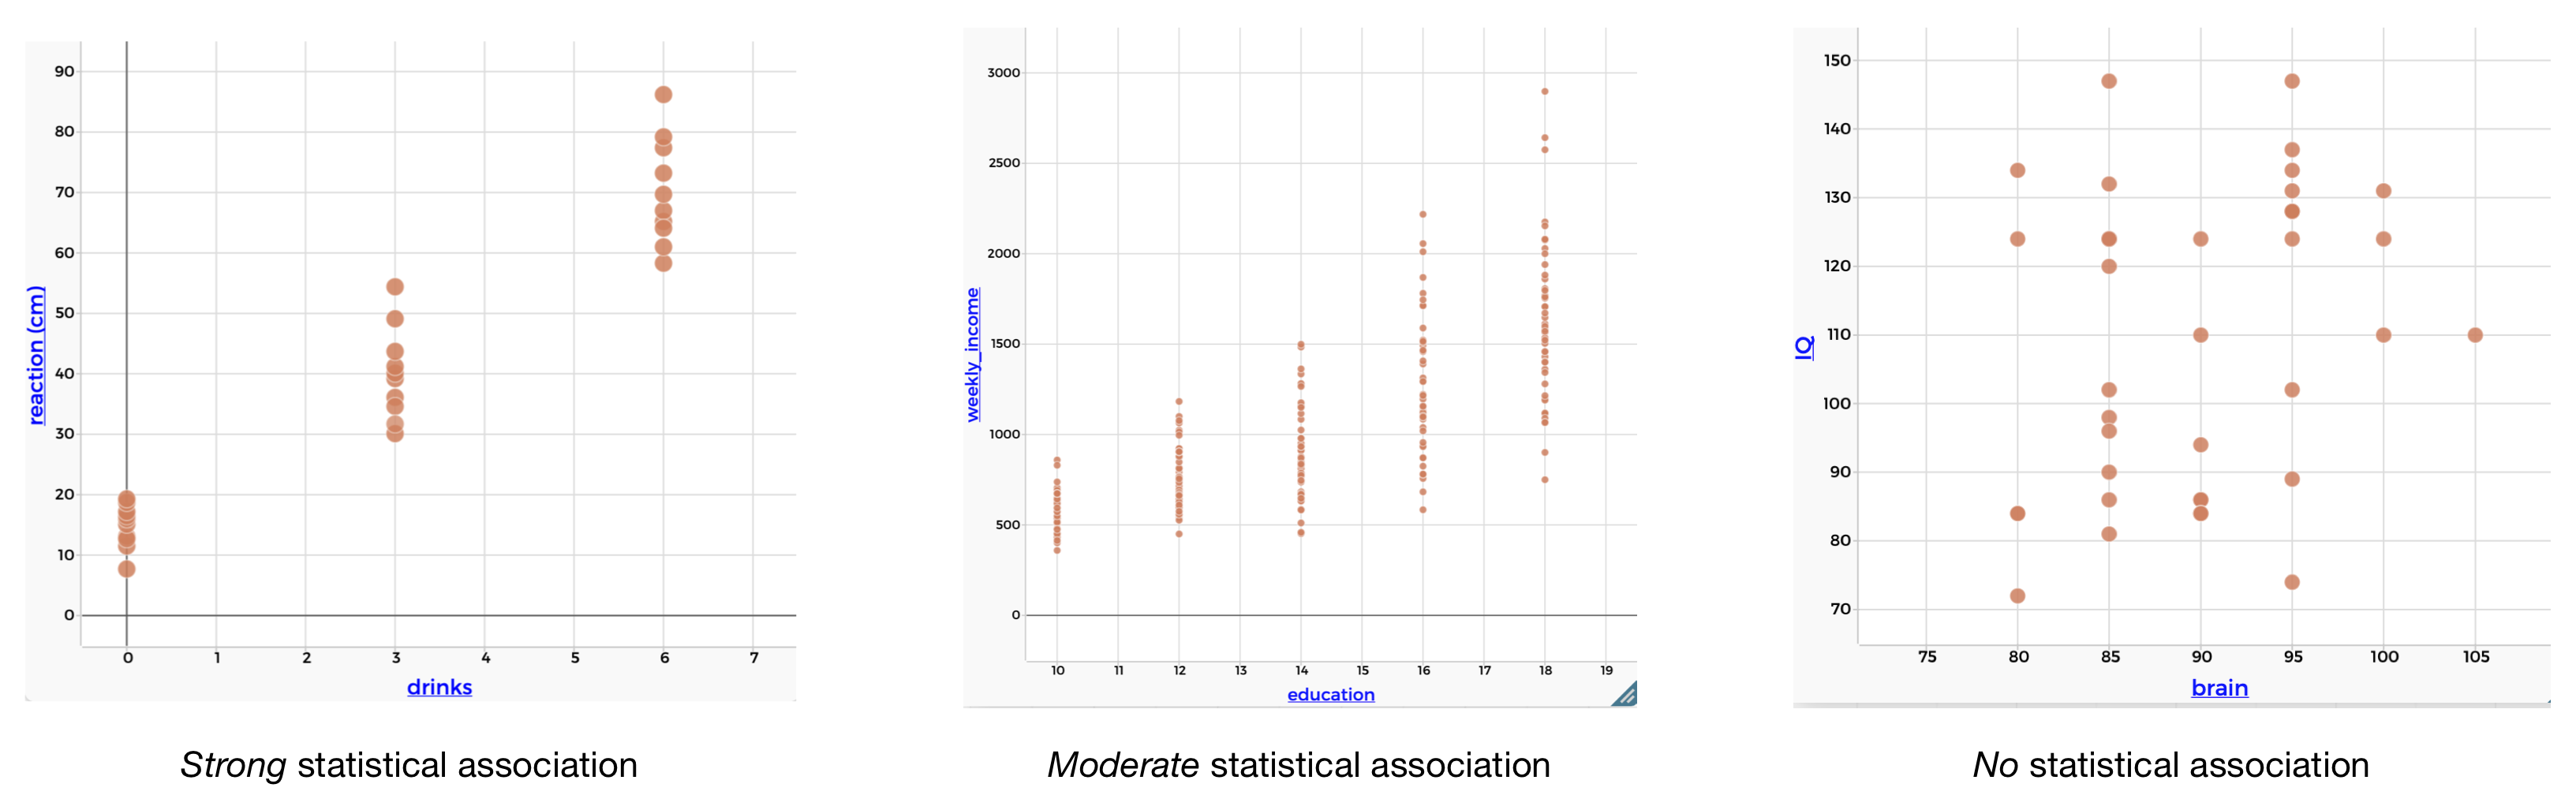
Figure 1.13: Scatterplots showing different strengths of statistical association
1.7.3.2 Direction
Consider the two scatterplots below. The main differnece is in the direction of the association. There is a postive association between reaction time and alcohol. There is a negative association between fuel efficiency and engine size.
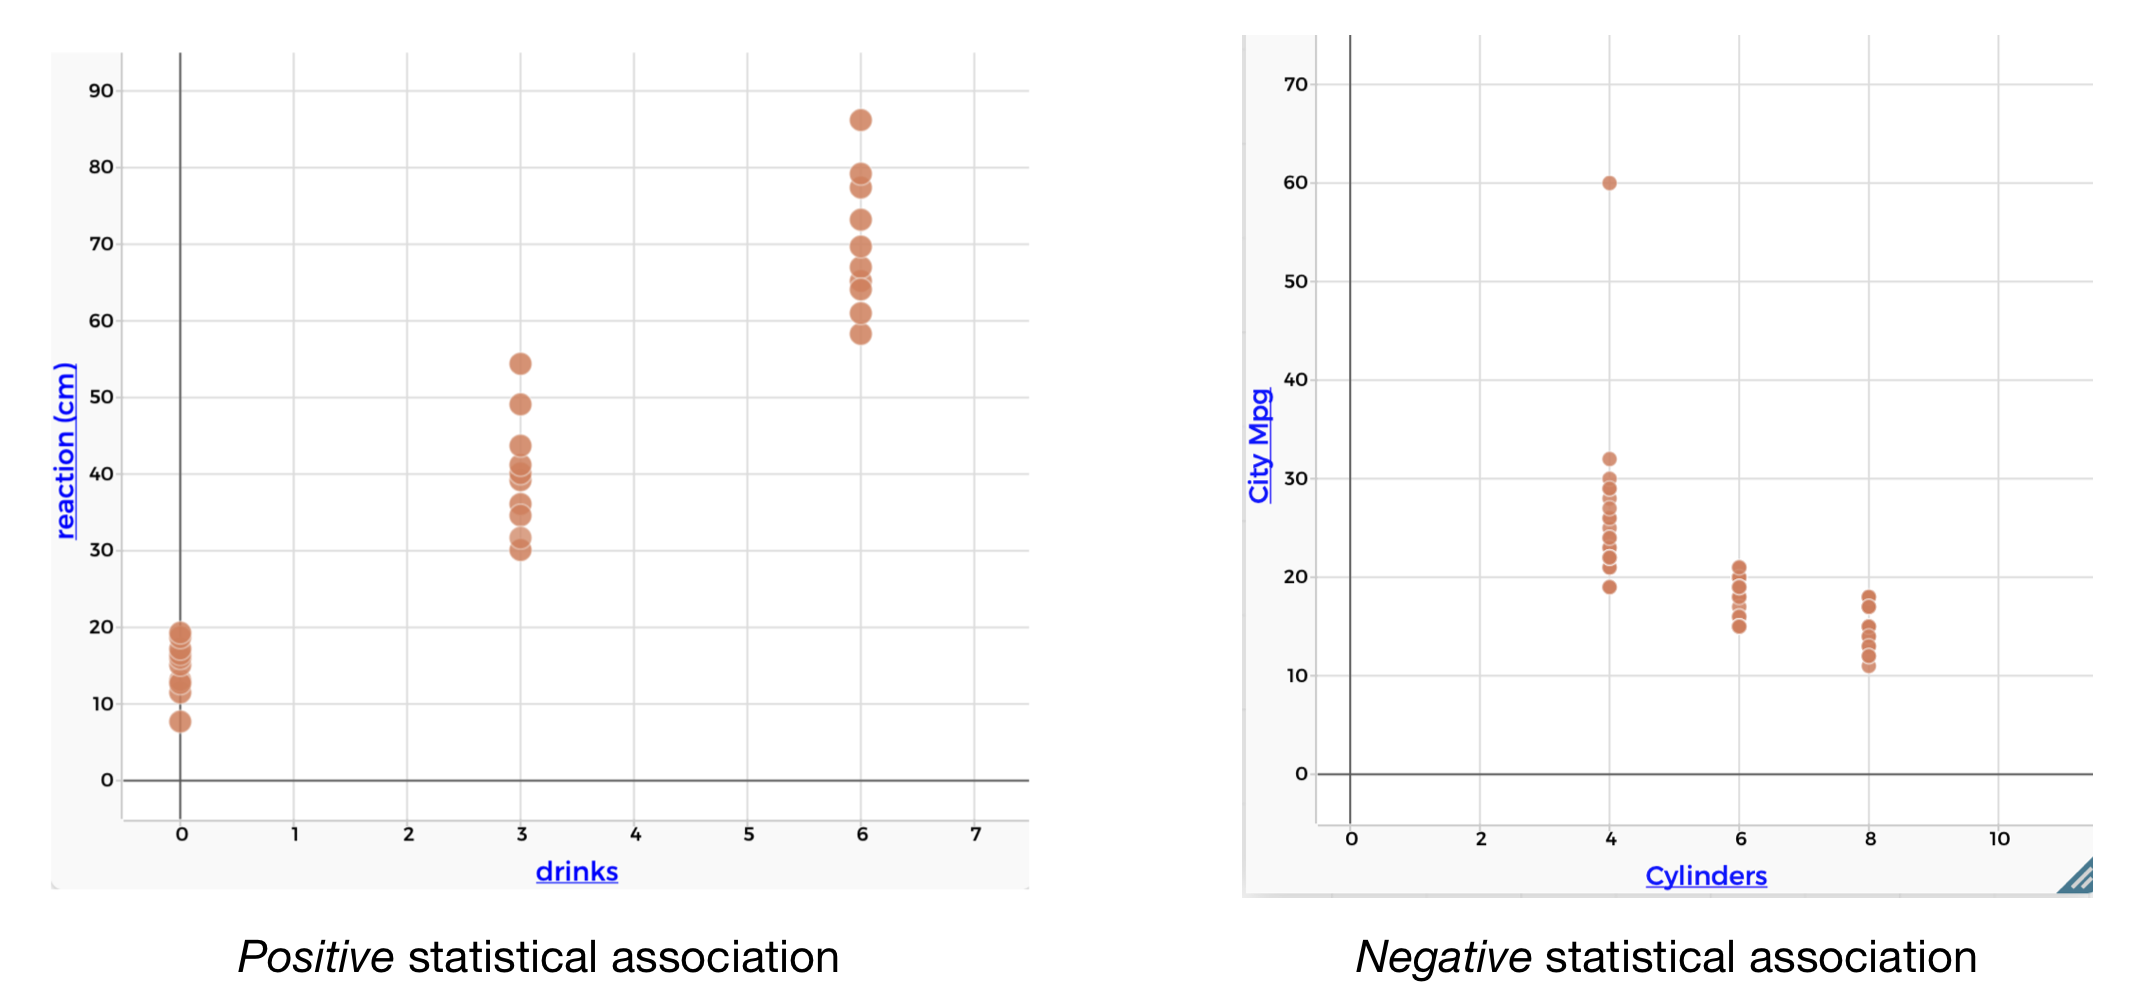
Figure 1.14: Scatterplots showing different directions of statistical association
Describing statistical association
- Describe the strength of the association as either strong, moderate, weak, or none.
- Describe the direction of the association as either positive or negative.
1.7.4 Correlation
Just like the mean summarizes the center of a distribution with a single number, it is useful to be able to summarize the statistical association between two variables with a single number. The most common statistic for this is the correlation statistic. The correlation statistic is used to summarize the strength and direction of a linear association. The figure below shows the correlation statistic for each of the associations we explored in this section.
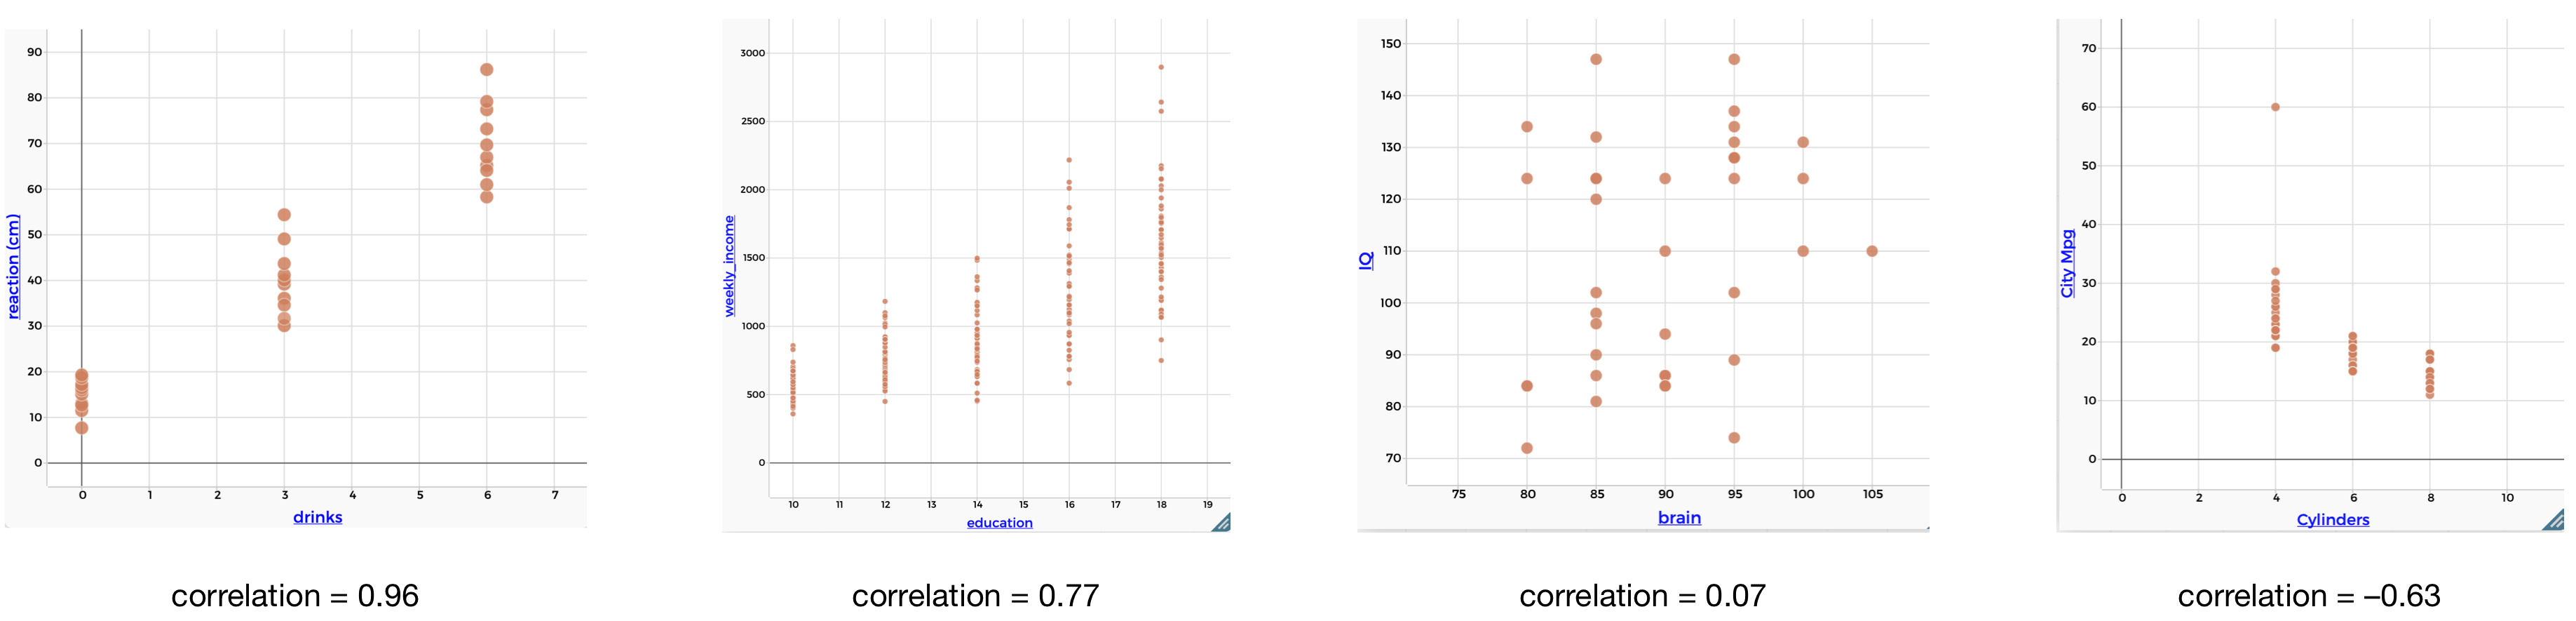
Figure 1.15: Correlations
As you can see, the correlation is always between -1 and 1. When the association is positive, the correlation is positive, and when the association is negative, the correlation is negative. The stronger the linear association, the closer the correlation statistic is to 1 (or -1). The weaker the linear association, the closer the correlation static is to 0.
The correlation statistic
- Correlation is used to describe the linear association between two variables.
- Correlation is between -1 and 1.
- The sign of the correlation indicates the direction of the association
- The magnitude of the correlation indicates the strength of the association (close to 1 or -1 indicates a strong association, close to 0 indicates a weak association)