4.4 Modeling random assignment and estimating experimental variation: The randomization test
When we are comparing two groups, our null hypothesis is:
Null hypothesis: There is no real difference between the groups (difference in means=0). Any oberved difference is due to random chance.
In this case, the “random chance” in the null hypothesis is due to experimental variation: an observed difference could be due to random chance in the assignment of participants to groups. In order to compare the observed result to the null hypothesis, we need to get a sense for the amount of experimental variation in the study—that is, how different we would be expect the groups to be just do to random chance. We can use Monte Carlo simulation for this. The model is a “shuffler” model, and the overall process is called a “randomization test.”
4.4.1 Model
The first thing to do is to create a model of the study if the null hypothesis were true. We can use a “shuffler” sampler for this:
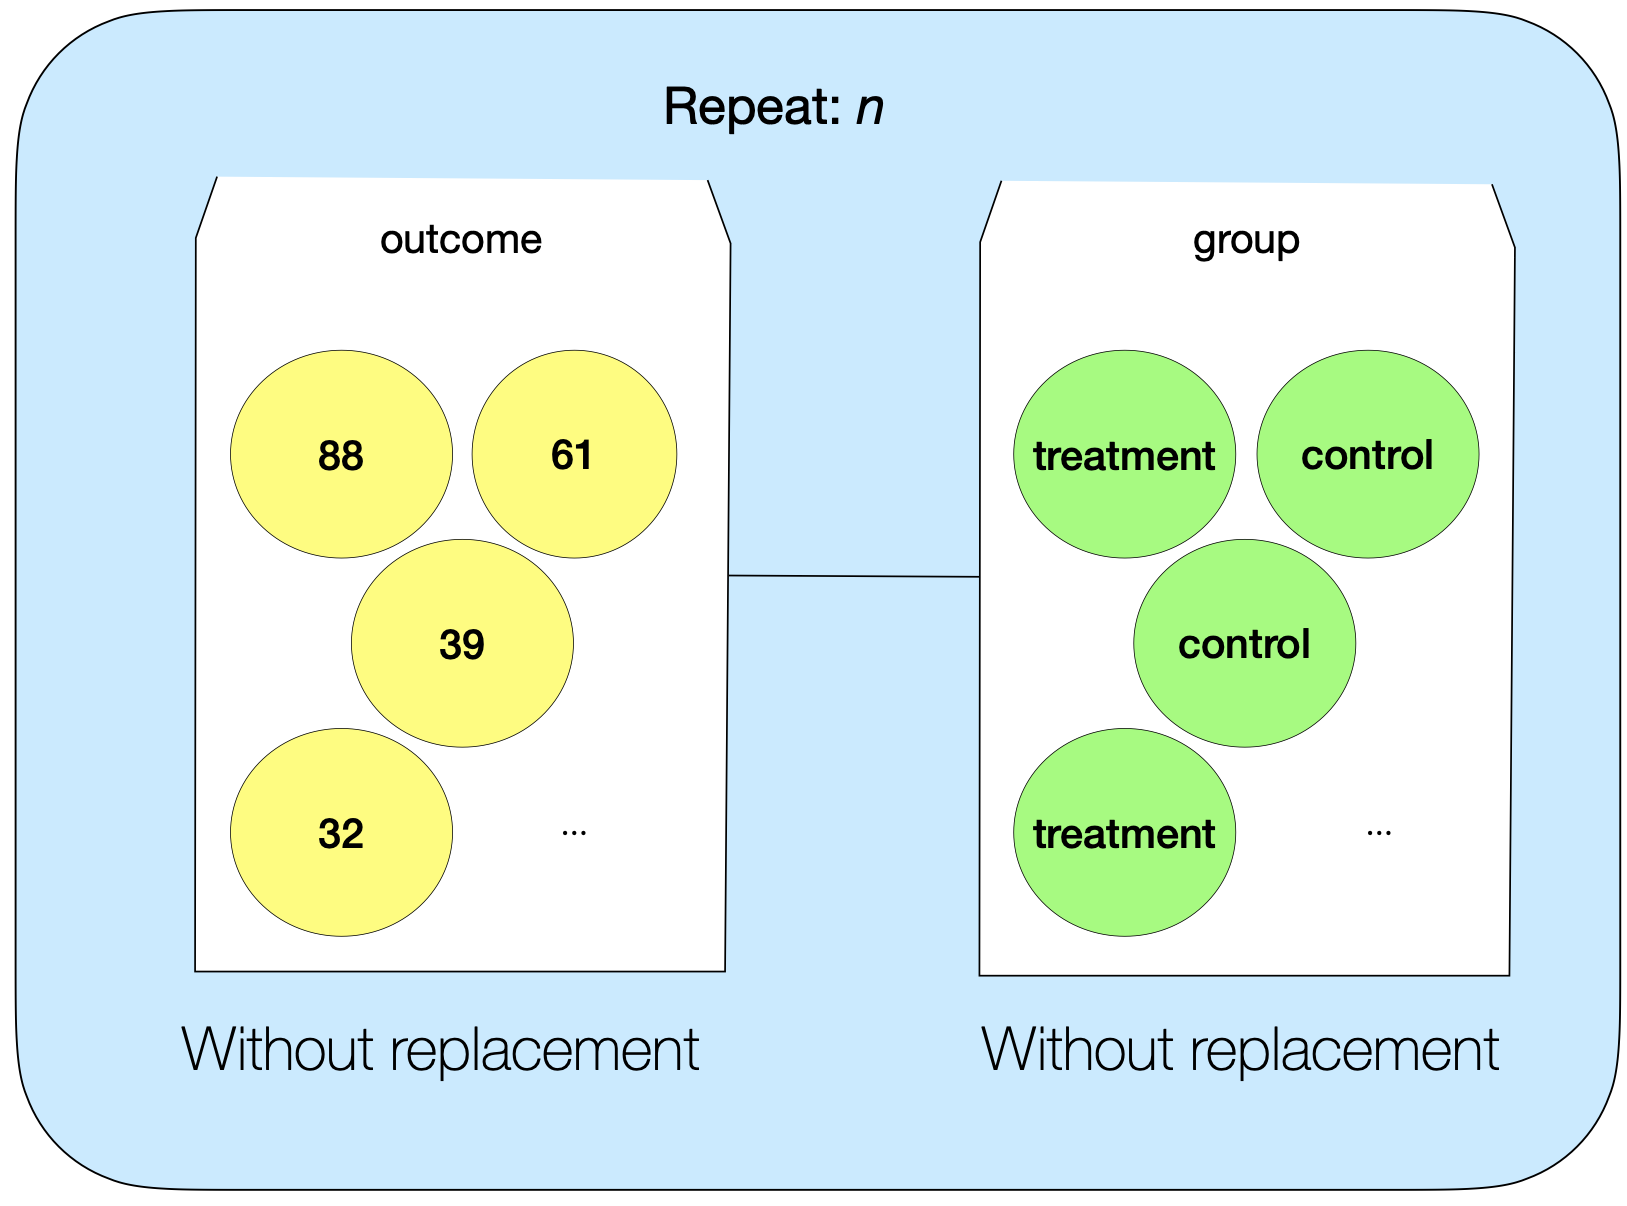
in this model, we put all of the observed outcomes into one mixer and all of the group labels into a second mixer. Both sample witout replacement. This “shuffles” the observed outcomes into new groups.
Here’s how this sampler models the study if the null hypothesis were true.
If the null hypothesis were true, the group has no effect on the outcome. The outcome for each participant is fixed and not dependent on group. We model this by combining all the outcomes together in the same mixer and sampling without replacement
If the null hypothesis were true, we still might see a difference between the groups due to random chance. We use random re-shuffling to find the variability that we would expect due to random chance
The null hypothesis says nothing about sample size, so this should match the original study. We set the repeat value to match the sample size in the original study.
The null hypothesis says nothing about the size of the comparison groups, so this should match the original study. We use the same group labels and sample without replacement
See the video below to learn how to set up a shuffler sample to model random assignment in TinkerPlots
4.4.2 Simulate
We are interested in the difference between groups that arises just due to random chance in the assignment to groups. To get a sense for this difference, we need simulated “reshuffling” multiple times, collecting the difference between groups for each trial. See the video below to learn how to collect the difference in shuffled groups for multiple trials.
4.4.3 Evaluate
After we conduct multiple simulated trials, we are left with a distribution of results that we would expect if the null hypothesis were true. The only source of variability in this distribution is experimental variation. Thus, we can estimate the experimental variation by calculating the SD of the null distribution. Then, we can evaluate the observed result against the null hypothesis in the usual ways: By comparing the observed result to the range of likely results if the null hypothesis were true, and/or by calculating a p-value.
4.4.4 Example: Memorization
See the video below for a complete walkthrough of how to set up a shuffler sampler and conduct a randomization test in TinkerPlots. The video shows the process for the memorization activity.