2.5 Regularity in randomness
In the Monte Carlo simulations, you explored the following research questions:
Coin flip: If we flip a “fair” coin 10 times, how many heads would we expect? How much variation in the results would we expect if we did this many times?
Sample of students: In a class of 25 randomly selected students, how many juniors would we expect? How much variation in the the number of juniors would we expect if we generated many samples?
At first, these questions may seem ludicrous. In both cases, we are simulating a random process: flipping a coin 10 times, or selecting a random sample of 25 students. And yet, the research questions are asking about “typical” or “expected” behavior. In other words, we are asking about the expected behavior of a random process. That seems like a contradiction!
If a trial depends on a random process, then the result is also random right? Well, yes… sort of. When you run a coin flipping simulation multiple times, you would not expect to get the same result each time. So indeed, the result of any one trial is random.
But what if you keep running multiple trials? What if we look at the outcomes of multiple trials—say 150:
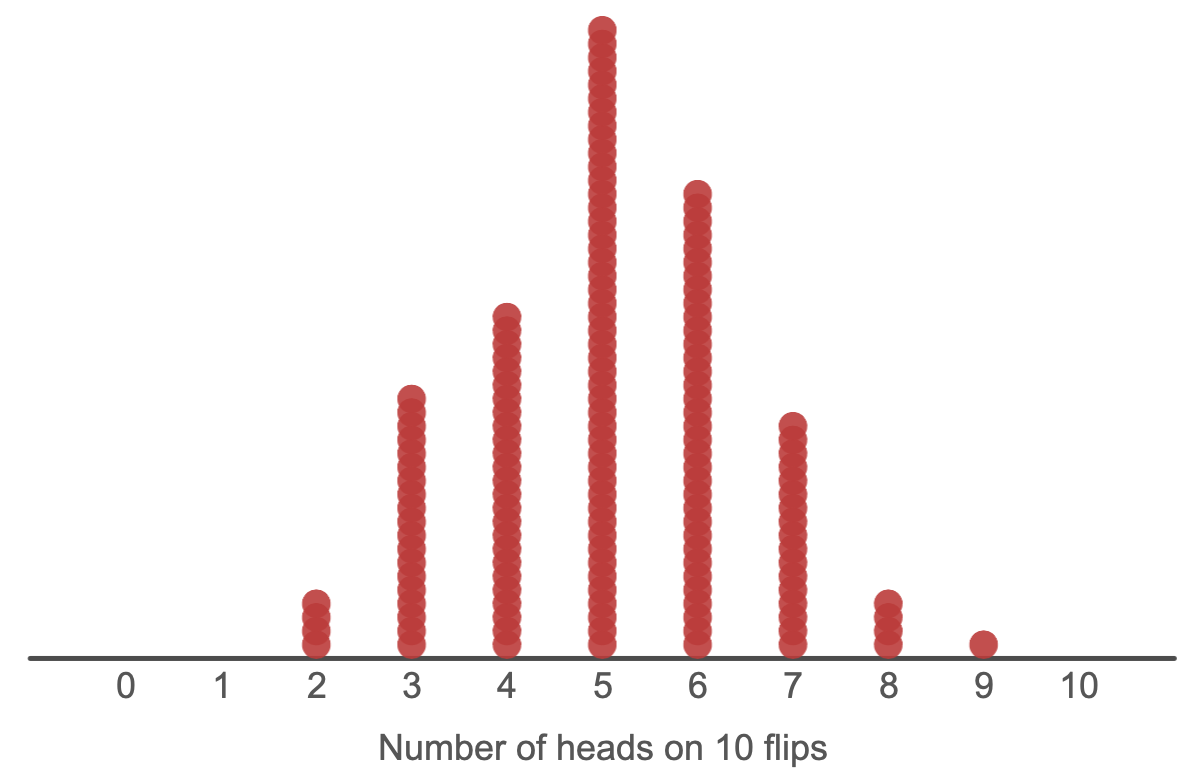
In this distribution, each dot represents the result of 1 trial (that is, the number of heads on 10 flips). There are 150 dots, becuase we ran 150 trials.
The first thing to notice is that there is variability in the results. In some trials, the result was 3 heads. In other trials, the result was 7 heads. Altogether, in these 150 trials, the results ranged from 2 heads to 9 heads (of course, if we ran 150 more trials, we might not get this exact same range). We should expect that there would be variability in the results because each trial involves a random process.
However, we can also see a pattern in the results. In particular, notice that some results are more likely than others. We might say that we “expect” to get about 5 heads on any given trial. Because there is variability, we might be more comfortable giving a “range of likely values.” In this case, we might say say that the range from 3-7 represents a range of likely values.
Although it is possible to get a result outside of this range, it is not very likely. For example, while it may be possible to get 10 heads on 10 flips, we can see that this result is very unlikely. In 150 trials, we didn’t get 10 heads even once. (For now, you can just use the plots to visually determine the expected results or the range of likely values. Later on in the course, we’ll develop a more rigorous way to determine this.)
This shows a counterintuitive fact about randomness. Just because a process is random does not mean that “anything goes.” There is regularity in randomness:
There is regularity in randomness
In a random process like a Monte Carlo simulation, the result of any one trial is random, but across many trials, a pattern emerges.
In order to study the pattern that emerges, we need to simulate many trials and record the results from each.
2.5.1 How many trials do you need to run?
The short answer is that you need to run enough trials for a pattern to emerge in the results. At first, the results will be all over the place. The distribution of the results will not have a clear shape, and the mean and SD of the distribution will change each time a new result is added. Eventually, however, the distribution of the results will take shape, and the mean and SD will be essentially unaffected by adding new results. Once this happens, then you have run enough trials.
For our class, a good rule of thumb is to run 500 or 1,000 trials. For a published study, scientists would likely run tens—or even hundreds—of thousands of trials (but they would use software that is faster than TinkerPlots™!)