2.10 A closer look at statistical hypothesis testing
Statistical hypothesis testing involves making a comparison. We start with an observed result from the world. We then compare the observed result to a null hypothesis. We can think of this comparison as a process of weighing evidence.

Figure 2.2: Comparing the observed evidence to a null hypothesis.
For example, we may observe that in a random sample of 50 breakups reported on Facebook, 26% were reported on Monday. If breakups were equally likely each day, we would expect 1/7 (~14%) to be reported on Monday. 26% > 14%, so it seems that breakups really are more likely on Mondays.
But wait! The observed result comes from a random sample of 50 breakups. Even if there really was no effect—that is, even if breakups were equally likely every day—we would expect to see some variation in the observed results from a random sample, just to due random chance. Maybe, just by chance, we got a sample with a lot of Monday breakups! Before we can make a comparison, we need to account for the role of randomness.
At this point, you might be tempted to throw up your hands. Because the null hypothesis allows for randomness, anything is possible, including the observed result! How can an observed result ever “outweigh” the null hypothesis? That’s good intuition, and in fact we can never prove that the null hypothesis is wrong. Even if the observed result is very different from the null hypothesis, there is always a chance that the null hypothesis is true and the observed result is just due to random chance.
But all is not lost. Remember that there is regularity in randomness. Even in a random process there are patterns. Some results are more likely than others. If we can get a sense for the range of results that are likely under the null hypothesis, we can check our observed result against this range. If the observed result is outside the range of likely results, that would provide evidence against the null hypothesis.
How do we find the range of likely results under the null hypothesis? Because the null hypothesis specifies a probability model, we can use Monte Carlo simulation to find the range of likely results:
Model: Using a sampler in TinkerPlots, build the probability model specified by the null hypothesis.
Simulate: Use TinkerPlots to simulate multiple trials.
Evaluate: Plot the distribution of results from multiple trials. This gives us a good picture of the results we would be likely to see if the null hypothesis were true. We can now evaluate the observed result in light of this distribution. If the observed result is outside of the range of likely results, that provides strong evidence against the null hypothesis. Otherwise, the observed result is compatible with the null hypothesis.
Conclusion: State the conclusion in terms of evidence against the null hypothesis. If the observed result is not compatible with the null hypothesis, this suggests that there really is an effect.
Notice:
- We do not prove anything. Instead, we simply determine whether the observed evidence is compatible with the null model. If we have strong evidence against the null hypothesis, this suggests that there may be an effect.
- This process does not tell us anything about what caused the effect.
- We don’t know the size of the effect. We only determine whether the observed evidence is compatible with the null hypothesis.
2.10.1 Example: Monday breakups
Let’s look at the Monday breakups activity as an example. We start with a comparison between the observed result and the null hypothesis.

Figure 2.3: Statistical hypothesis testing involves comparing the observed evidence to a null hypothesis.
There is suggestive evidence that breakups really are more likely to be reported on Monday. However, to assess the strength of this evidence, we need to explore the variation that we would expect to see just by chance, if the null hypothesis were true. We do this using Monte Carlo simulation:
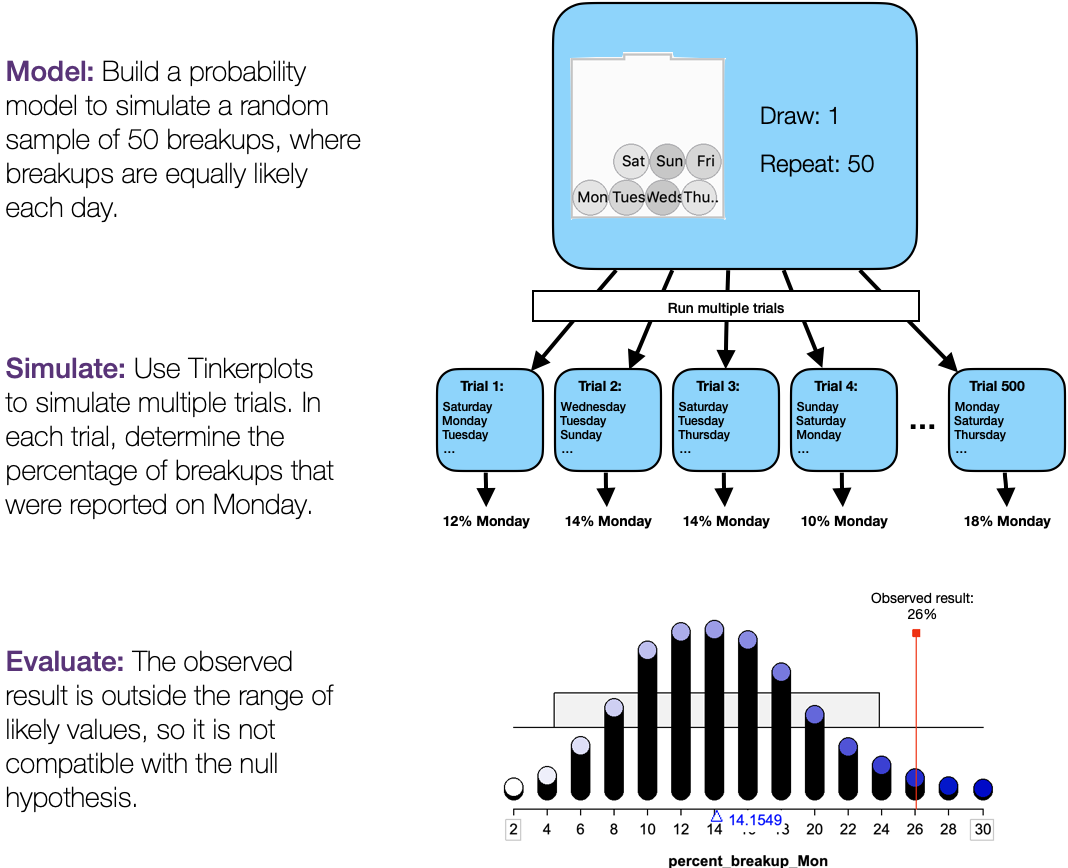
Let’s unpack this for a moment. We used Monte Carlo simulation to examine the percentage of breakups we would expect to see reported on Monday in a random sample of 50 breakups if the null hypothesis were true. The dot plot gives us a good summary of the distribution of the results we would expect to see in a random sample of 50 breakups, if the null hypothesis were true.
- The distribution of results is unimodal and slightly skewed right but generally symmetric.
- The mean of the distribution is 14.2% and the SD is 4.9 percentage points.
- The range of likely results is 4.4% to 24% (\(14.2 \pm 2 \times 4.9\))
The mean of the distribution tells us that a “typical” result 14.2%. That is, if the null hypothesis were true and we took a random sample of 50 breakups, we would expect about 14.2% to be reported on Mondays.
We can also see that there is variation in the results due to randomness. We can describe the variation using the standard deviation. The SD is 4.9 percentage points, which tells us that the percentage of Monday breakups varies by about 4.9 percentage points from sample to sample.
We can find a range of likely results by adding and subtracting 2 × SD from the mean. Altogether, if the null hypothesis were true and we took a random sample of 50 breakups, the percentage that were reported on Monday would likely be between 4.4% and 24%.
Now we can compare the observed result with our simulation. In real life, our sample had 26% of breakups reported on Monday. This observed result is outside of the range of likely results if the null hypothesis were true, and so it is not compatible with the null hypothesis. This leads to our conclusion:
Conclusion: The observed result is not compatible with the null hypothesis. This suggests that breakups may be more likely to be reported on Monday.

Figure 2.4: The observed results is not compatible with the null model. This provides strong evidence against the null hypothesis and suggests that breakups are more likley to be reported on Mondays
Notice:
- We did not prove that breakups are more likely to be reported on Monday. Instead, we simply have strong evidence against the null hypothesis (that breakups are equally likely each day). This, in turn, suggests that breakups are more likely to be reported on Mondays.
- We don’t know what caused the effect.
- We don’t know the size of the effect. Perhaps the true percentage of Monday breakups is 26%. Perhaps it is slightly more or slightly less. We only have evidence that the results are incompatible with the null hypothesis.
- We don’t know the scope of the effect. Perhaps the phenomenon is limited to this particular year, or to breakups that are reported on facebook, etc.
(We will learn about size, scope, and causation later in the course. The key point to understand now is that a hypothesis test, by itself, can not tell us about these things.)
2.10.2 Summary
The box below summarizes the key points about statistical hypothesis testing.
Key points about statistical hypothesis testing
- Hypothesis testing involves a comparison between the observed results and a null hypothesis
- Hypothesis testing is a process of “weighing evidence” against the null model
- We use Monte Carlo simulation to determine the range of likely results under the null model and compare that to the observed result
- If the observed result is outside the range of likely results, that provides strong evidence against the null model.
- Hypothesis testing does not prove anything. We only determine if there is evidence against a null model, which in turn would suggest that the effect is real.
- Hypothesis testing says nothing about what caused the effect
- Hypothesis testing does not tell us the size of the effect, only whether the results are compatible with the null hypothesis.
- Hypothesis testing does not tell us the scope of the effect (that is, how broadly the result apply).