4 Geocoding
At this point, you should be familiar with the ArcGIS Online Mapping interface. You are now ready to start adding data layers of your own to a basemap. Neighborhood Assignment #3 asks you to create a map of the most important/influential/powerful/interesting non-profit organizations in or near your neighborhood. To do this, we will need to two sources of data - the locations of the non-profits and the neighborhood boundaries. The non-profit locations and neighborhood boundaries will be two separate data layers on your map. We will need to create the non-profit locations data through a process called geocoding. The census tract boundaries of your neighborhood have been provided to you as a layer in our class AGOL group. In the sections below, we will walk through geocoding the non-profit locations and accessing the neighborhood boundaries through our group’s shared content.
4.1 What is Geocoding
Geocoding is the process of transforming a street address to a location on the Earth’s surface, so that it can be displayed as a point on a map. You can import one street address at a time to geocode or provide multiple addresses at once in a table. Under the GIS hood, the “database side” of GIS looks up the street address in a street segments data layer and finds the pair of latitude and longitude coordinates that correspond with that street address. Those coordinates are attached as attributes to the street address you provided and plotted as geographic features on the map. The resulting layer of geocoded points can be stylized on a map and analyzed with geoprocessing tools.
4.2 Preparing Data for Geocoding
Assignment #3 requires that you have at least 10 non-profits on your map, so we will go ahead and batch geocode all 10 locations at once by recording the addresses in a table. Be sure to follow the GuideStar non-profit look-up tutorial on Canvas to identify your 10 important non-profits. Once you have identified the 10 important non-profits be sure that they have physical street address.Do NOT use PO box addresses; the geocoder will not recognize them and give you an error.
The screenshot below demonstrates an appropriate way of formatting your non-profit data for the geocoder.
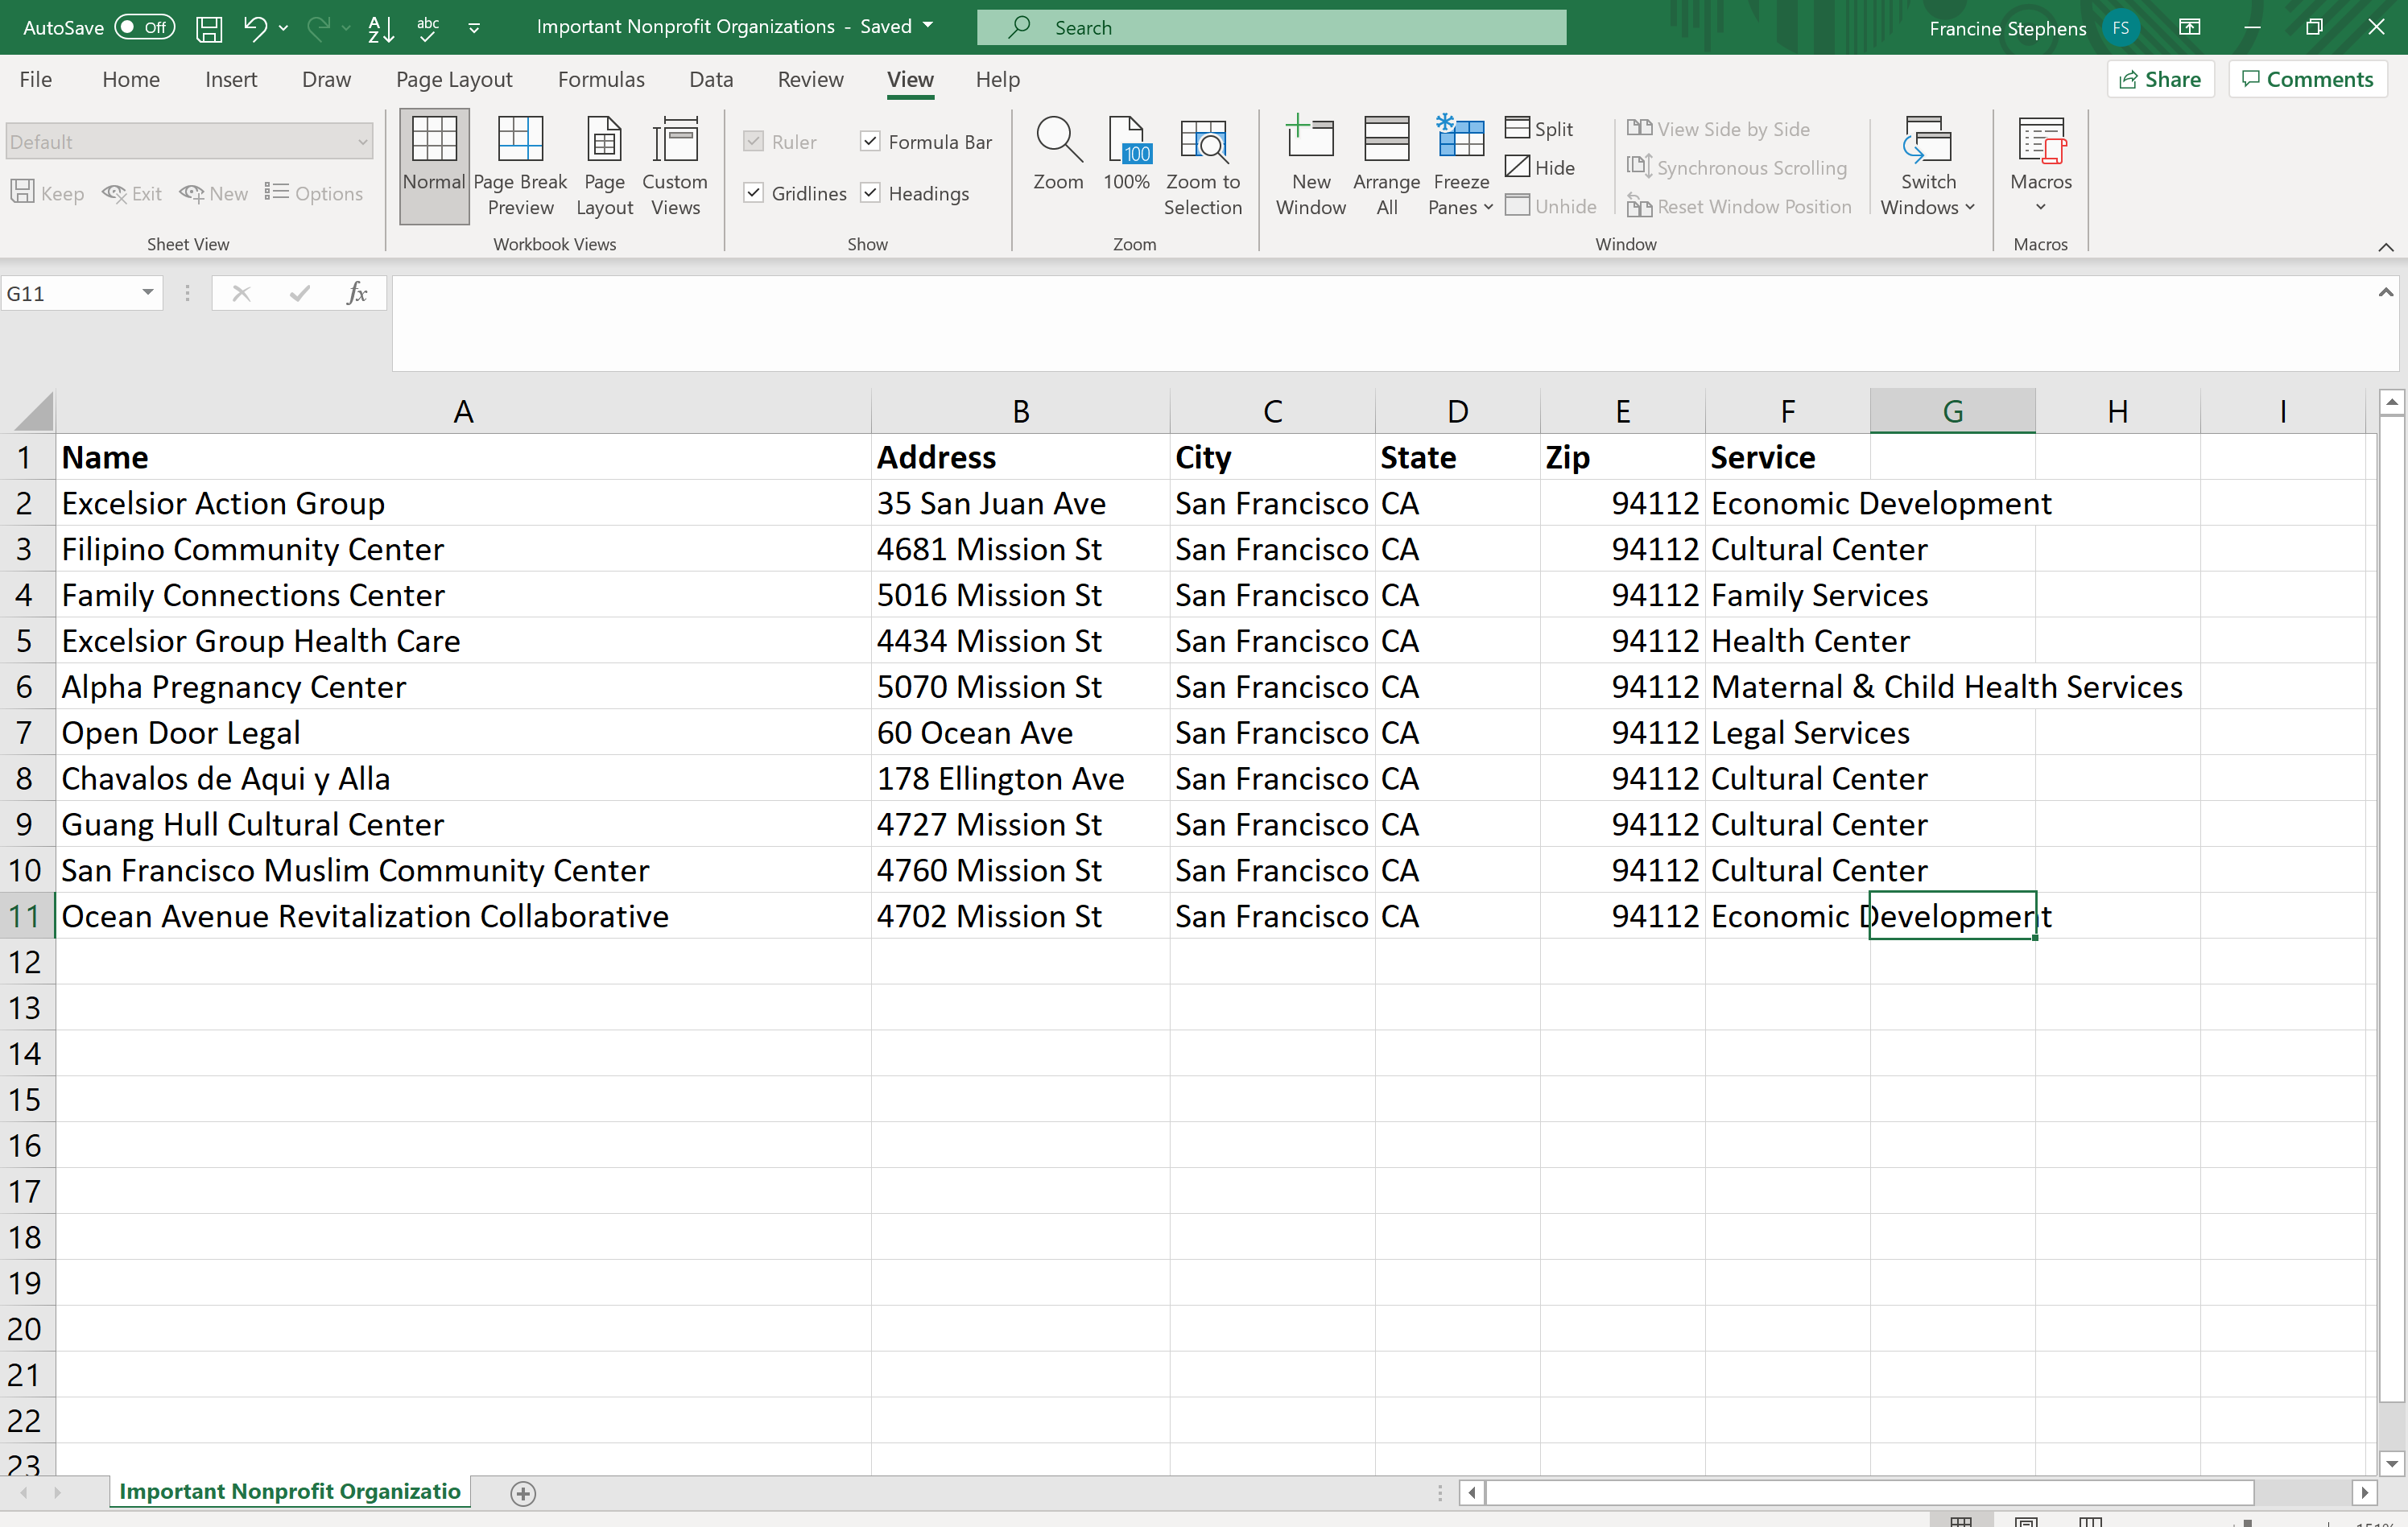
Format the address data
- Open up a spreadsheet software of your choice.
- Then, create a header row at the top of your spreadsheet that has cells for the name of the organization, the Address, City, State, Zipcode, and type of service the organization provides.
- You do not need to bold the text. I did that just to illustrate that this is a header row that AGOL will interpret as the attributes of your data.
- If you use the same header names for the address components that I have, the AGOL geocoder will auto-detect the fields correctly. This will eliminate a couple of mouse-clicks from your workflow.
- Each row will represent a non-profit that you have selected. Enter the name of the organization. Then, parse out the components of the address, starting with the street address, then the city name, the state abbreviation, and the five digit zipcode. The last column holds a description of the type of service the organization provides.
- It is okay to use common street type abbreviations in the street name (e.g., St for Street, Ave for Avenue) because the geocoder will recognize them.
- The service type column is not necessary for geocoding, but it will be helpful when we style the symbology in our map. Symbology is the cartographic term for the icon or shading you use in your map to represent attributes of your data.
- Once you have entered the address information for your non-profits, save the spreadsheet as a CSV.
You are now ready to bring the table of addresses into AGOL for geocoding.
4.3 Geocoding in AGOL
Open up Mapviewer and start with just the basemap. Feel free to change the basemap if you would like. You can also zoom into your neighborhood using any of the Zoom/Pan options or use the Search Bar, which is what I did. When you are ready to upload the non-profit locations, navigate to the Add Button on the Toolbar and follow the steps in the GIF below.
Geocoding
- Select Add layer from File.
- Find and select the CSV file that you saved with the addresses. Import the layer.
- You will see an Add CSV Layer dialogue box. Fill out the options as follows:
- For Locate features by, select the Address or Places radio button.
- Be sure you are using the ArcGIS World Geocoding Service.
- For the In option, use the drop down box and find the United States.
- Finally, review the Field Name from your table and Location Name columns in the table. Make sure that they match up. If you named the columns as I did above, then they should automatically populate as they should. That is, Name should be Not Used; Address should be Address or Place; City should be City; State should be State; and Zip should be Postal. Service is not used.
- When you are sure that the Table Field Names and Location Field Names match up, select Add Layer.
- Now you should see the non-profits plotted as points on the map.
4.4 Changing the Symbology
Don’t leave the non-profit locations as colored dots. Instead, let’s style the locations with symbols that reflect the type of service the non-profit provides. This is shown in the GIF above (My apologies for not separating this part in the recording).
- In part 1, select the field labeled Service in the drop-down menu.
- Then select the Options button on Types in Part 2.
- You should see all of the labels for Serve appear next to the colored dots. Click on a colored dot icon, and you should see a dialogue box with other symbol options. Stay in the shape symbol type, and use the drop-down menu to find symbols that would represent the services provided by the non-profits in your neighborhood.
- When you find an icon you like, you might also want to change the symbol size before you move on to the next symbol.
- When you are happy with all of your symbols, select Okay and then Done. You should see the Contents pane contains the non-profits data layer.
If you click on the Show Legend button underneath the layer name (highlighted in the image below), the icons and labels will appear. Also, if you click on any of the icons on the map, you will see a pop-up emerge for that location. All of the information in your table is contained in the pop-up. These pop-ups will be more relevant later on when we build our story maps. Now, if you are happy with your non-profits, you can now move on to the neighborhood boundaries.
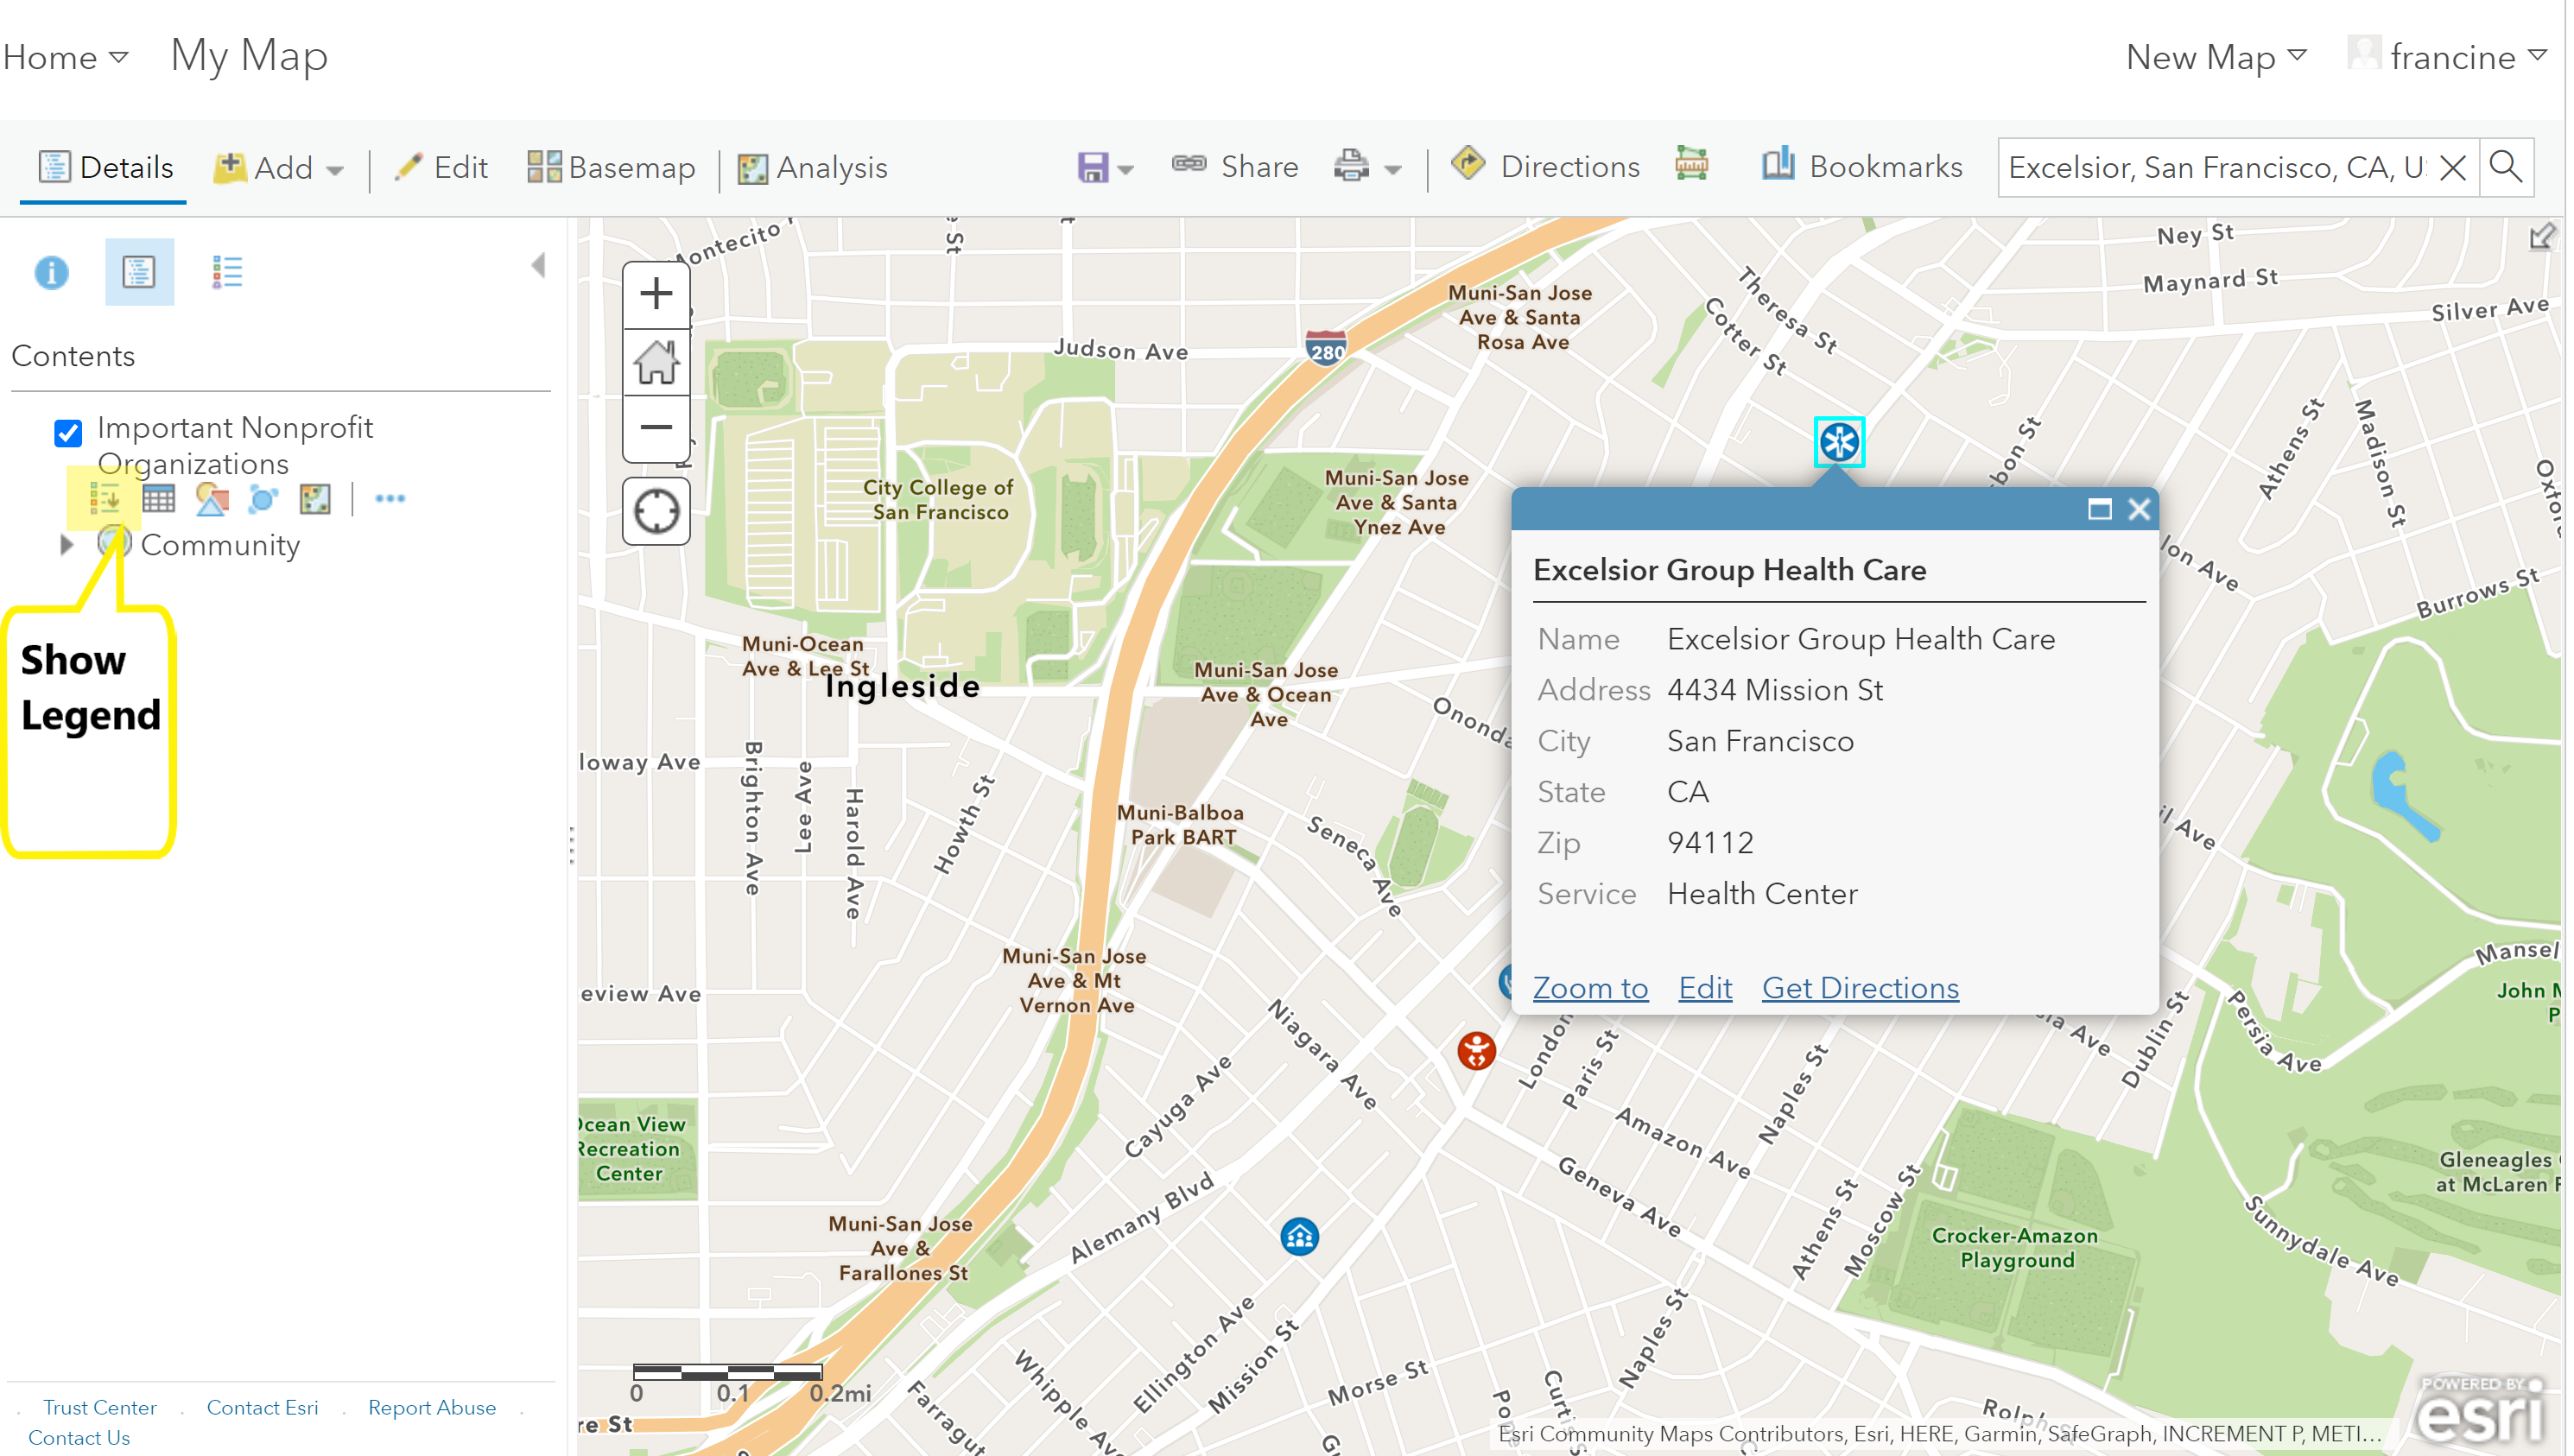
Non-profit locations symbology and popups
4.5 Plotting Neighborhood Boundaries
The neighborhood boundaries are saved in our class’ group page - The Social Life of Neighborhoods. We will use the Add Button again to add the layer from our group page. The GIF below shows the steps, which are also written out below.
Importing neighborhood boundaries
- Select Search for Layers. Layers in My Content will be shown first, but you should find the drop-down options and select My Groups. Scroll through the Groups layers to find your neighborhood. Click on the Plus button on the bottom right corner of your neighborhood layer. You can close out the search for layers panel when you see the neighborhood polygon populate on your map and in the Contents pane.
- The neighborhood is a colored polygon when imported onto the map. We should change the symbology to just show the boundaries and not color the full area of the neighborhood.
- Click on the Neighborhood layer in the Contents pane, and navigate to the button with three shapes. This is the change style button.
- Keep the show location only option selected in part 1. In part 2, select Options.
- Then, click on the symbol to change the symbology. The Fill style will come up first. Select no color option to remove color from the neighborhood area. This will leave the inside of the polygon transparent.
- Then, select the Outline option and pick a color to outline the neighborhood boundaries. You might also consider changing the heaviness of the line by increasing the line width.
- When you are happy with the style, select Okay and then Done, to get back to the map and contents pane.
- Lastly, clean up the name of the layer in the Contents pane. On the layer, click the three horizontal dots button on the layer, which prompts a drop-down list of options. Select rename and change the name.
NOTE: The neighborhood boundary files have been named based on this syntax: “nhood_name_cityname”. If you listed multiple names for your neighborhood, the first name may only be listed in the file name for brevity. The city name may be abbreviated in some instances. If you have trouble finding your neighborhood based with this naming system, open up a new tab in your browser and go to the group page content. The content has been organized, so you can filter to the files that have been categorized as neighborhood boundaries. Scroll through the neighborhood boundaries. You should be able to see the outlines and find the one that looks like your neighborhood.
4.6 Exporting your map as a PDF
Update: The assignment instructions have been changed since they were first published. Because exporting the map to a PDF is a little cumbersome, you now have the option of submitting your map as a web map via a link. The instructions below will guide you through both options.
If you click on the Legend button in the Content pane, you will see both layers and the detailed symbology. When you are happy with the look of your map, save the map by going to Save button (the disk) on the Toolbar. You will need to select the Save As option because it is the first time you are saving the map. Give the Map an informative title and a few tags when you are saving it.
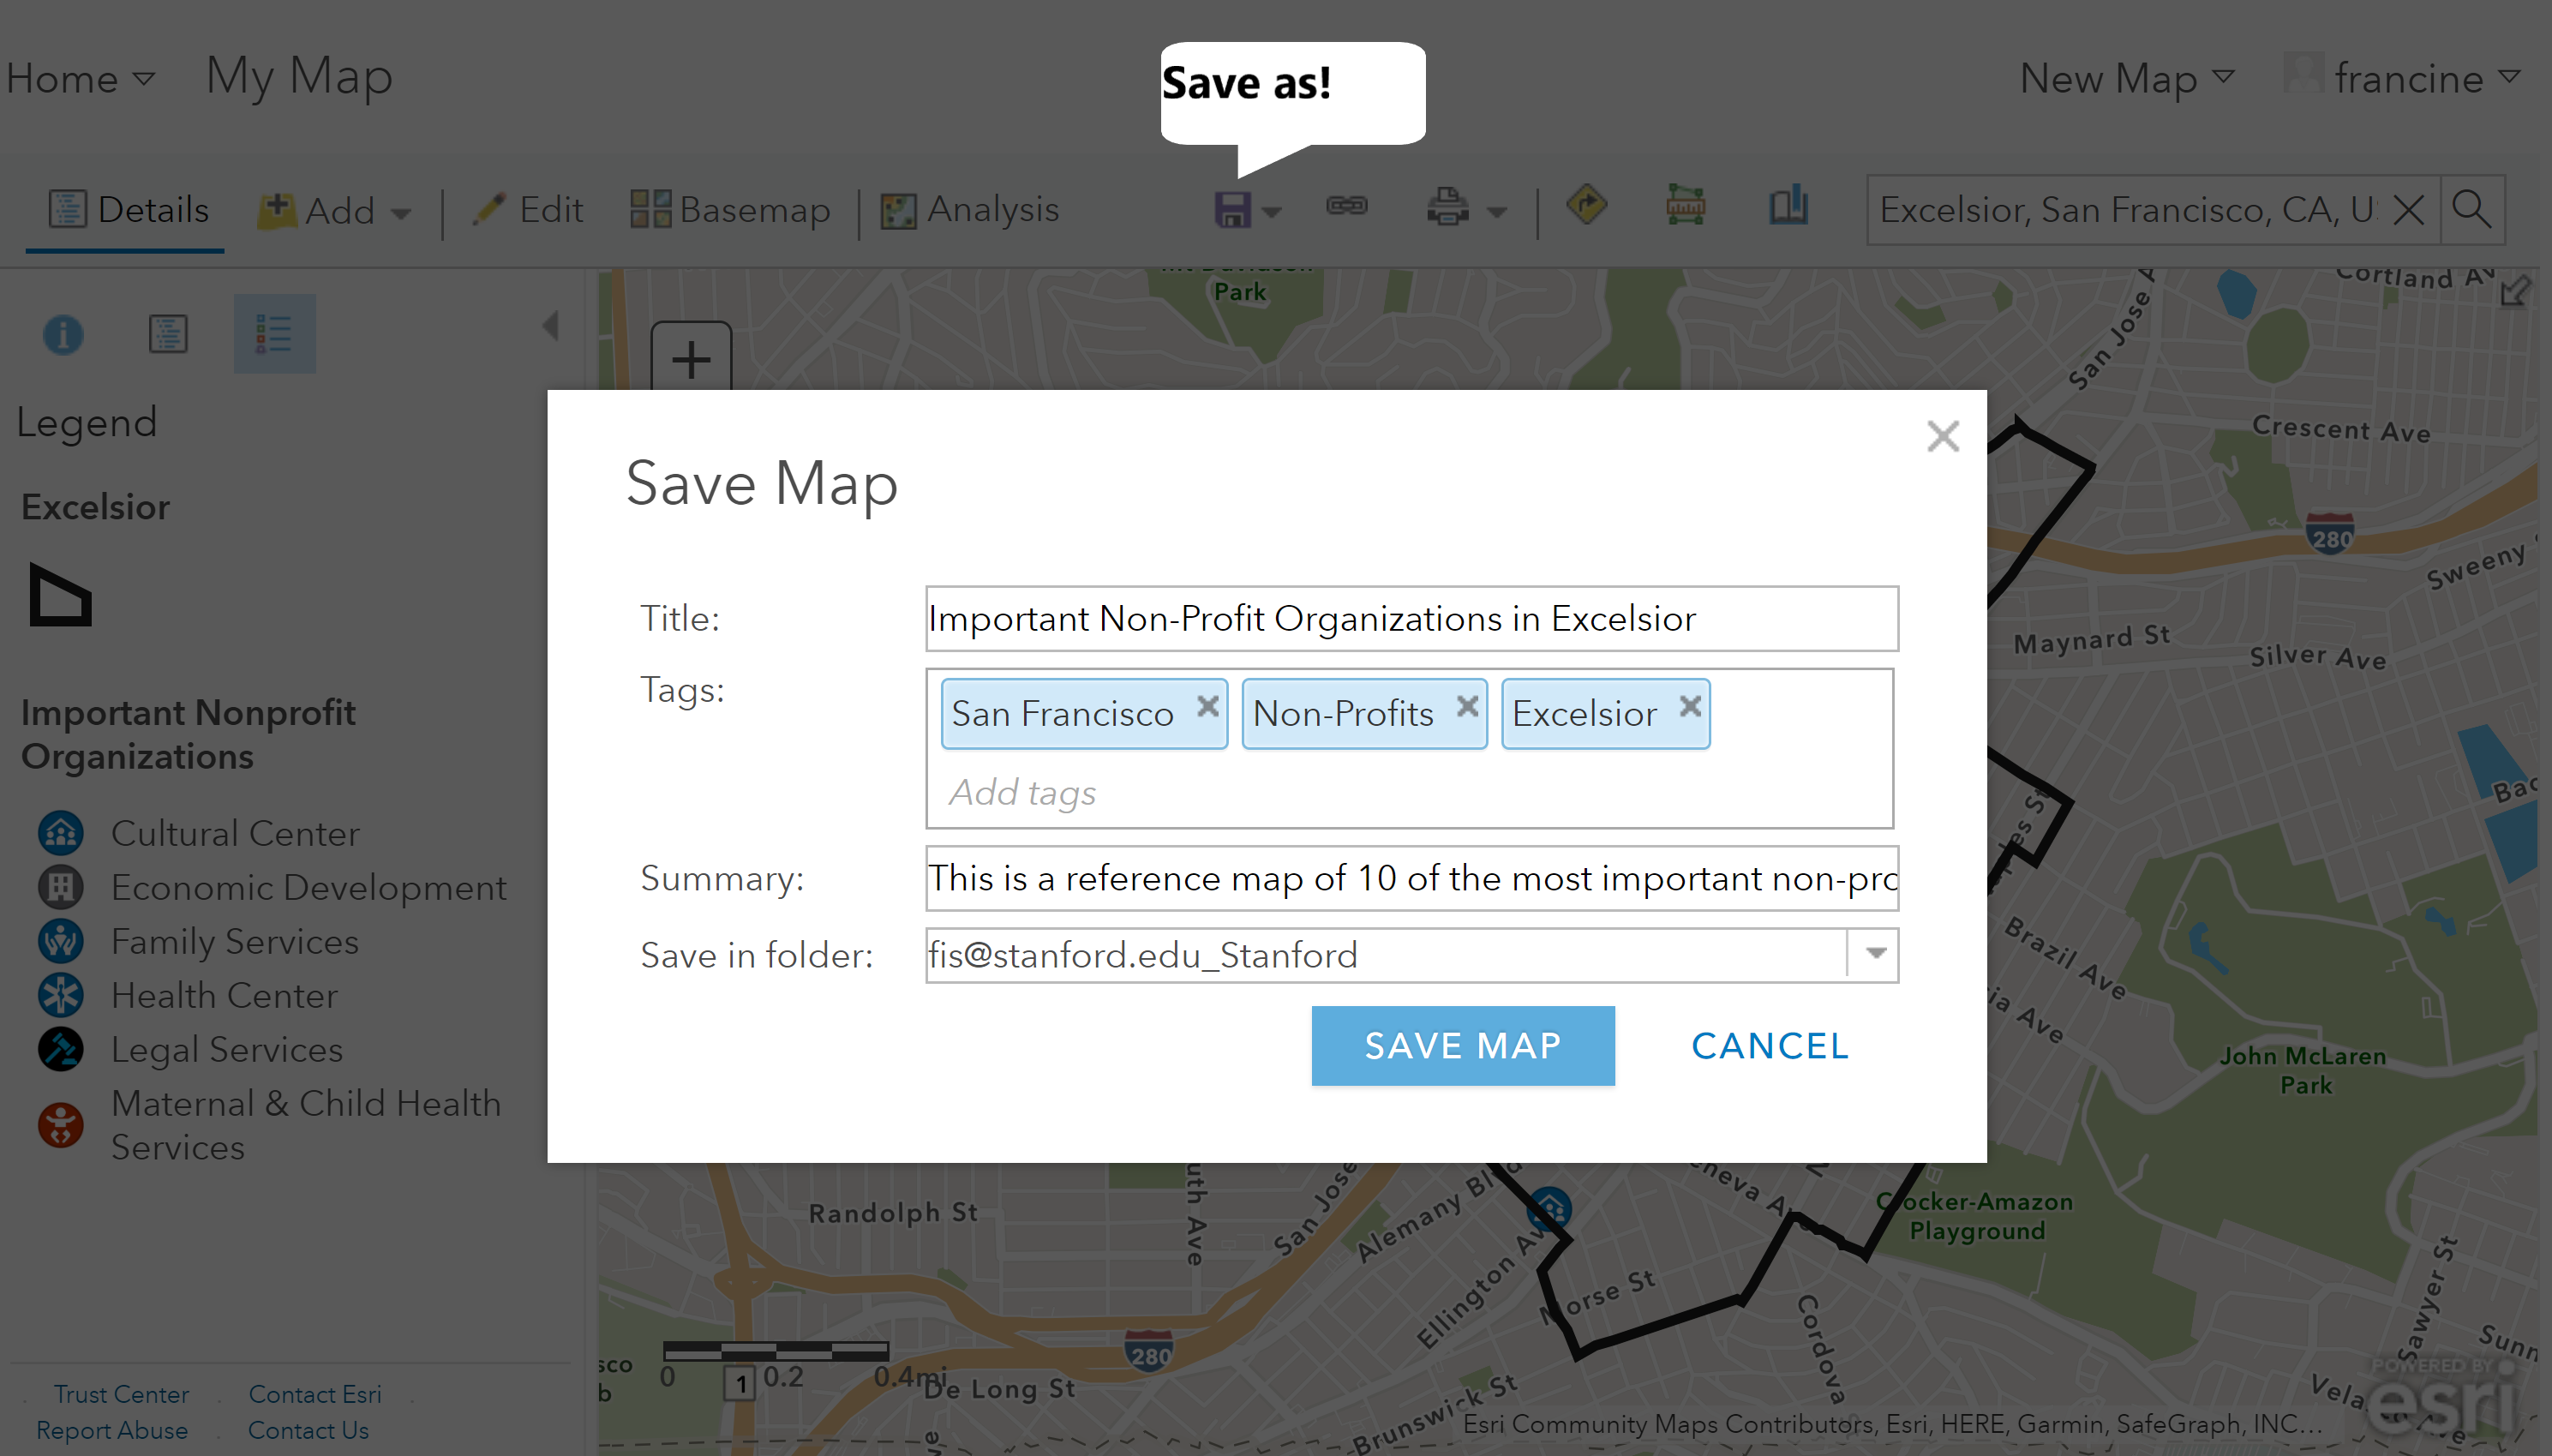
Saving your map
The map is saved to your Content page in AGOL. For this assignment, you will also want to export the map as a PDF. This is also a multi-step process that converts your webmap to a web-app and then to a PDF file (This seems like a lot of work). The GIF below will walk you through it along with the steps that are written out below.
Transform webmap to a web-app
- Navigate to the Share button (the chain-link icon) on the toolbar. You can ignore the content at the top of the dialogue box. Find and click on the Create a Webb App button toward the bottom of the page.
- You will be redirected to a new dialgoue box to Create a New Web App. Select the middle tab that says WebAppBuilder.
- Again, you are redirected to a new dialogue box, but the information in it should look familiar. The boxes should contain the information you included when you saved your webmap. Make sure that the radio box next to the sentence: “Share this app in the same way as the map (The Social Life of Neighborhoods)” is checked. Then, scroll to the bottom of the page and click get started.
- Navigate over to the Widget controller on the WebApp Interface. Scroll down the left hand panel to the empty widget place-holders. Click on one of the empty ones. You will be redirected to an array of widgets. Find and select the Print widget. Be sure to select a print option other than Map_Only and to have the Show Legend option selected.
- Next, add the legend widget to one of the other empty widget containers.
Print the webapp as a PDF
- Select the Print widget icon on the map.
- Title the map (again). Then select a layout option other than Map_Only. Keep the layout as PDF, and then select print.
- When the PDF icon shows up on the print panel, select it so that it will open. You can save the PDF and submit it along with your write-up.
Your PDF map should look something like this. Make sure that all of the layers are showing up.
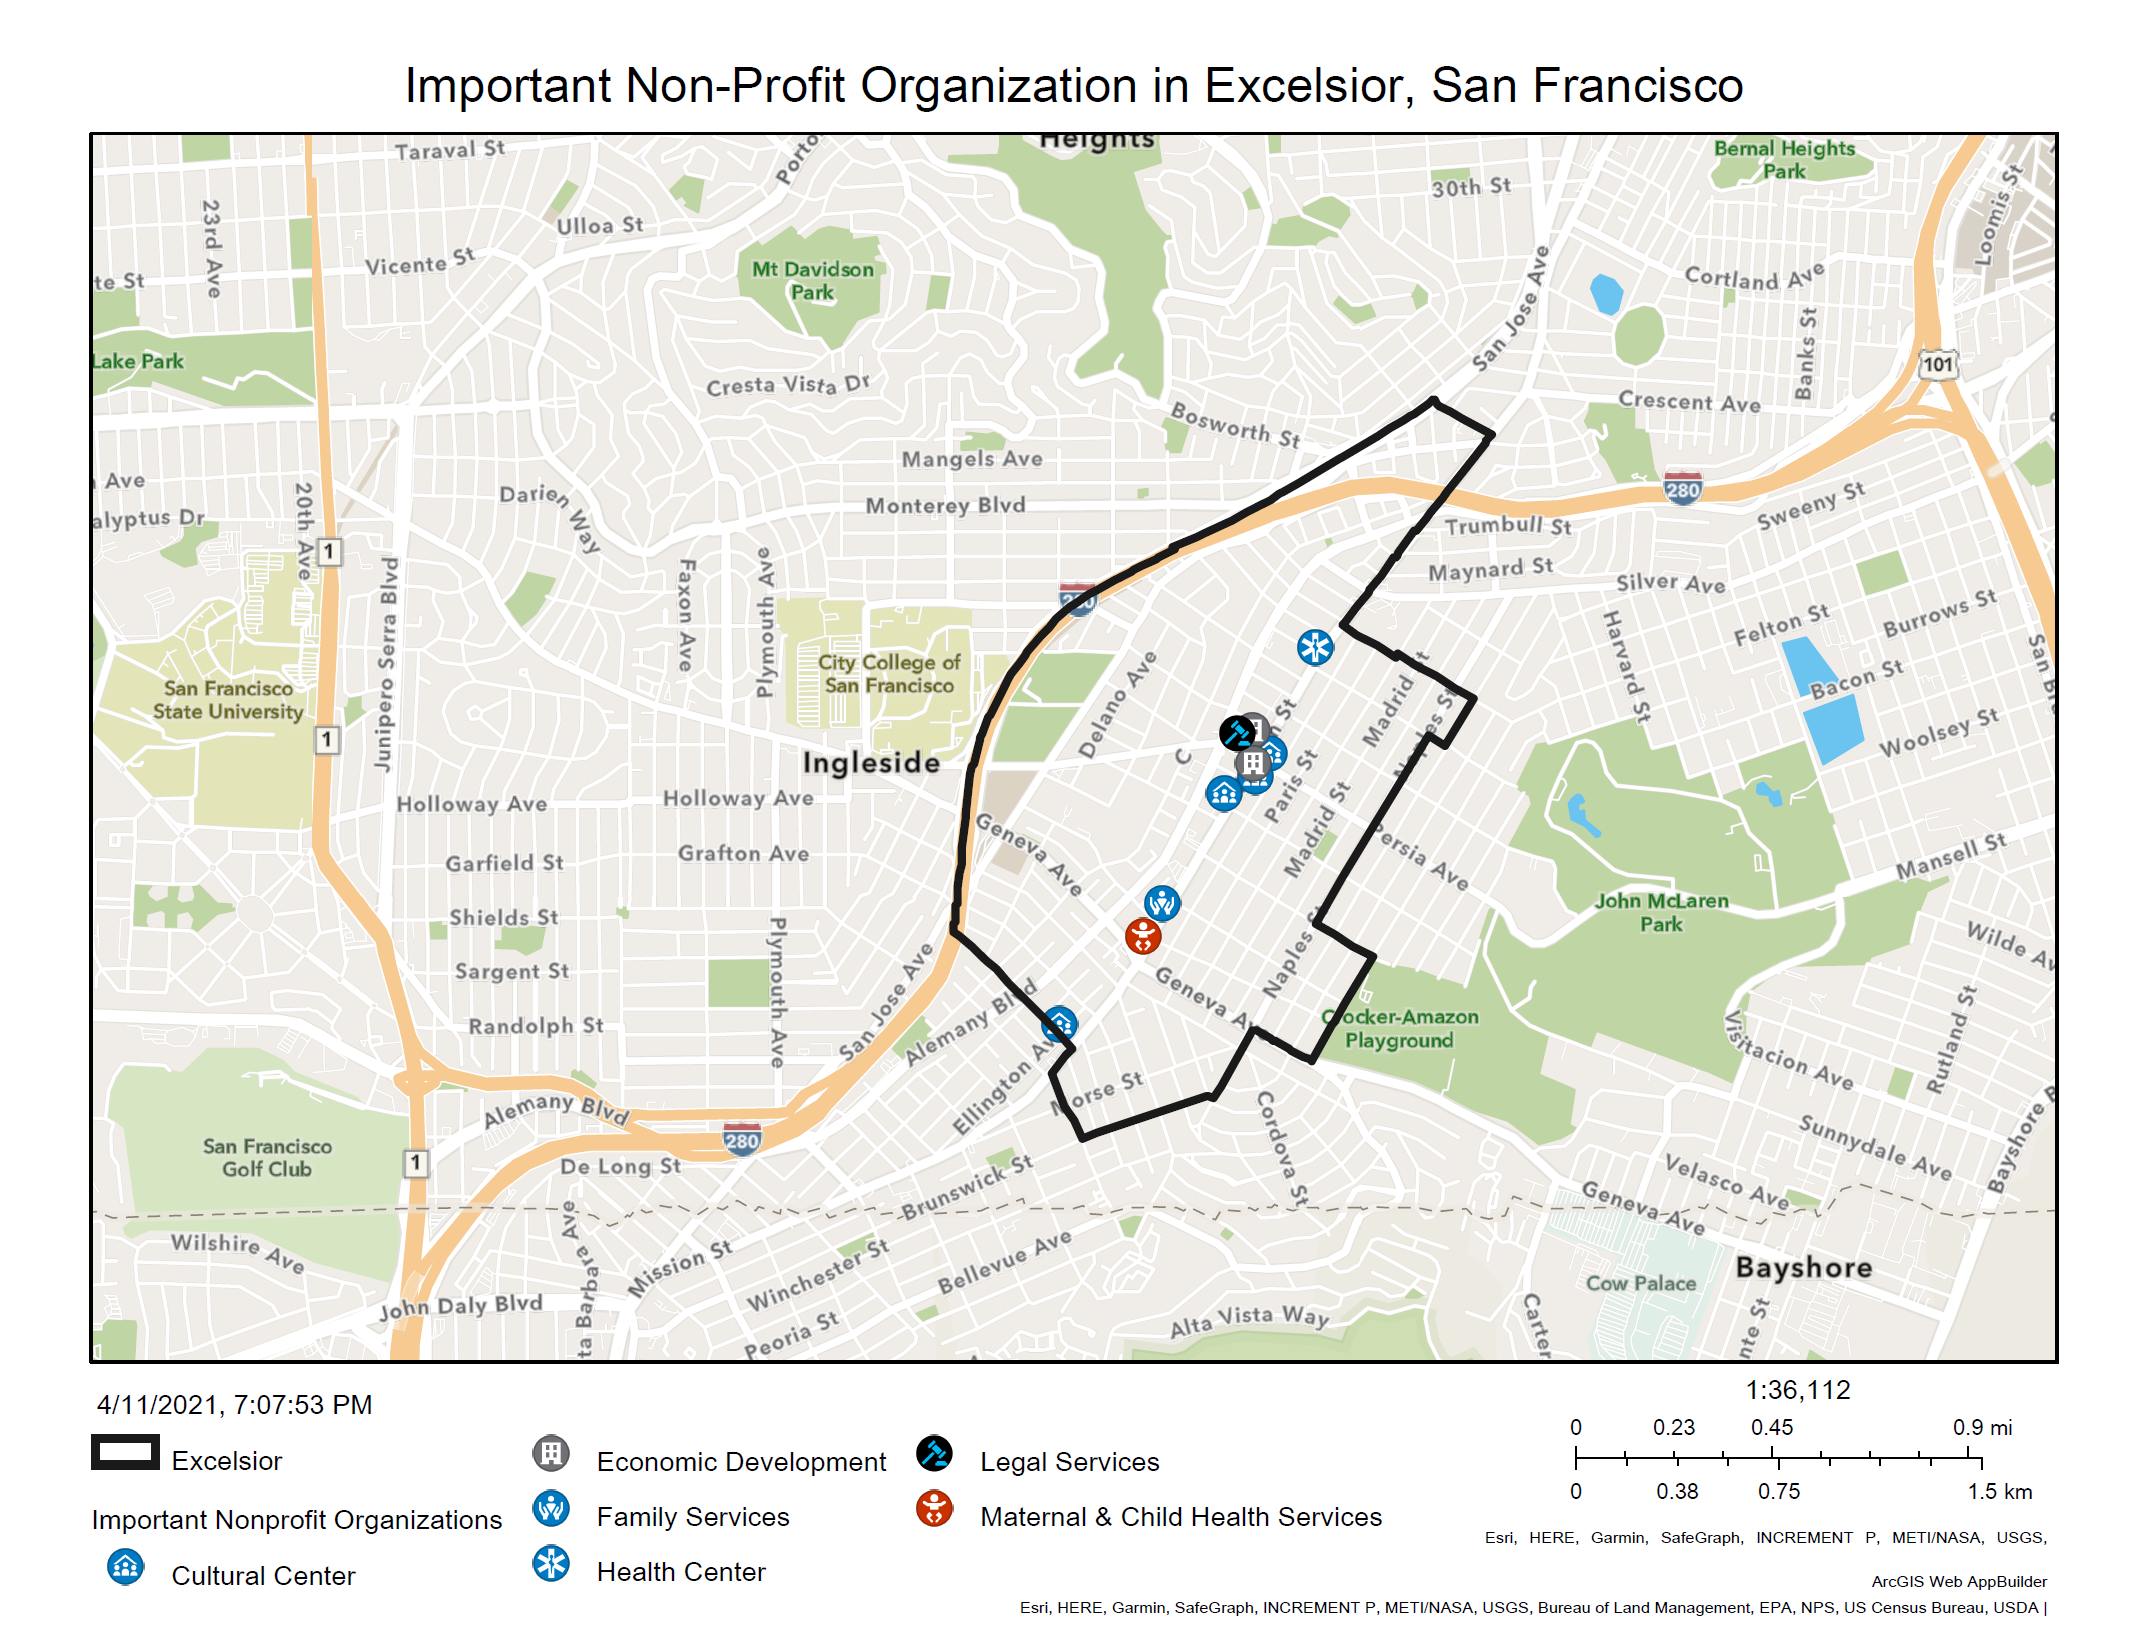
PDF version of map
Don’t worry about the strange legend layout in the PDF or if the layout did not zoom in on the extent of your neighborhood as much as the web-map did. The webmap is saved and is what will ultimately be part of your Story Map.
You have now completed your first web-map! Way to go! In the next assignment, you’ll build on these skills with a larger dataset that contains incidents of crime in the city where your neighborhood is located.