3 Intro to ArcGIS Online
We are now at a point in the course where we get to start mapping. Hurrah! The goal of this tutorial is to introduce ArcGIS Online (AGOL), which we will use for all of the assignments that have a mapping component to them. AGOL is a web-based alternative to desktop GIS software, so you will not need to install any software on your personal computer. In this introductory tutorial, we will focus upon the fundamental concepts needed to begin using the AGOL interface for exploring and analyzing spatial data.
3.1 What is GIS?
GIS stands for Geographic Information Systems. Most people think of GIS as a mapping software because maps are the most familiar way of visualizing spatial relationships. However, GIS is more than maps. The maps are just the geographic containers for information about the physical and social world.
At its core, GIS is a series of databases that allow users to create, manipulate, and analyze data that has been geographically referenced to the Earth’s surface. Think of the “database side” of GIS as multiple spreadsheets containing rows filled with information about the social or physical world (e.g., demographics, crime incidents, weather patterns) that you can organize and categorize, but then also assign specific spatial locations. Once the data are organized in the database, GIS becomes a visualization tool that allows you to view relationships on a map and analyze with spatial methods.
Although the visualization side of GIS is the most important for this class, I bring up the database side because it is relevant for importing data into AGOL. In order for AGOL to properly plot the data we have collected on a map, we will need to make sure that it is formatted in a manner that the database is familiar with. We will carefully walk through the formatting details in the next few chapters. First, let’s cover accessing AGOL and the layout of the interface.
3.2 Logging In
To log into AGOL:
- Go to https://stanford.maps.arcgis.com and click on the Sign In tab at the top right.
- Click on the Enterprise Login button.
- Click on the Stanford University button to launch SSO.
- Continue logging in using the Stanford SSO log-in and authentication.
You will be redirected back to Stanford Geospatial Center’s AGOL Home page, which is shown below. You should now see your username at the top right corner of the page.
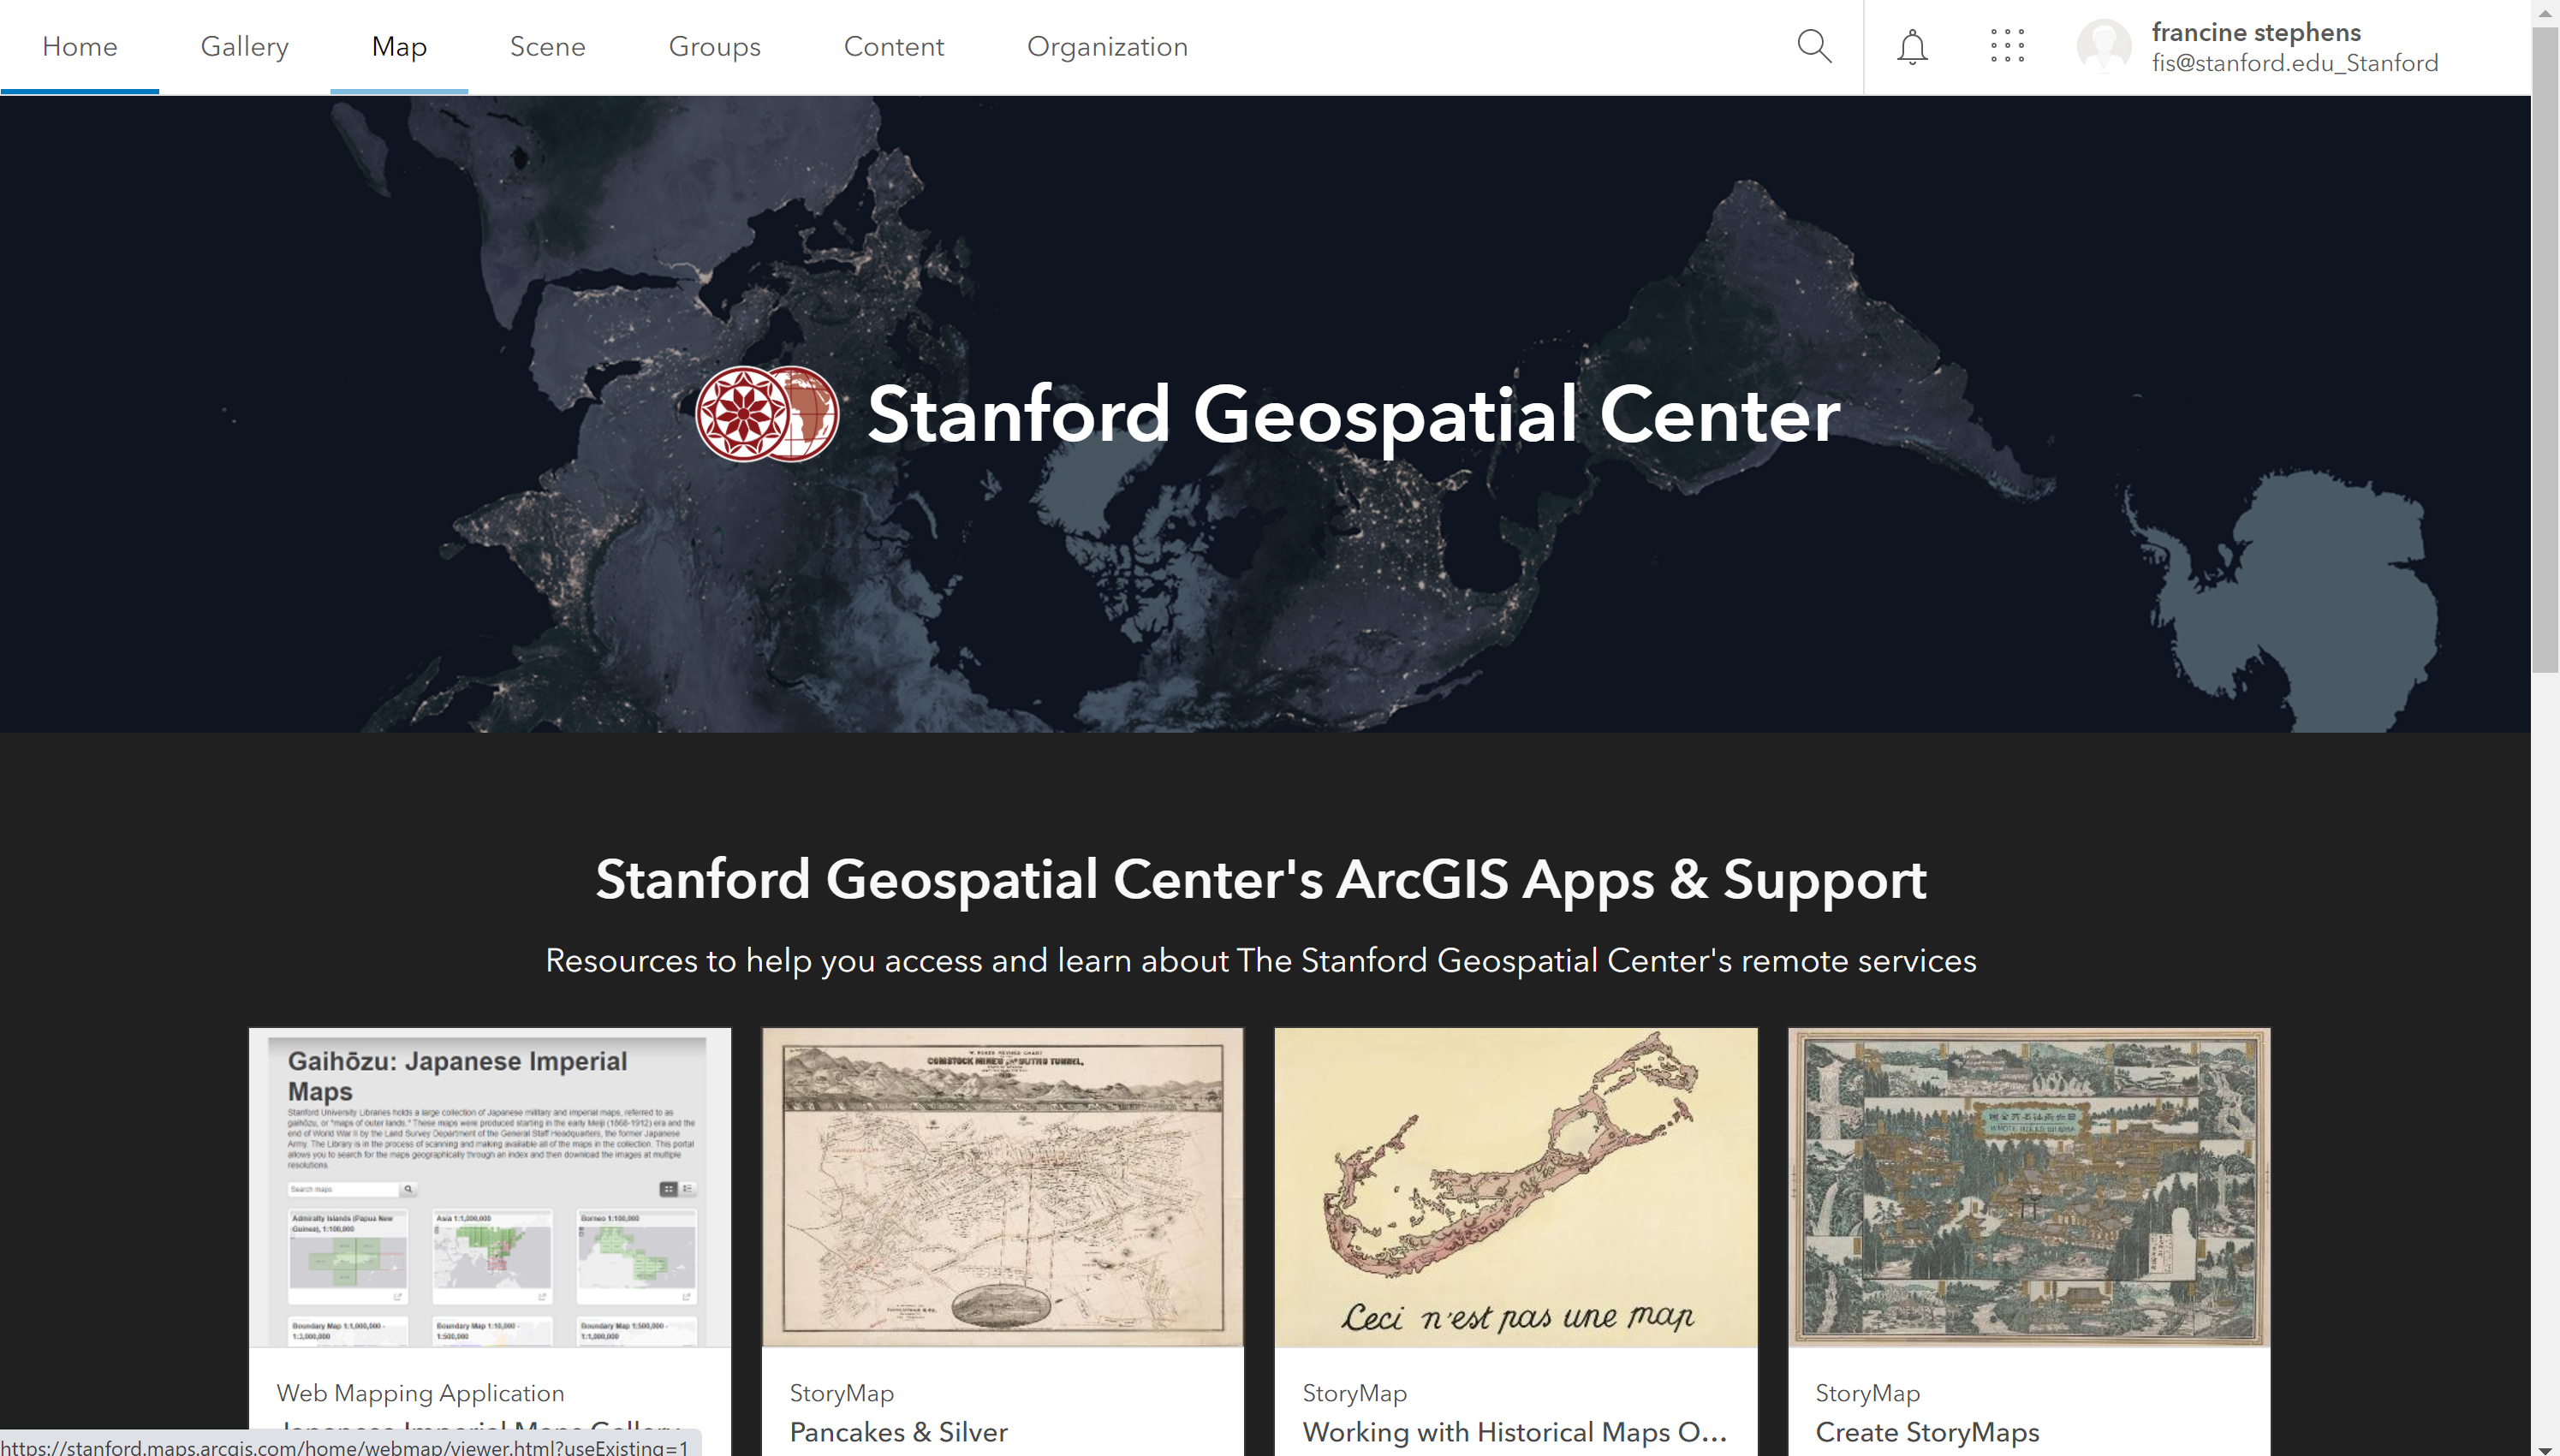
AGOL Home Page
3.3 The Interface
Across the top of the AGOL Home page, you will see a Tab Bar with tabs for Home, Gallery, Map, Scene, Groups, Content, and Organization.
Below the Tab Bar is a gallery featuring many GIS tutorials and resources created by Stanford Geospatial Center staff. Some of these tutorials are linked to the Resources page of this web-book for you to view at your own leisure. In addition to providing good introductory GIS lessons, these tutorials were created using StoryMaps, so viewing them would provide you with an example of what a StoryMap looks and feels like.
If you click on the Map tab on the Tab Bar you will be taken you a New map in the Mapviewer. The Mapviewer is where we will be creating our maps. Go ahead and click on the Map tab, so that we can walk through the functions in the Mapviewer.
3.3.1 Components of the Mapviewer
The Mapviewer has four main components, which are indicated with speech bubbles in the image below.
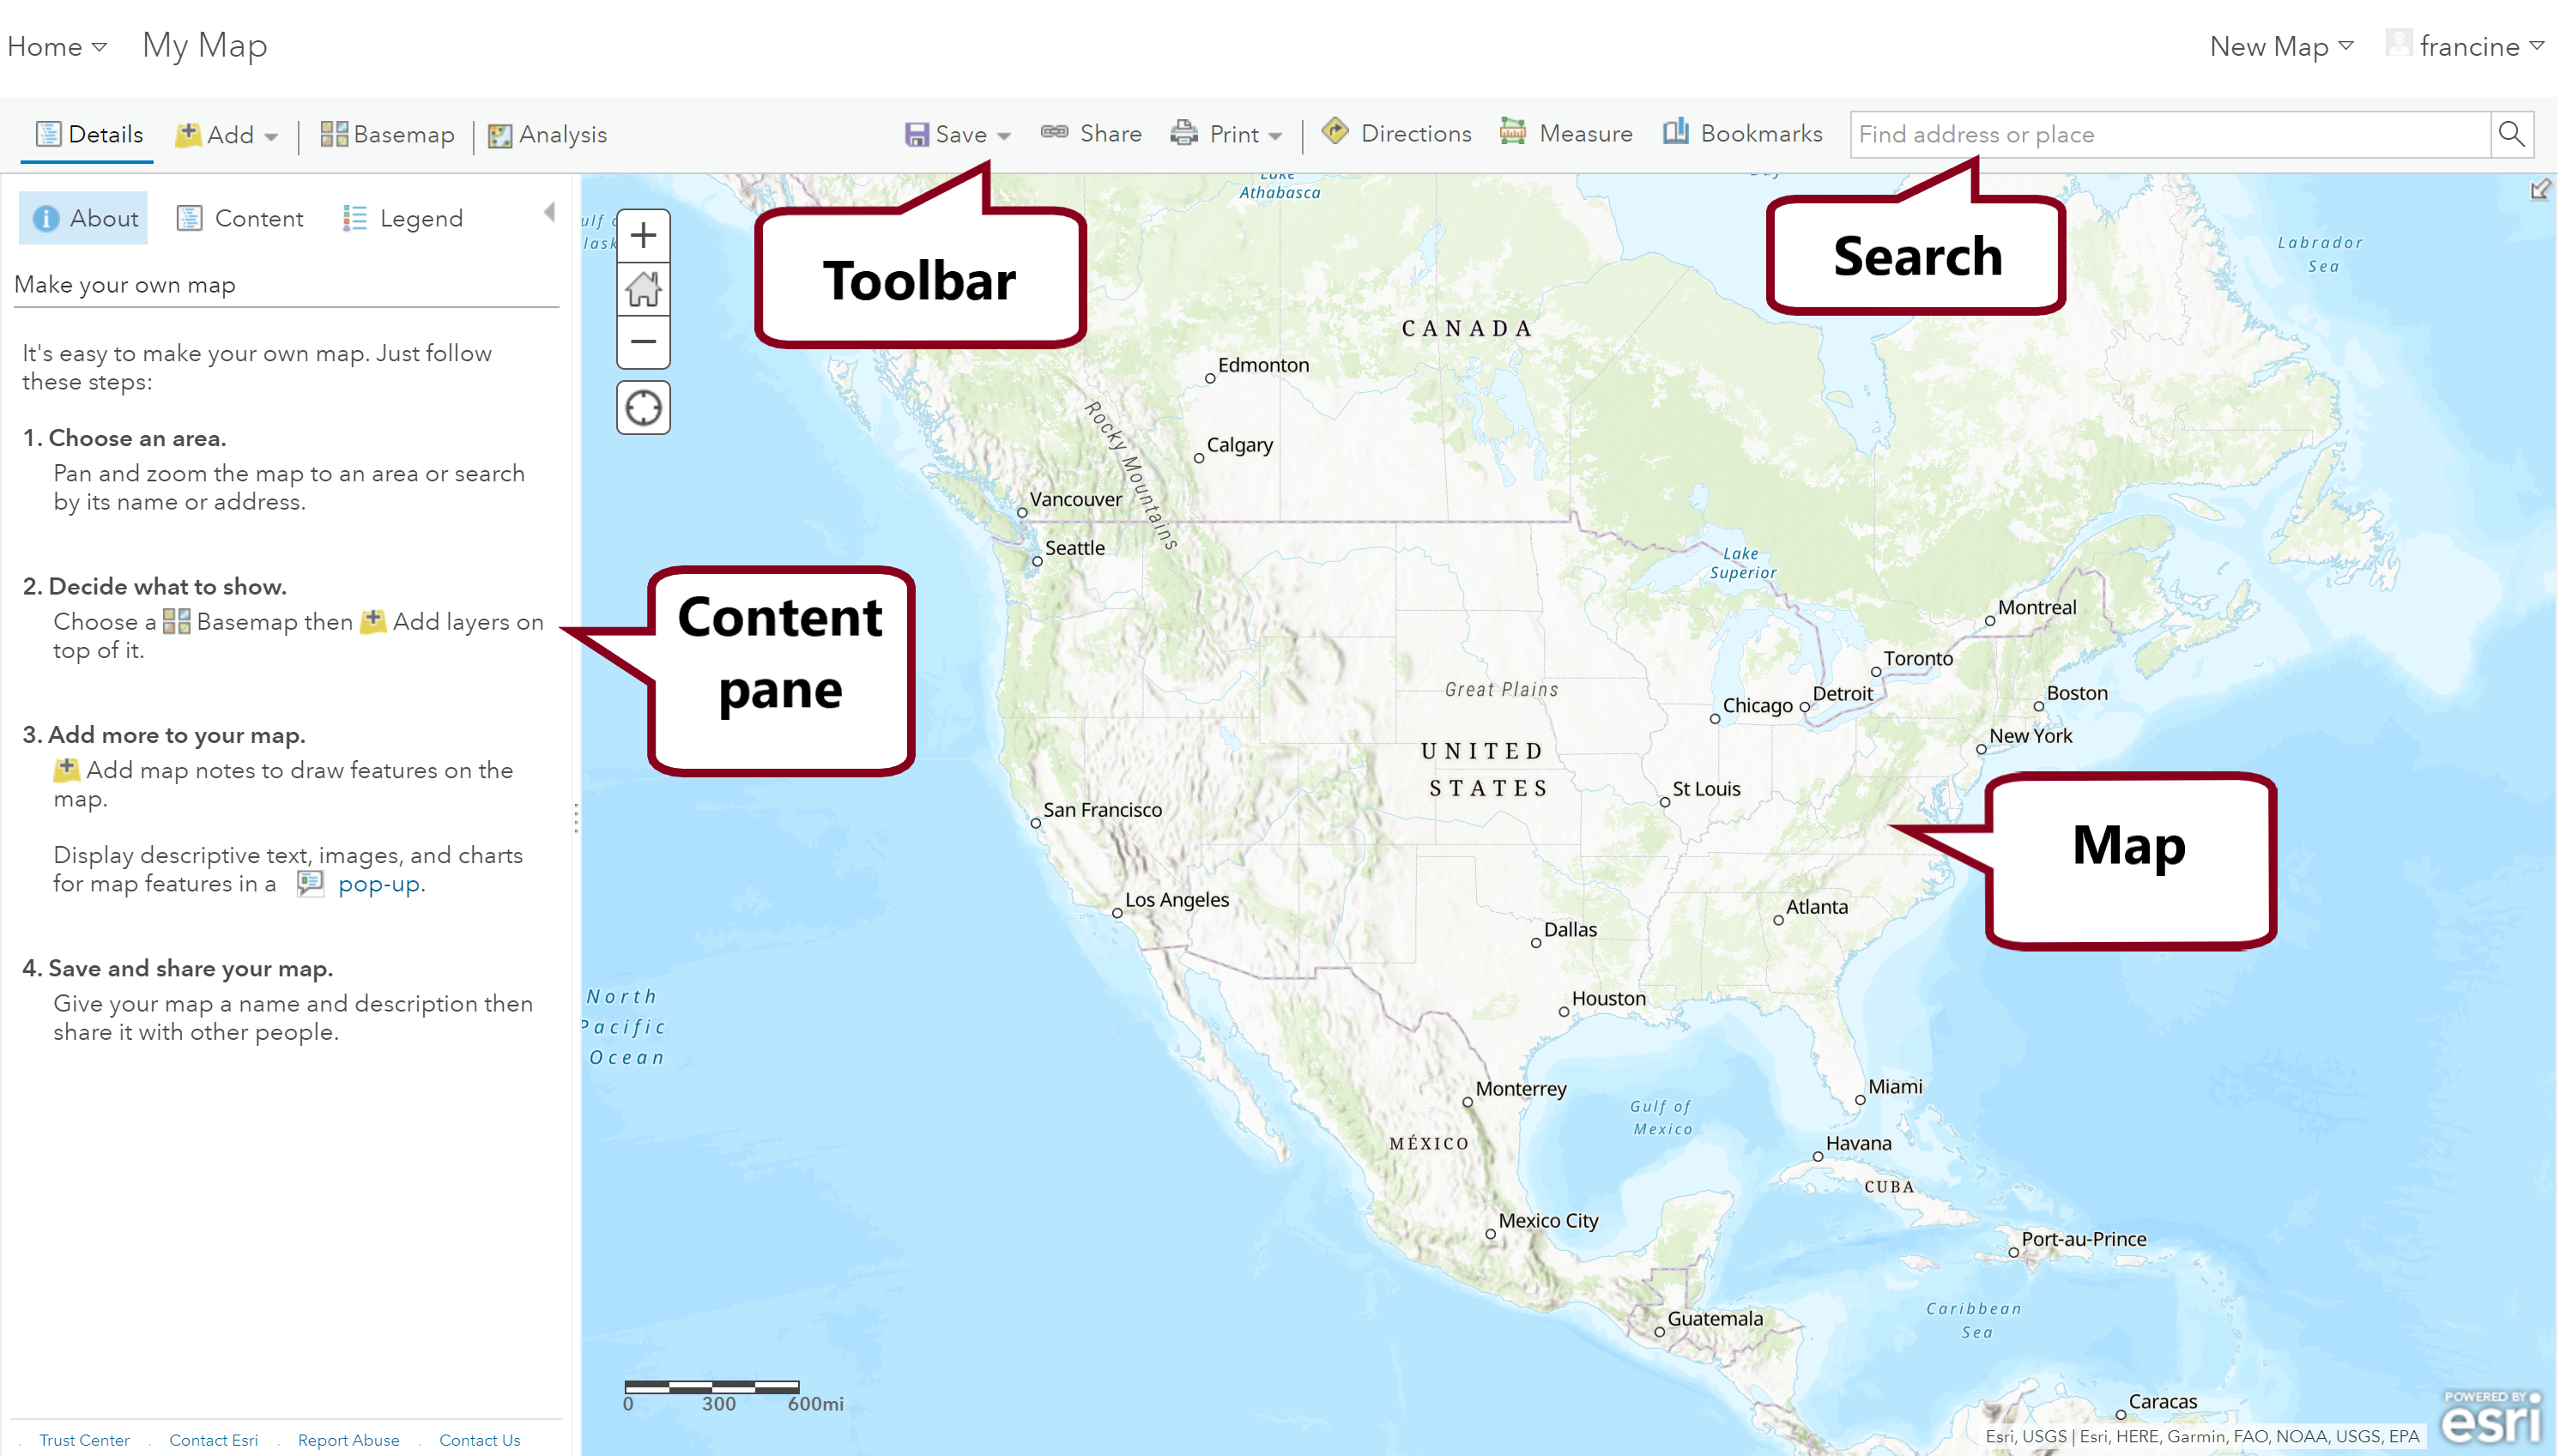
Main components of the Mapviewer
The Map takes up most real-estate on the page. Currently, it just contains a basemap, but as you start to add data, other features will appear. The AGOL Map works like most web-based interactive maps, with zooming and panning done using a mouse, or scroll wheel and arrow keys. You can also click on the plus and minus buttons on the top left corner of the map.
To the left of the Map is the Content Pane, which will hold your map layers and show the symbology of the layers as a legend. Layers will populate in this pane once we start to add data.
Above the Content Pane and Map, shaded in gray are the Toolbar and Search functions. The Toolbar contains the functions you will need to import data layers, style your map, and analyze spatial data. These functions are summarized below from the left to the right side of the t.
3.3.2 The Toolbar
- Details>Content - Clicking on Details hides or shows the Content pane. The Content pane holds the layers you add to your Map. You can interact with those layers by hovering over the layer name to see the tools available.
- Add - This button gives you multiple options for importing layers of data to your map. You can import from your computer, the web, or from existing AGOL content. We will demonstrate these different import options in subsequent chapters.
- Basemap - The Basemap option offers a number of global basemap options, including imagery, topography, oceans, and other styled basemaps.
- Analysis - The Analysis button provides you with multiple geoprocessing tools to analyze your data, including overlay, proximity, network and summary analysis. Some of these tools will be introduced in subsequent chapters.
- Save - This button allows you to save a new map to your content and save any updates you make to your map.
- Share - Here, you will find several options for sharing your maps with others.
- Print - This option creates a printable html version of your map. Use your browser’s print dialog for printing.
- Directions - This option is provides walking and driving times, distances and directions.
- Measure - Measure distances and areas of features on your map.
- Bookmarks - Here, you can save locations in your map. These bookmarks are not going to be particularly useful for your web-map, but may be useful when we start working on the StoryMap.
- Search - You can type the name of a location or a physical street address in the search bar and the map will zoom to the location.
3.4 Explore Basemaps
Let’s start getting acclimated to AGOL by changing the basemap. ArcGIS Online provides multiple basemap options. The basemap provides geographic context for the data layers that you will bring into AGOL.
Start by zooming into an area of interest. In the GIF below, you will see that I typed San Francisco in the Search bar and zoomed into the city. Then, click on the Basemap button at on the Toolbar. You will see a list of basemap options appear. Select one of the provided basemap layers and watch the new basemap appear on your map. You should also notice that the Contents pane has updated. It should now show the name of the new basemap you selected as a layer.
Change the basemap
Change the basemap a few times to explore the available basemaps. Then, click on the New Map Tab at the top of the page, to switch to a new map view. The New Map Tab generates a new map frame and basemap for you to start making a new map document.
3.5 Find our Class Group
Our class has a group page on AGOL. The group is called The Social Life of Neighborhoods. We will use the group page as a repository for data layers that Francine will curate for you. For example, your census tract neighborhood boundaries will be stored here. If your city does not provide crime data that in an exportable format, Francine will scrape the police department’s crime web map and store the scraped map layer on the group page for you to add to your map. The next few chapters will review how to access the data layers from our group page.
Before you proceed to the next chapter and the Assignment #3 mapping exercise, you need to make sure that you have access to the group page. If you had used AGOL in the past, your account was located and added to the group. If you are logging into AGOL for the first time, you can find the group and request access to join. The GIF below shows how you can navigate to the Groups Tab on the Tab bar from the Home page. Be sure to select My Organization’s Groups on the Groups landing page. In the Search Bar type in the group name, and select it from the list. You should then see an option for requesting membership. Francine will add you after you put in your request.
Find the Social Life of Neighborhoods Group
Once you have access to the group, continue on to the next chapter to learn how to add new data layers to the basemap.