Module 1: Spatial Epidemiology: Methods and Applications
Additional Resources
Wakefield, J. (2007). Disease Mapping and Spatial Regression Models. John Wiley & Sons.
Lawson, A. B. (2018). Bayesian Disease Mapping: Hierarchical Modeling in Spatial Epidemiology (3rd ed.). Chapman and Hall/CRC.
What is Spatial Epidemiology and Why It Matters
Most adventures begin with: “In my possession, I have a map…”
Spatial Epidemiology: The study of the geographic distribution of health/mortality outcomes and their relationships with environmental, demographic, and behavioral factors.
Place: a surrogate for exposures present at that location, e.g., environmental exposures in water/air/soil, or lifestyle characteristics.
Time: which may be measured on different scales (age/period/cohort) is also a surrogate for “aging” processes.
An obvious but important point: Units are not uniformly distributed in space, and so we need information on background spatial distribution.
Health outcomes often vary significantly across different geographic areas due to environmental exposure, access to healthcare, socio-economic distributions, etc.
Spatial epidemiology provides critical insights to policymakers, allowing for targeted interventions, more efficient resource allocation, and better understanding of impactful factors on health.
Short version of the beginnings of spatial epidemiology
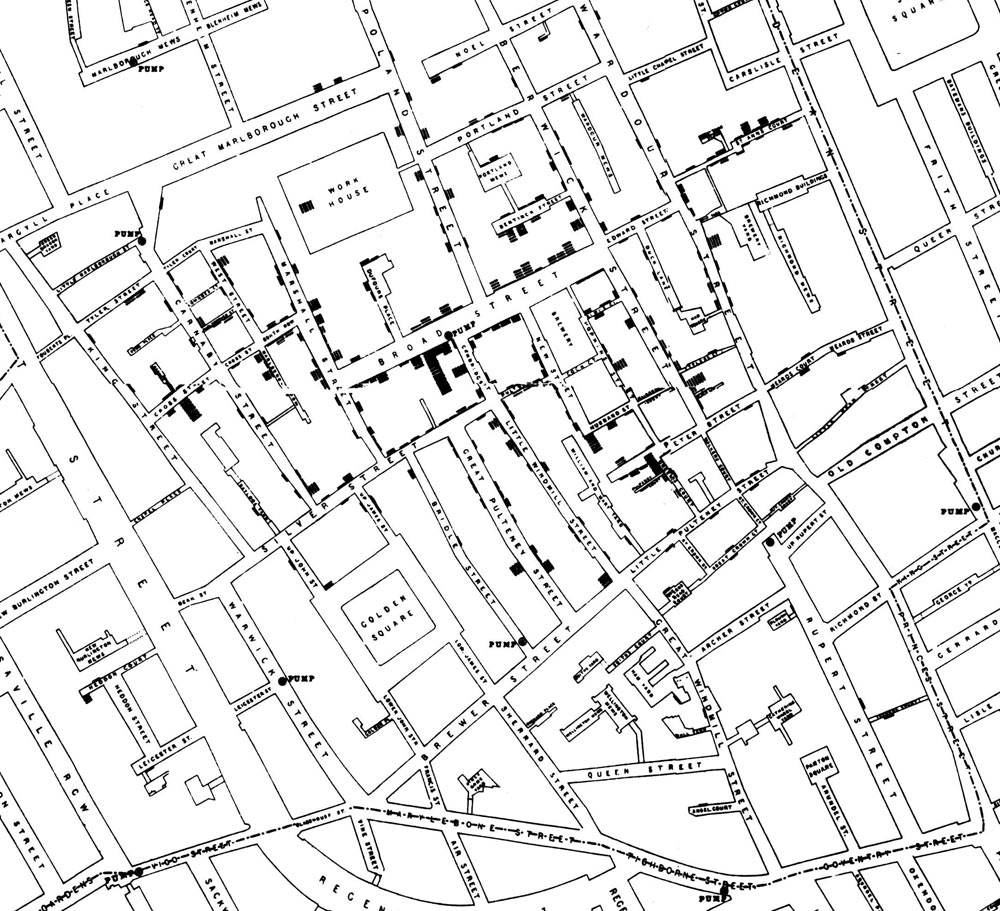
- John Snow 154
- “Londoners were dropping like flies from cholera until Dr. Snow figured out that the bacteria were carried by water. The water pump he turned off, thereby saving countless lives, was near the site of this pub.”
Tobler’s First Law of Geography:
Near things tend to be more alike (e.g. correlated although not necessarily causally linked) than distant things (on average), implying a kind of dependence or correlation among local units that might not be evident overall.
In spatial epi, we are interested in
whether entities that are geographically or socially more connected share health-relevant experiences.
The challenge for the spatial epidemiologist is twofold:
1. Conceptualizing the spatial scale and extent at which a health-relevant process of interest occurs
2. Translating that conceptual idea to an explicit definition of neighbors, and therefore spatial weights
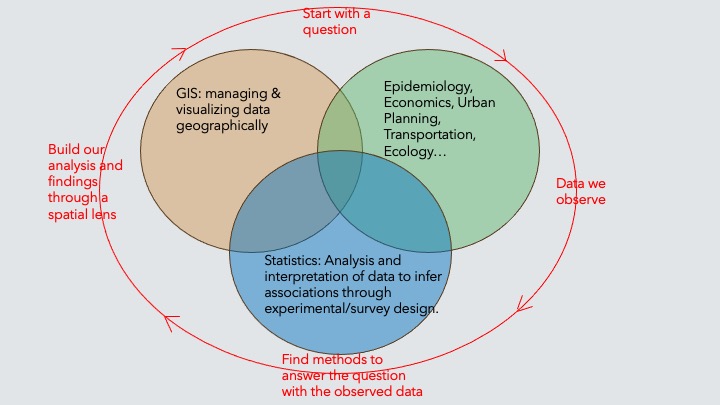
The intersection of space and public health
Disease Mapping & Surveillance: Identifies geographic patterns of disease outbreaks and hotspots for timely intervention.
Environmental Health: Links environmental exposures (e.g., pollution) to health outcomes via spatial analysis.
Health Disparities: Maps inequalities in health outcomes and access to care, guiding resource allocation.
Access to Healthcare: Analyzes geographic barriers to healthcare services, especially in underserved areas.
Infectious Disease Spread: Tracks spatial transmission dynamics influenced by population movement and environmental factors.
Public Health Interventions: Targets localized areas for campaigns (vaccination, education) to improve health outcomes.
Climate Change & Health: Assesses spatial impacts of climate change on health, including vector-borne diseases.
These points emphasize key intersections where spatial epidemiology informs public health actions and policies.
Types of spatial analysis
All investigations are spatial! But often the study area is small and/or there is abundant individual information, and so spatial location is not acting as a surrogate for risk factors.
Geographical correlation studies: Geographical variations in exposure to environmental or lifestyle factors and their impact on health outcomes.
Disease mapping: Summarizes spatial and spatio-temporal variation in risk across areas. Can be used for descriptive purposes or can assess predictive factors of health.
Source studies: Localized increases in risk due a source point.
Clustering detection: Identification of geographic clusters of increased risk, i.e., infectious disease mapping based on points or cases.
Understanding Spatial Data
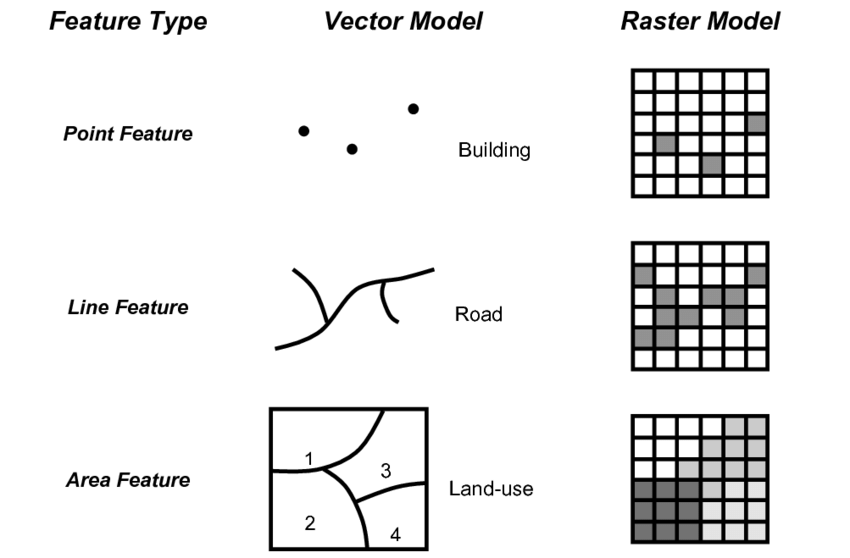
Types of Spatial Data
Geostatistical (Point) data in which exact residential locations exist for the points, and spatial regression and/or prediction is of interest.
Area data in which aggregation (typically over administrative units) has been carried out. These data are ecological in nature in that they are collected across groups/areas.
Line data capturing paths, i.e., roads or lines from two different points.
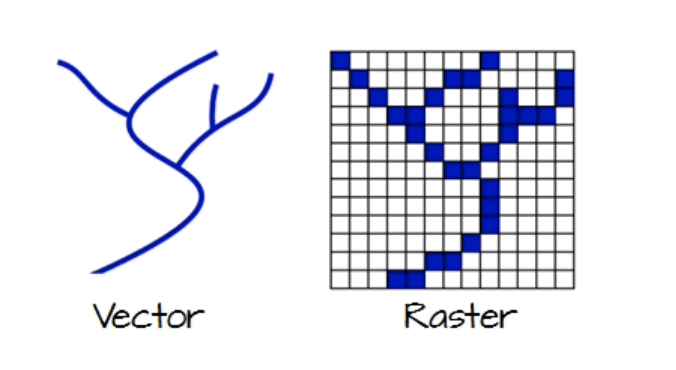
Raster data: A grid of pixels, often used to represent continuous surfaces like air pollution levels or land cover
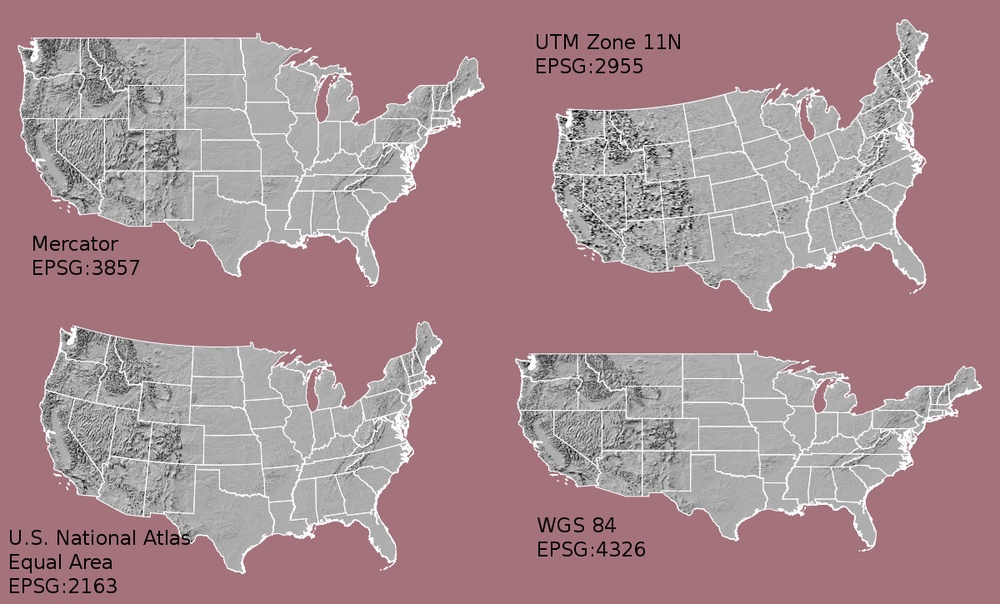
Coordinate Systems & Projections
Spatial data is referenced using coordinate systems, and the choice of projection affects how geographical features are represented on a flat map.
Common systems include: WGS 84: Used for GPS data. UTM (Universal Transverse Mercator): Divides the world into zones for detailed local mapping.
Sources of Spatial Data in Epidemiology
Population registers are the gold standard but counts from the census are those that are typically routinely available.
Census counts should be treated as estimates. Inaccuracies in estimates (i.e., underenumeration) are common.
Vital statistics data (birth, deaths, etc).
Health/Mortality Surveillance statistics from national suveillance systems are registries.
Exposure data: Point data of health events or cases.
Challenges of Spatial Misalignment
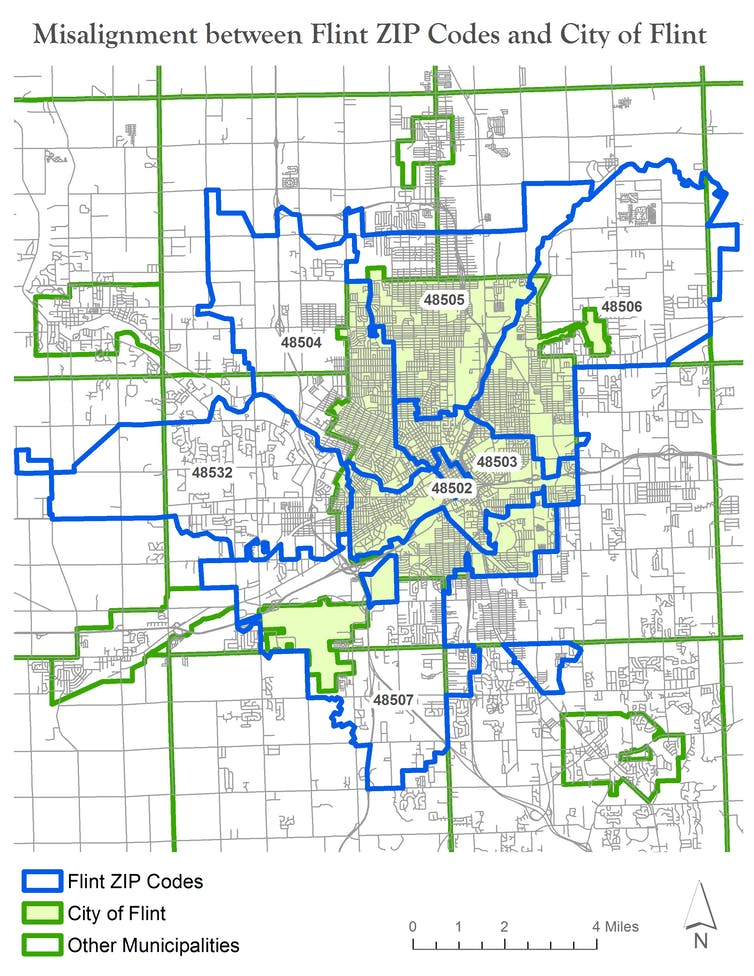
Data Resolution Mismatch: Health data and environmental data may be collected at different spatial scales (e.g., county vs. census tract), complicating analysis.
Inconsistent Geographic Boundaries: Boundaries change over time (e.g., redistricting, zip code redefinitions), making it difficult to compare data across time periods.
Modifiable Areal Unit Problem (MAUP): Results can vary based on the choice of spatial units (e.g., aggregation to larger or smaller regions), leading to bias in analysis.
Data Aggregation Issues: Aggregating fine-scale data into larger units can obscure localized patterns and lead to loss of critical detail.
Spatial Interpolation Challenges: Estimating data for areas without direct observations can introduce uncertainty, especially if spatial relationships are weak.
Incompatibility Across Datasets: Different data sources may use varying coordinate systems, projections, or units, complicating their integration for analysis.
Boundary Effects: Areas near the edges of study regions may have data that are incomplete or influenced by neighboring regions outside the study area.
Data Privacy Concerns: Anonymizing spatial data, especially in small-area studies, can distort spatial relationships and lead to misalignment.
Spatial misalignment poses challenges for accurate analysis, requiring careful methodological adjustments to avoid biased or misleading results.
Challenges of Bias (Measurement Error)
Measurement error (or bias) refers to inaccuracies or deviations in data collection, where the recorded or observed values differ from the true or actual values.
- Random Error: Errors that occur unpredictably and affect the measurements in a non-systematic way. Causes variability in data but does not bias the results in any particular direction.
- Systematic Error (Bias): Errors that consistently skew the measurements in a particular direction, either over- or underestimating the true value. Leads to biased results, distorting the findings in a specific way and potentially misleading conclusions.
Racial/Ethnic Misclassification: Occurs when individuals’ racial or ethnic identities are recorded inaccurately in health or demographic data.
Examples: Misclassification of Native American populations as White or Hispanic in health records.
Impact: Leads to underestimation or overestimation of disease rates and health disparities within racial or ethnic groups, skewing public health interventions.
Spatial Misclassification: Occurs when the geographic location of an event or individual is recorded inaccurately, leading to incorrect spatial assignments.
Examples: Assigning a patient’s residence to the wrong geographic area (e.g., wrong zip code).
Impact: Can distort spatial analyses by introducing errors in estimating exposure, risk, or disease prevalence, leading to incorrect conclusions about spatial patterns.
Undercounting: Happens when events or cases are systematically underreported or missed in certain geographic areas, resulting in biased data.
Examples: Undercounting cases of a disease in remote or rural areas with poor access to healthcare.
Impact: Leads to underestimated disease incidence or prevalence in affected areas, potentially masking true public health risks.
Selection Bias: Occurs when the sample of geographic units or individuals included in the study is not representative of the population, introducing bias.
Examples: Focusing only on urban areas while excluding rural regions.
Impact: Distorts spatial patterns and risk assessments by over- or underestimating health outcomes in certain regions.
Addressing these biases requires careful attention to data collection, geographic boundary consistency, and statistical methods that account for spatial relationships.
Ecological Fallacy
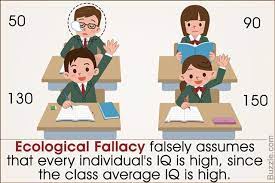
Ecological fallacy is a logical error that occurs when conclusions about individuals are drawn based on the analysis of group-level or aggregated data.
In other words, the ecological fallacy arises when one assumes that relationships observed for groups hold true for individuals within those groups.
Key Points:
Group Data Misinterpretation: It happens when the characteristics of a group (e.g., a neighborhood or a country) are incorrectly attributed to individuals within that group.
Example: If a neighborhood with a high average income also has a high crime rate, concluding that wealthier individuals in the neighborhood are more likely to commit crimes would be an ecological fallacy.
Common in Spatial Epidemiology: Ecological fallacy is especially relevant in spatial studies where data are often aggregated by geographic regions (e.g., counties, census tracts), but individual-level data may tell a different story.
Implications:
Ecological fallacy can lead to misguided policies or interventions by incorrectly targeting or characterizing individuals based on group-level findings. It emphasizes the importance of distinguishing between group-level associations and individual-level behaviors in public health and social research.