About the Book
Statistics is the science of collecting, organizing, analyzing, and interpreting data to make informed decisions. It provides essential tools for understanding variability, modeling uncertainty, and drawing conclusions from real-world phenomena across science, engineering, business, and social studies. Mastery of statistics enables us to extract insights, test hypotheses, and predict outcomes effectively [1], [2].
Overview of the Course
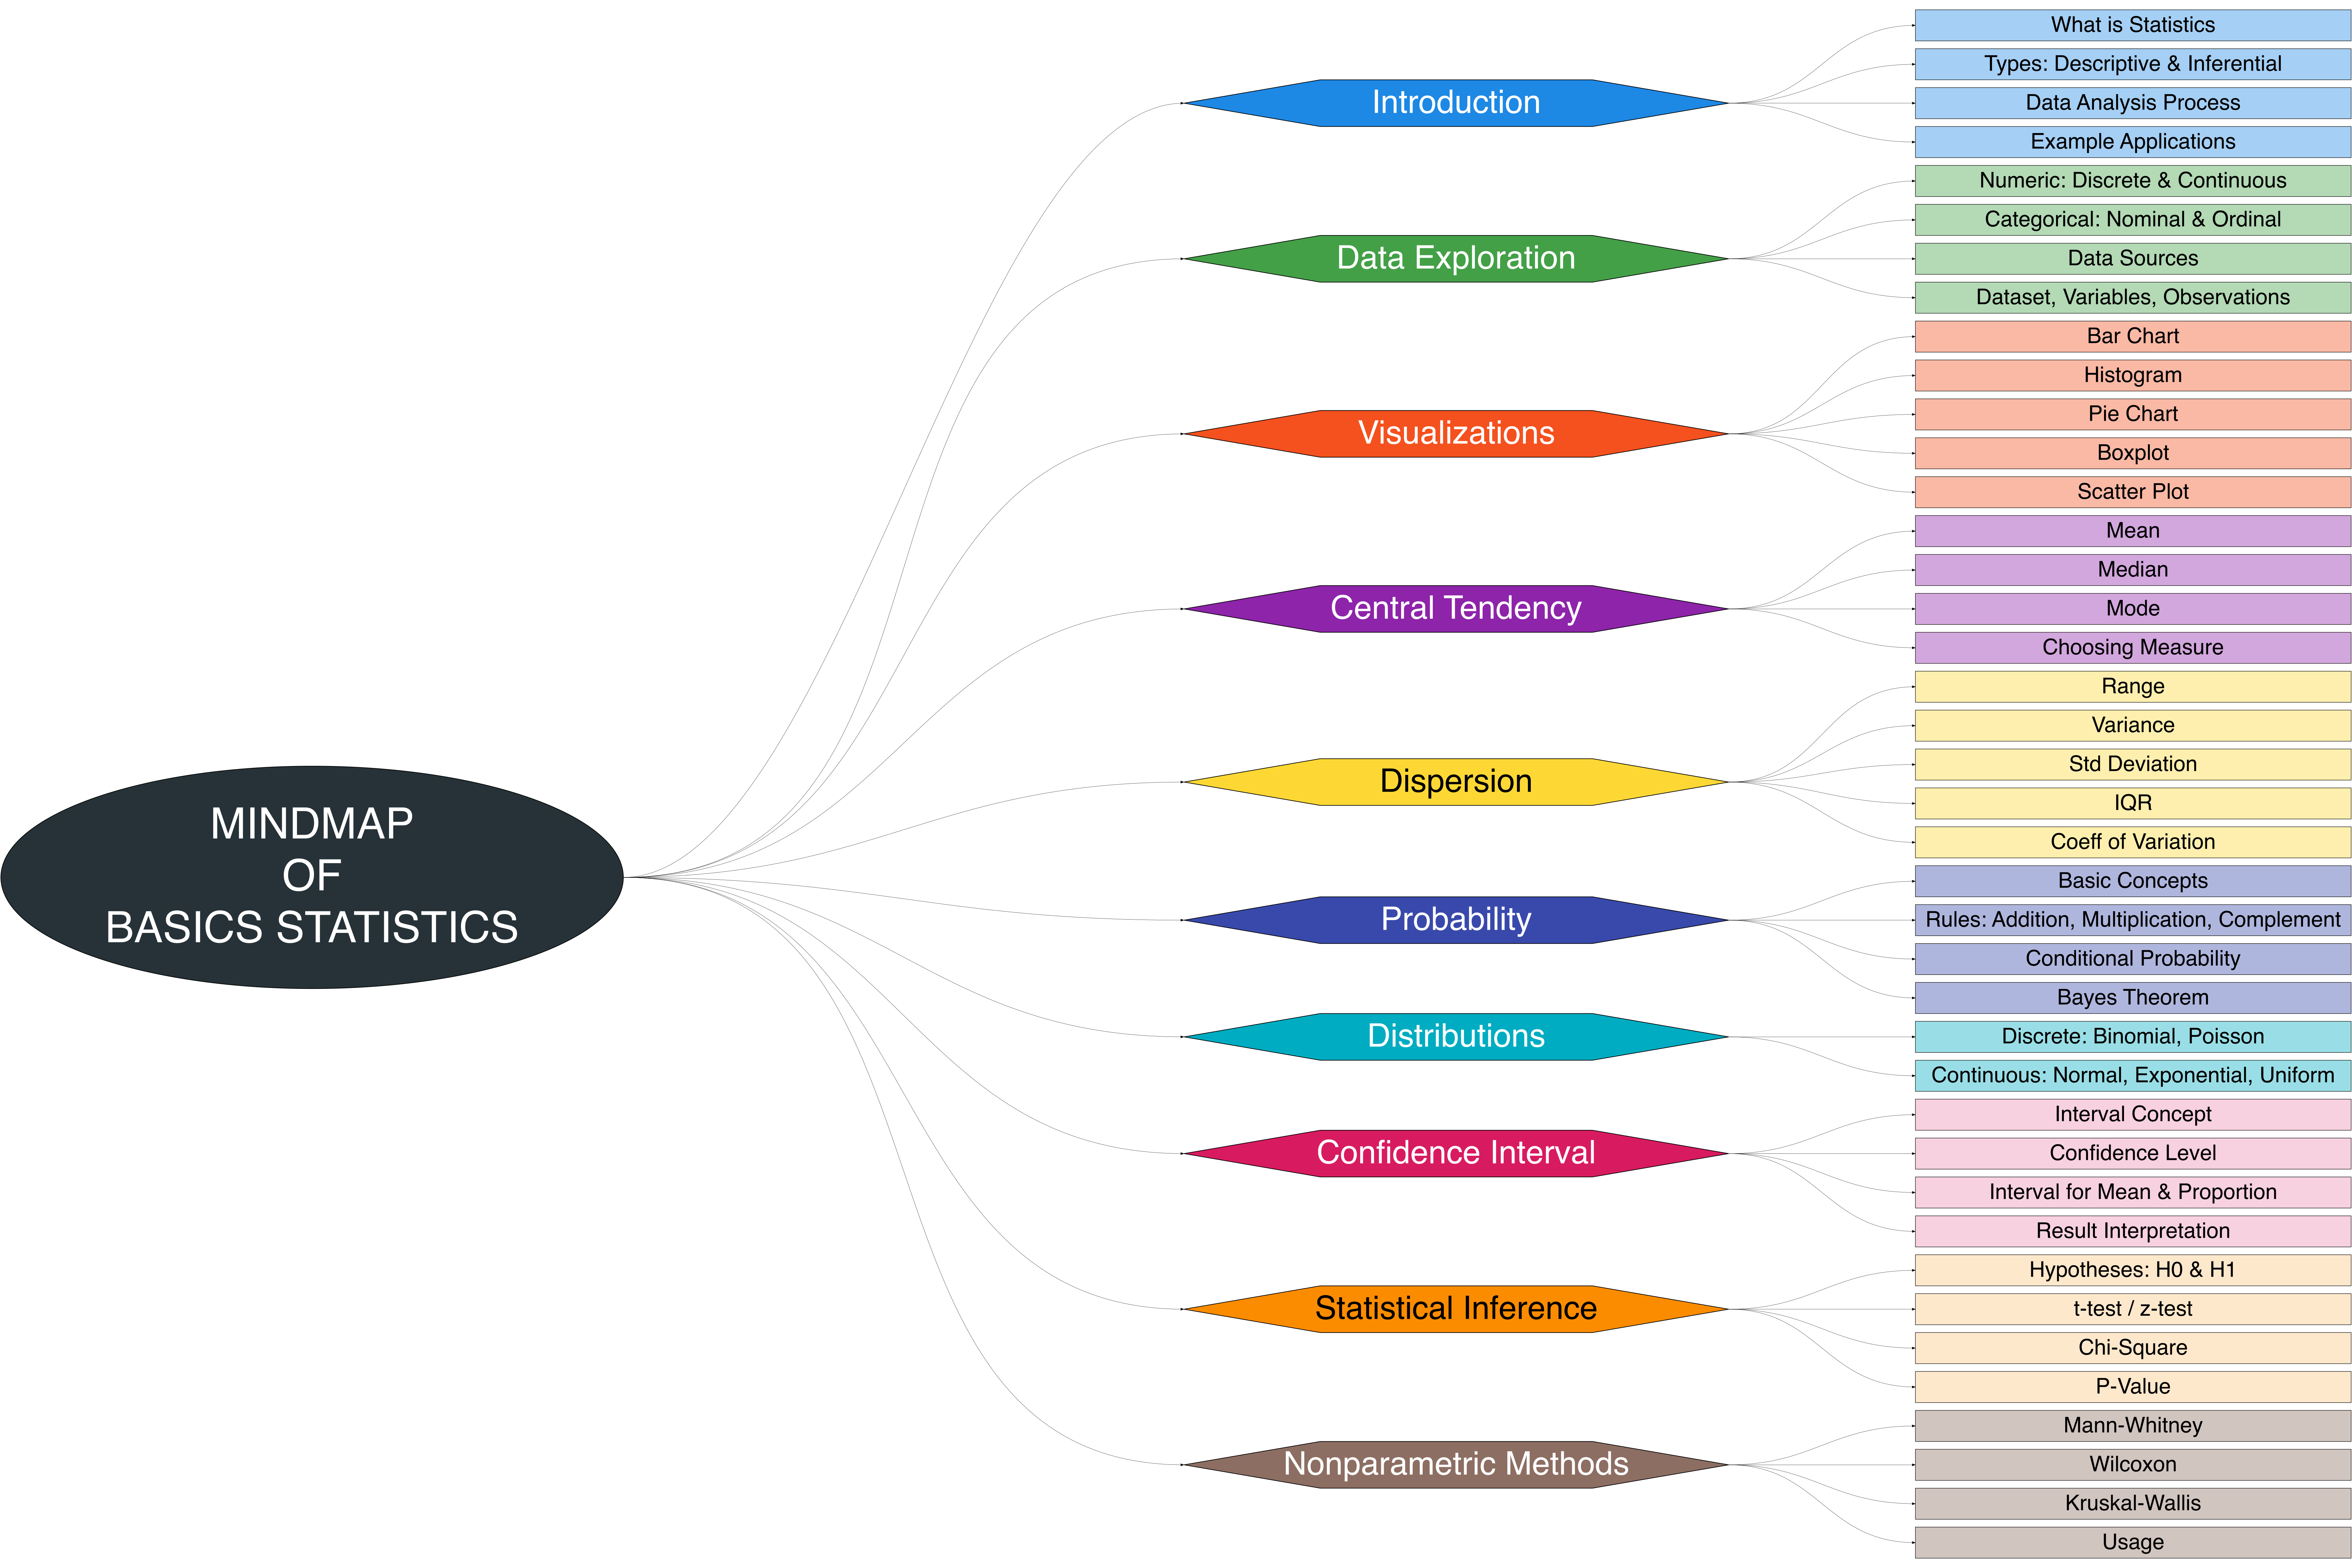
The Figure 1 presents a visual overview of the course, highlighting the structure of key topics and their interconnections. It offers readers a clear guide to navigate the material and understand how concepts link to practical applications and decision-making processes [3].
This book introduces the fundamental building blocks of statistics, from understanding data structures and basic visualizations to exploring probability, distributions, confidence intervals, and nonparametric methods. Each topic is linked to real-world examples, allowing readers to see how statistical techniques support analysis, interpretation, and problem-solving across diverse domains.
Brief Descriptions
This mind map (Figure 1) illustrates the overall structure of a Basic Statistics course, covering topics from introductory concepts to more advanced methods (see Table 1).
| KeyConcept | Description | ExampleApplication |
|---|---|---|
| Introduction | What statistics is, types (descriptive & inferential), and the data analysis process | Business decision-making using data insights |
| Data Exploration | Types of data (numerical, categorical), data sources, datasets, variables, and observations | Collecting employee health records for analysis |
| Visualizations | Visualization techniques: bar chart, histogram, pie chart, boxplot, scatter plot | Visualizing sales data with bar chart or boxplot |
| Central Tendency | Measures of location: mean, median, mode | Comparing average income across groups |
| Dispersion | Measures of variability: range, variance, standard deviation, IQR, coefficient of variation | Analyzing spread of exam scores in a class |
| Probability | Basic concepts, rules (addition, multiplication), conditional probability, Bayes’ theorem | Estimating probability of machine failure |
| Distributions | Discrete (binomial, Poisson) and continuous (normal, exponential, uniform) distributions | Modeling customer arrivals (Poisson) or product lifespan (exponential) |
| Confidence Interval | Intervals, confidence levels, estimation for mean & proportion, interpretation of results | Calculating CI for average mining output |
| Statistical Inference | Hypothesis testing (H0 & H1), t-test, z-test, chi-square, p-values | Testing if two mining methods yield different results |
| Nonparametric Methods | Mann-Whitney, Wilcoxon, Kruskal-Wallis tests, and when to use them | Analyzing survey responses when assumptions of parametric tests are not met |
References
[1]
Moore, D. S., McCabe, G. P., and Craig, B. A., Introduction to the practice of statistics, Macmillan Learning, 2020
[2]
Wackerly, D. D., Mendenhall, R., and Scheaffer, R. L., Mathematical statistics with applications, Cengage Learning, 2014
[3]
Freedman, D., Pisani, R., and Purves, R., Statistics, W. W. Norton & Company, 2007