R for marketing students
1 About this tutorial
In this tutorial, we will explore R as a tool to analyse and visualise data. R is a statistical programming language that has rapidly gained popularity in many scientific fields. The main difference between R and other statistical software like SPSS is that R has no graphical user interface. There are no buttons to click. R is run entirely by typing commands into a text interface. This may seem daunting, but hopefully by the end of this tutorial you will see how R can help you to do better statistical analysis.
So why are we using R and not one of the many other statistical packages like SPSS, SAS, or Microsoft Excel? Some of the most important reasons:
- Unlike other software, R is free and open source, and always will be!
- R is a programming language rather than a graphical interface like SPSS. It carries out analyses or visualizations by running a few lines of code. These lines of code can be saved as scripts for future repetition of the analyses or visualizations. It also makes it very easy to share your work with others, who can then learn from it or correct it if it contains a mistake.
- R has a very active and helpful online community. When you run into a problem, very often a quick Google search is all it takes to find a crowd-sourced solution.
- All leading marketing research companies indicate that they are experimenting with R and that R is the software of the future.
This tutorial focuses on statistical analyses relevant for marketing students. If you want a more extensive but very accessible introduction to R, check out the excellent and free book ‘R for Data Science’. This introductory chapter and the next are based on the ‘Intro to R 1’ found at Coding Club Tutorials, which has many other great R tutorials as well.
This tutorial has been written in RMarkdown, with the help of the amazing bookdown package. Questions? Comments? Suggestions? E-mail me: samuel.franssens@protonmail.com
If you are writing a master’s thesis, feel free to check out my website for some advice.
1.1 Download and install R and RStudio
To provide some extra functionality and to ease the transition a bit, we will use a program called RStudio as a graphical front-end to R.
You can download R from https://cloud.r-project.org/. Select the appropriate link for your operating system and install R on your computer (on Windows, you first need to click on “base”).
Then, download RStudio from https://www.rstudio.com/products/rstudio/download/. Select the installer for the free version and install RStudio (note: you need to have R installed first).
1.2 Getting familiar with RStudio
1.2.1 Console vs. script
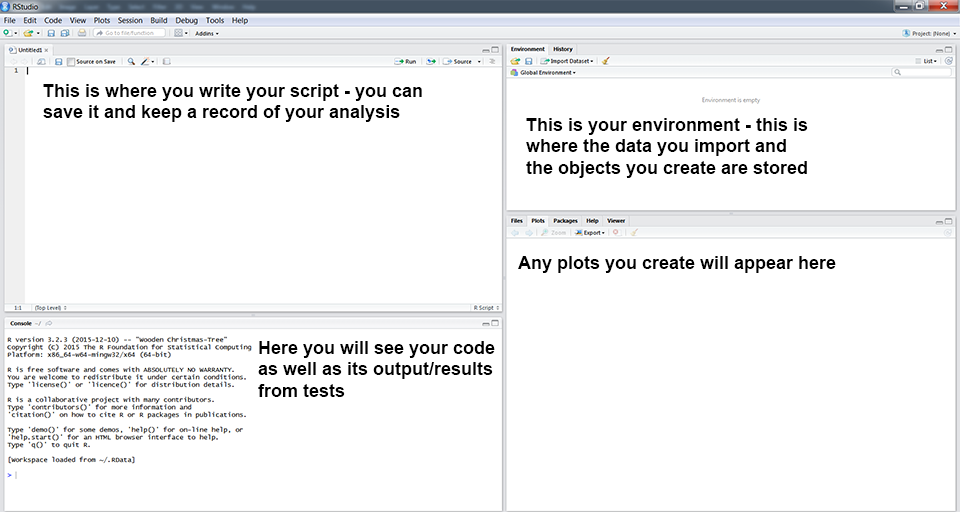
When you open RStudio, you will see a window like the one above. You can type code directly into the console (the bottom left window) — just enter your code after the prompt (>) and press enter at the end of the line to run the code. You can also write your code in the script file (the top left window). If you don’t see a window with a script file, open one by clicking on File, New file, R Script. To run a line of code from your script, press Ctrl+R or Ctrl+Enter on Windows and Cmd+Enter on a Mac or use the ‘Run’ button in the top right corner of the script window.
Code that you enter directly into the console will not be saved by R. Code that you enter into a script file can be saved as a reproducible record of your analysis. If you are working in the console and want to edit or re-run a previous line of code, you can press the up arrow. If you are working in a script, remember to click Save often (File, Save), so that you actually save your script!
It’s best to work in script files. It’s also strongly recommended to save your script file in a folder that is automatically backed up by file-sharing software that offers ‘previous versions’ functionality (Dropbox is probably the most famous one; here are some alternatives). This will give you the option to restore previously saved versions of your files whenever you save something by mistake. Like any piece of writing, scripts benefit from structure and clarity — Coding Club’s Coding Etiquette offers more advice on this.
1.2.3 Packages
The next few lines of code will usually load the packages you will be using in your analysis or visualization. R automatically loads a number of functions to do basic operations, but packages provide extra functionality. They typically consist of a number of functions that can handle specific tasks. For example, a package could provide functions to do cluster analyses or to make biplots. To install a package, type install.packages("package-name") (and press enter when working in the console or press Ctrl+Enter, Ctrl+R, Cmd+Enter or the ‘Run’ button when working in a script). You only need to install packages once, afterwards you just need to load them using library(package-name). Here, we will be using the popular tidyverse package that provides many useful and intuitive functions (https://www.tidyverse.org/). The tidyverse package is actually a collection of other packages, so while installing or loading it, you will see that a number of packages get installed or loaded. Install and load the tidyverse package by running the following lines of code:
install.packages("tidyverse") # install the tidyverse package
library(tidyverse) # load the tidyverse package
Note that there are quotation marks when installing a package, but not when loading it.
Installing a package will typically produce a lot of output in the console. You can check whether you’ve successfully installed a package by loading the package. If you try to load a package that has not been successfully installed, you’ll get the following error:
library(marketing) # I'm trying to load the non-existent package 'marketing'## Error in library(marketing): there is no package called 'marketing'In that case, try re-installing the package.
When you try to use a function from a certain package that has not been loaded yet, you may get the following error:
# agnes is a function from the cluster package to do cluster analysis.
agnes(dist(data), metric = "euclidean", method = "ward")
## Error in agnes(dist(data), metric = "euclidean", method = "ward"): could not find function "agnes"R will tell us it cannot find the requested function (in this case agnes, a function from the cluster package for cluster analyses). Usually this is because you have not yet loaded (or installed) the package to which the function belongs.
After installing and loading the tidyverse package, you will be able to use the functions that are included in the tidyverse package. Because you will use the tidyverse package so often, it’s best to always load it at the beginning of your script.
1.2.2 Comments
When writing a script, it’s very important to add comments to describe what you’re doing and why. You can do this by inserting a
#in front of a line of text. Begin your script by recording who is writing the script, the date, and the main goal — in the introductory chapter, we will learn about Airbnb accommodations in Belgium. Here’s an example: