Chapter 7 Visualizations with Leaflet I
7.1 Plot densitiy of rides
Let’s have a look at the distribution per hour of the day of the number of aggregated trips :
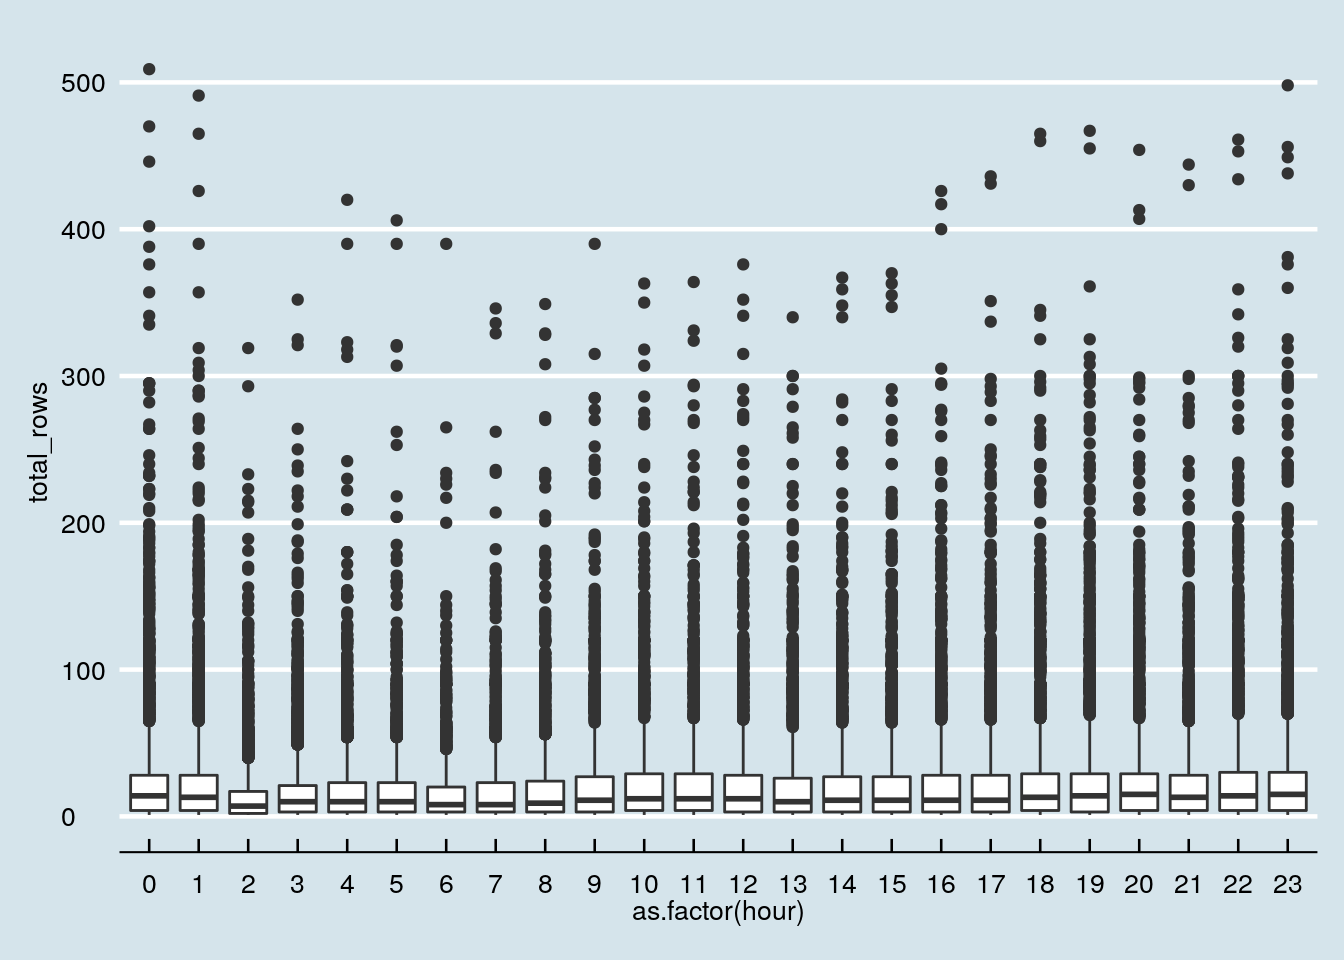 So many outliers…
The leaflet package is the way to go when you want to implement interactive maps in R, especially when working in a Shiny project.
we start by defining the data we want to plot: the density of trips, at 5 am for street with more than 10 occurences, not motorway, neither tunnel :
data.to.plot <-
  OSM_sf.with.Uber %>% filter(hour == 2   &
                                fclass != 'motorway' & tunnel == 'F')

colorPalette <-
  colorQuantile("plasma",
                data.to.plot$total_rows,
                n = 5,
                reverse = T)
And here we go with Leaflet : (we filter on 5 am and use a CartoDB theme, more info here)
Now let’s add the coordinates of the nightclubs in Berlin. For this, we load an other shapefile, the one with the buildings informations, from the GeoFabrik folder :
Let’s filter the night life amenities :
OSM_sf_building.night <- OSM_sf_building %>% filter(fclass %in% c("bar","bbq","biergarten","cafe","drinking_water","fast_food","food_court","pub","restaurant","brothel","casino","cinema","nightclub","stripclub","swingerclub","biergarten"))

ggplot(OSM_sf_building.night,aes(fclass))+ geom_bar(fill='steelblue')+theme_economist()+coord_flip()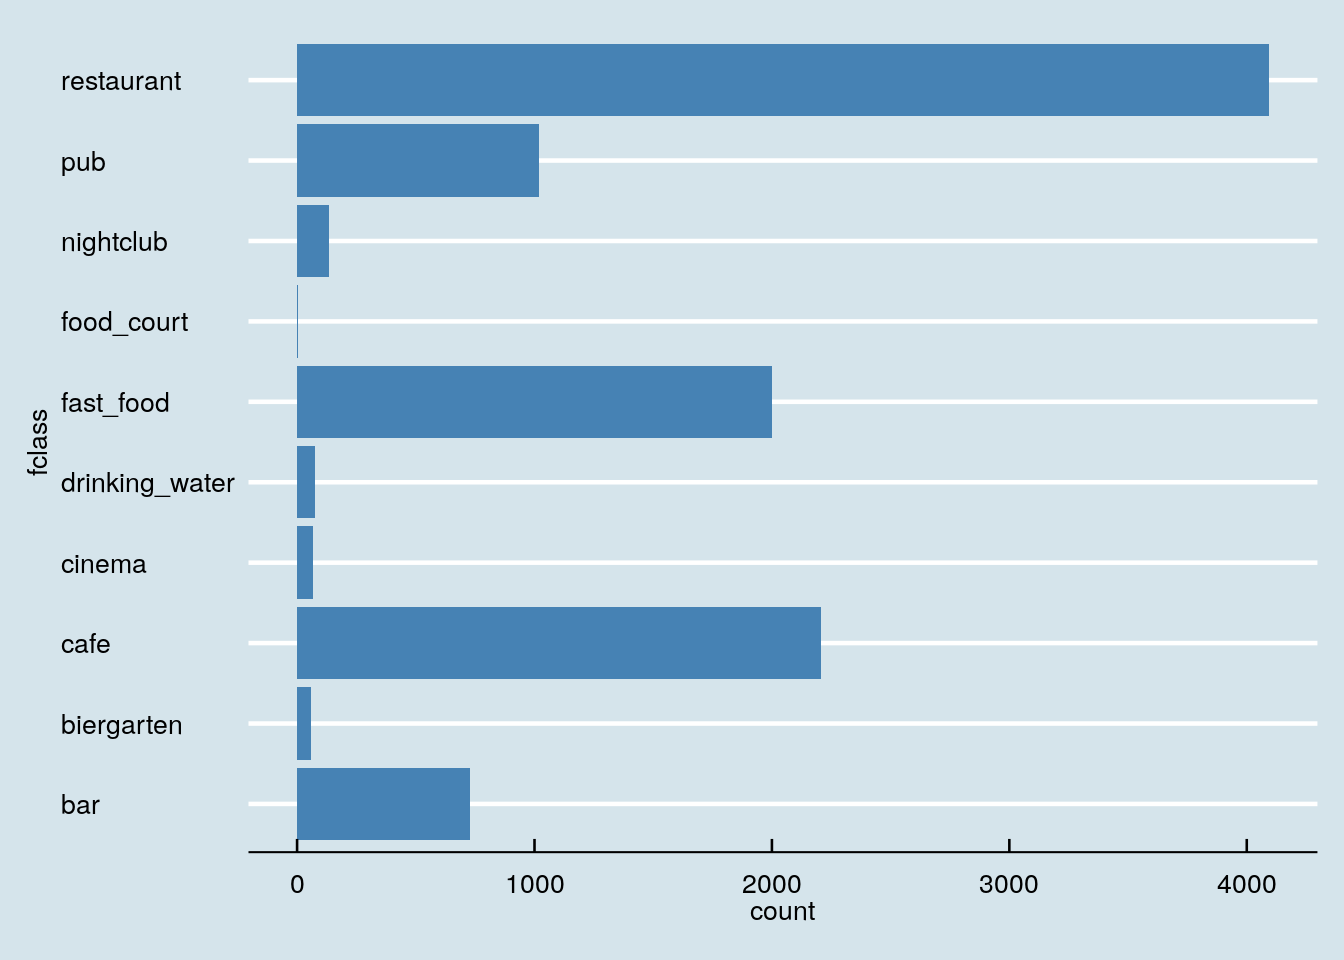
We add the nightclub class data to the Leaflet plot :
leaflet(OSM_sf_building.night %>% filter(fclass %in% c('nightclub')))    %>% addProviderTiles(providers$CartoDB.DarkMatter) %>% addCircleMarkers(
  stroke = F,
  fill = T,
  fillOpacity = 0.3,
  weight = 0.5,
  radius = 3,
  color = 'white',
  popup =  ~ name,
  label =  ~ name,
  layerId = OSM_sf_building.night$osm_id) %>%  addPolylines(data=data.to.plot,
                                        color = ~colorPalette(data.to.plot$total_rows),
                                        weight = 1,
                                        layerId = OSM_sf.with.Uber$osm_id)%>% addLegend(data=data.to.plot,"bottomright", pal = colorPalette, values = ~total_rows,
    title = "Rides density quantiles",
    labFormat = labelFormat(prefix = ""),
    opacity = 1
  )