Chapter 5 Visualizations with ggplot2
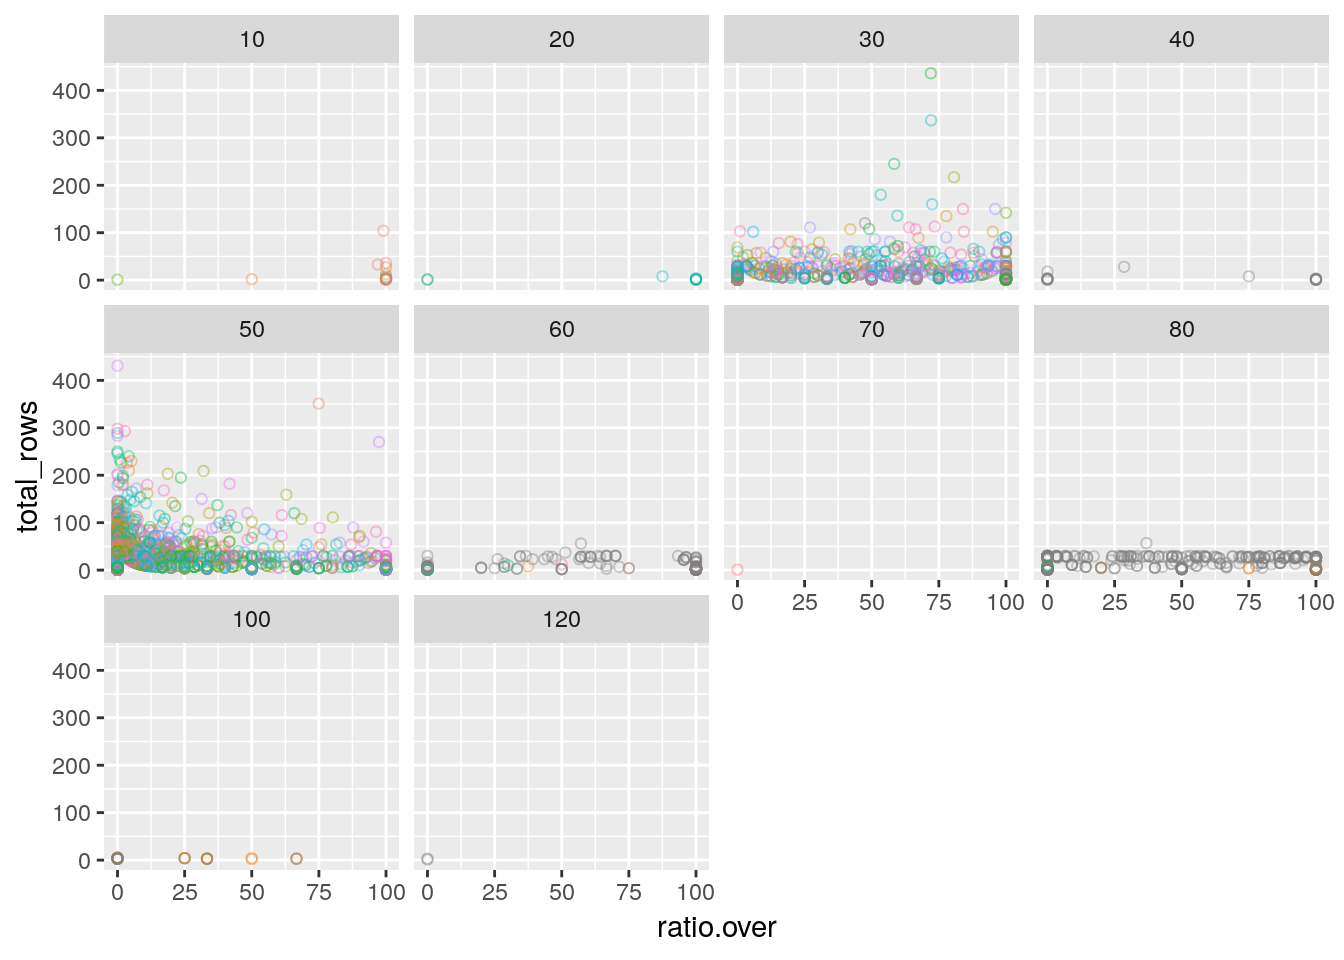
We can plot a sample of this table to have an overview by filtering on the hour equal to 17h :
Here we just confirm what we saw in Chapter 4, it seems some maxspeed are not “standard” or very seldomly used by Uber. We can confirm this with a quick histogram :
## `stat_bin()` using `bins = 30`. Pick better value with `binwidth`.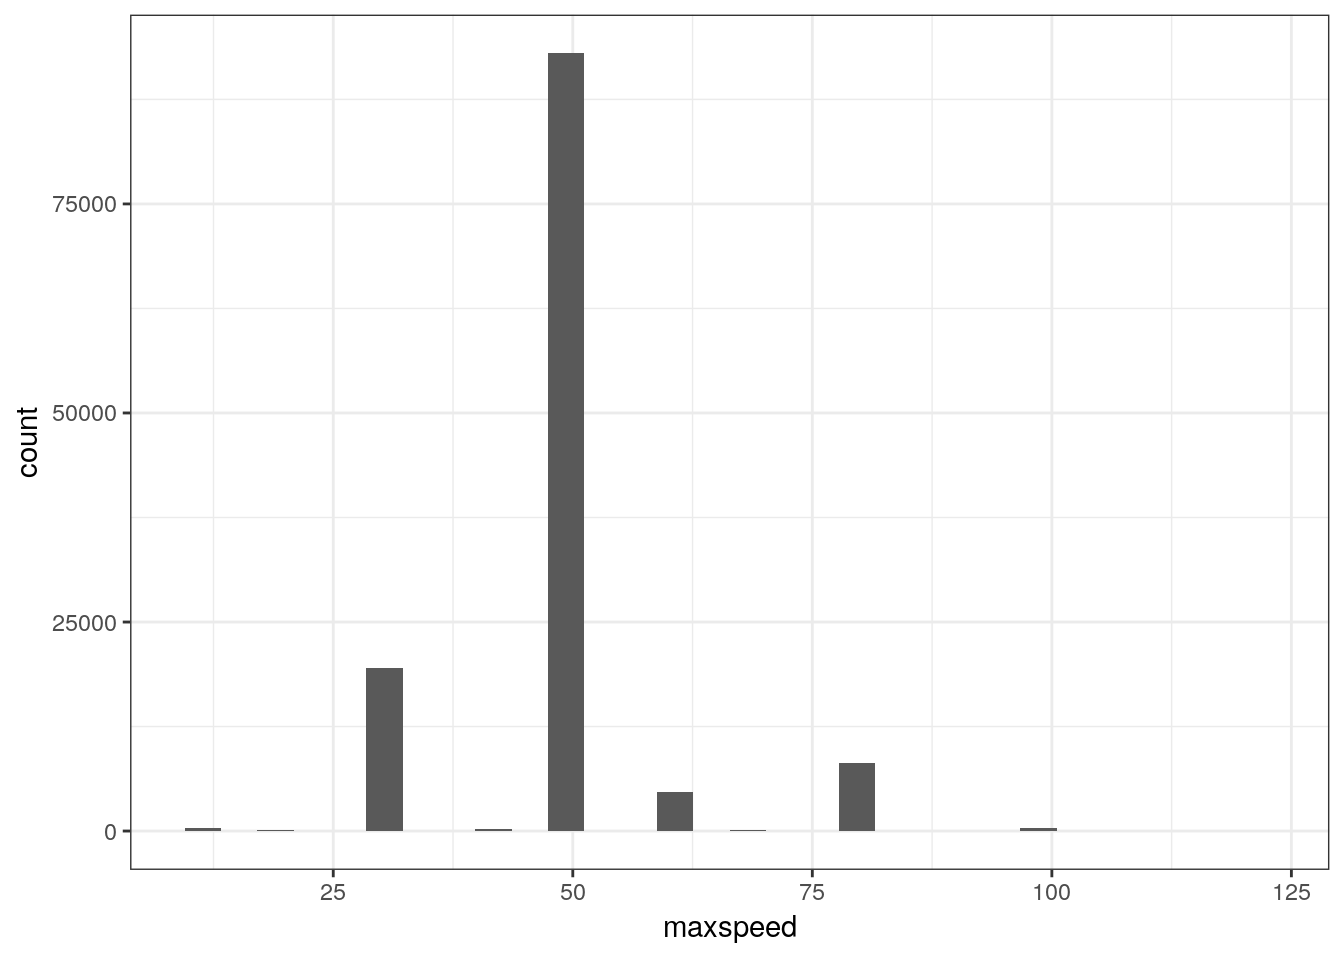 Indeed, 30,50 and 80 kph limits are our numbers.
We can drop the others rows :
Now focus on the maxspeed=50 kph:(the color represents a street name).
Please notice here that we use the ggplotly function from the plotly package to make our ggplot2 chart interactive (under the hood, it is d3.js running, you can be proud of you, really.)
p <-
  ggplot(DT.max.speed.per.way.hour[, name := as.factor(name)][hour == 17 &
                                                                maxspeed == 50 &
                                                                ratio.over < 15 &
                                                                ratio.over > 0], aes(ratio.over, total_rows)) + geom_point(shape = 1, alpha =
                                                                                                                             1, aes(color = (name))) + theme(legend.position = 'None')
ggplotly(hide_legend(p))
What those curves could be ? How can those dots, which color corresponds to a street name, form inverse curves although they are not related ? For instance, the Müllerstraße dot on the plot is next to the Frankfürter Allee dot, and on the same fitting curve, although they are in two different districts of Berlin.
More prosaically, we can plot the over speed percentage in the day : For this, we just use our current table, and aggregate per hour of the day and compute the weighted ratio of over speed :
DT.max.speed.per.hour <- DT.max.speed.per.way.hour[,.(ratio.over=sum(ratio.over*total_rows)/sum(total_rows),mean_speed_minus_max=sum(speed_minus_max*total_rows)/sum(total_rows)),by=.(hour,maxspeed)][,maxspeed:=as.factor(maxspeed)]

DT.max.speed.per.hour[0:5]
## hour maxspeed ratio.over mean_speed_minus_max
## 1: 0 50 14.80034 -10.042412
## 2: 1 50 17.21446 -9.231080
## 3: 2 50 22.51034 -8.057035
## 4: 3 50 25.58019 -7.430214
## 5: 4 50 31.03792 -6.464708We use here the ggthemes package to add some elegance and credibility to our charts with the help of The Economist theme :
ggplot(DT.max.speed.per.hour, aes(hour, ratio.over)) + geom_line(aes(color =
                                                                       maxspeed), size = 1) + theme_economist() + ggtitle('speed infrigment % per hour of the day') +
  scale_color_economist() + theme(plot.title = element_text(size = 12)) +
  ylab('%') + xlab('hour of the day')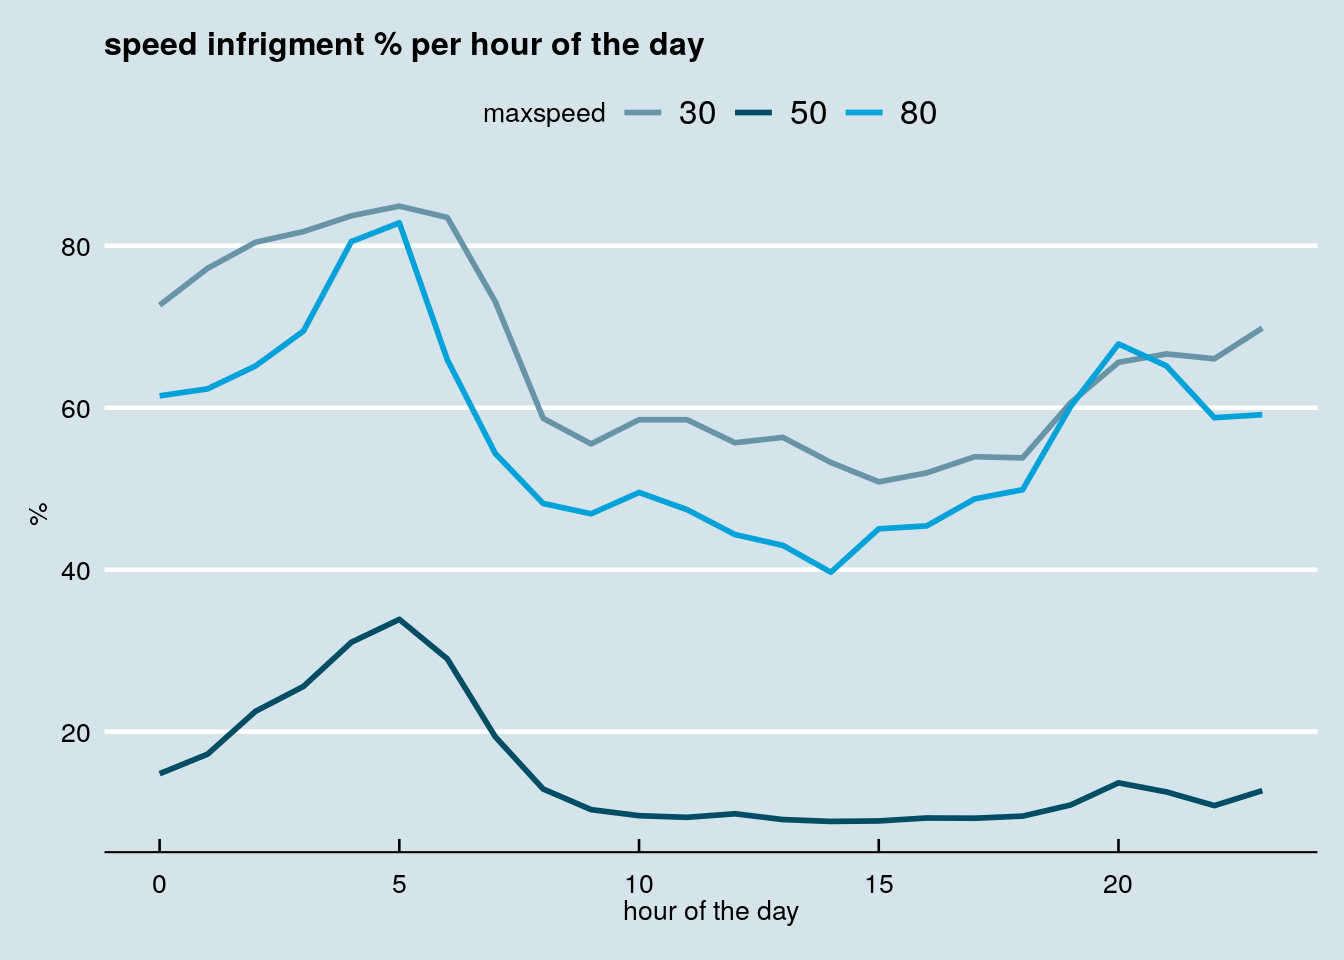
ggplot(DT.max.speed.per.hour, aes(hour, mean_speed_minus_max)) + geom_line(aes(color =
                                                                                 maxspeed), size = 1) + theme_economist() + ggtitle('difference between mean speed and max allowed speed per hour of the day') +
  scale_color_economist() + theme(plot.title = element_text(size = 12)) +
  ylab('difference in kph') + xlab('hour of the day')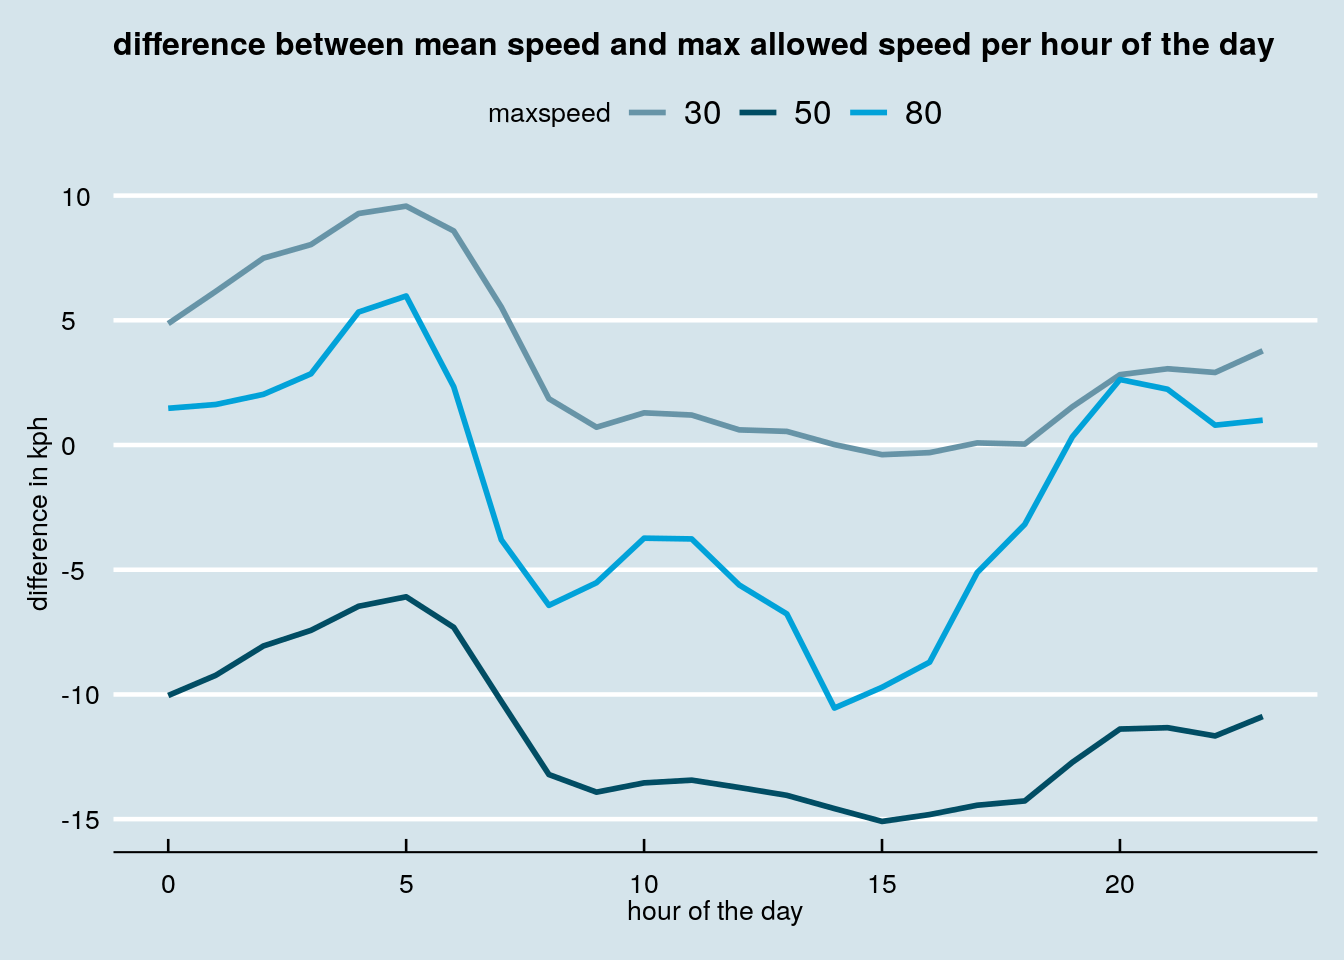
Hey, but we forgot to look at the overall rides along the hour of the day !
How could we do that ? Just reuse the original DT.Uber table and do some aggregation :
##    hour total_rides
## 1:    0      142254
## 2:    1      128207
## 3:    2       57126
## 4:    3       84035
## 5:    4       81893
For the plot, we use an other ggplot trick ; the polar coordinates :
ggplot(DT.rides.per.hour, aes(hour, total_rides)) + geom_line(color = 'darkblue') +
  theme_economist() + ggtitle('Sum of rides per hour along the day', subtitle = 'Warning : based on already aggregated data from Uber') +
  scale_color_economist() + theme(
    plot.title = element_text(size = 12),
    legend.position = 'None',
    axis.title.y = element_blank(),
    axis.text.y = element_blank(),
    axis.ticks.y = element_blank(),
    axis.ticks.x = element_blank()
) + ylab('') + xlab('') + coord_polar() 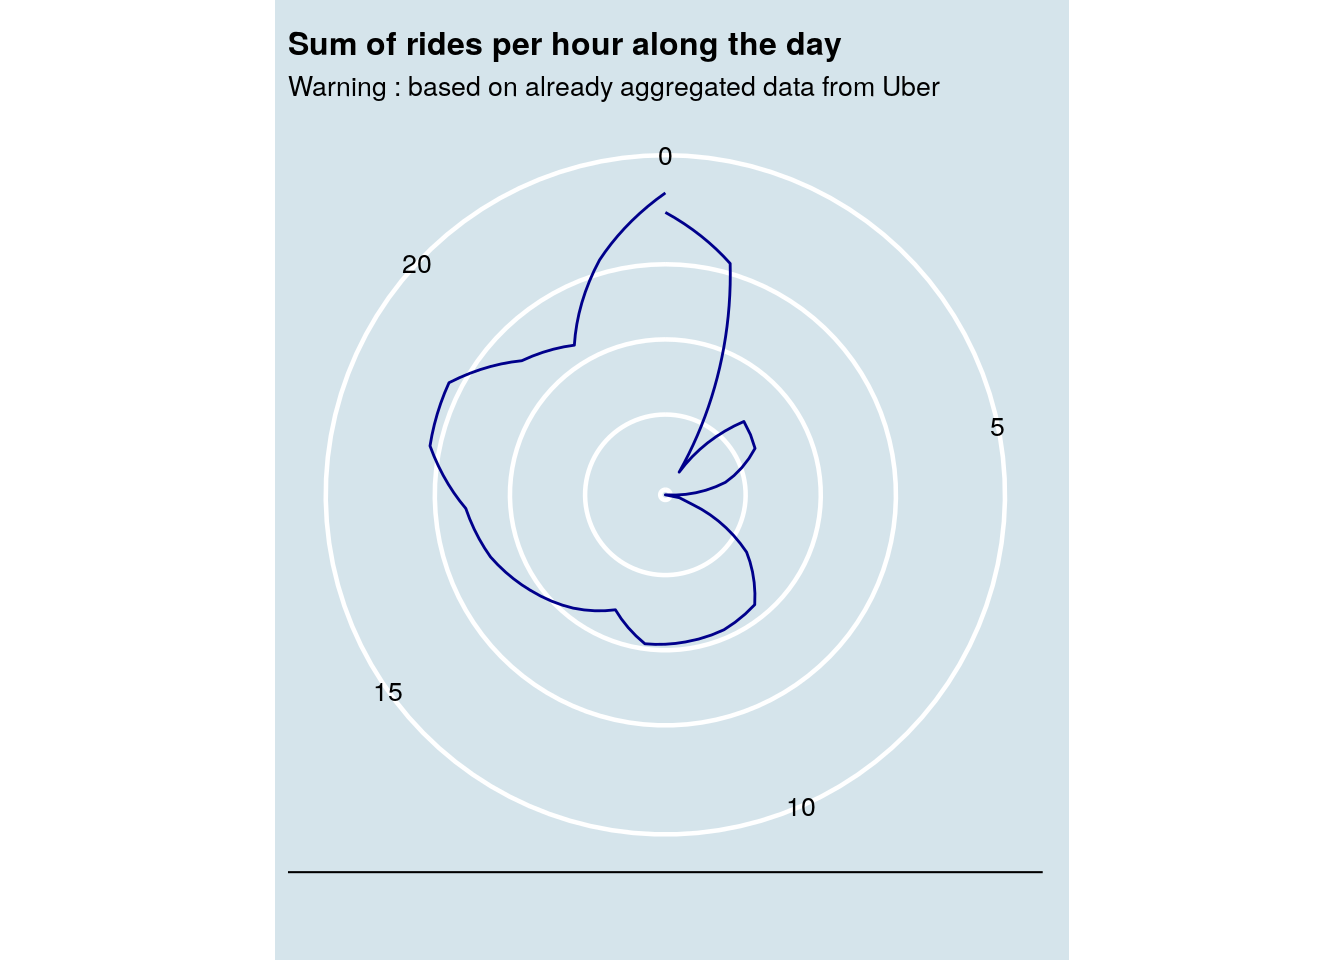
Which gives us a relative idea of the rides volume in time.