3 Asset Management. Thinking About Structure.
Chapter 2 reviewed source of returns by introducing the ideas of factors, or risk premiums, and anomalies, or sources of positive risk-adjusted returns. I think that this is a useful framework for thinking about risk and return in investing. Are you collecting risk premiums? If so, when and how might the risk show up? Are you trying to take advantage of an anomaly? If so, why hasn’t the anomaly been arbitraged away?
You can think about these choices, roughly, as the investment process or strategy. But, a strategy doesn’t happen in a vacuum. A fund manager (and their team) operates within a specific legal framework, providing a structure or wrapper for their strategy. I want to go over these structures in this chapter.
You’re already familiar with these. A mutual fund is a specific legal structure. Same with an exchange traded fund (ETF). And the generic limited/general partner stucture of hedge funds and private equity. There are also large institutional investors, like a pension fund, sovereign wealth fund, or endowment fund that use these products and have their structures. Finally, there are newer “fintech” products that have their own structures, like the robo-advisors or the equity crowdfunding products that make up my entire IG feed.
3.1 Passive vs. Active? Or, Cheap vs. Expensive?
The traditional split in asset management has been active or passive. However, I think the more important distinction is now cheap or expensive. You can have expensive products that essentially just get you a mix of risk premiums, perhaps with some leverage.8 Or, you can have (relatively) cheap products that try to mimic what a traditional active manager might do, but using what we know about factors and anomalies, like this value plus momentum ETF from AlphaArchitect that also uses some short positions to hedge.9 And, you can find ETF products that make sector bets that are nearly free or make more concentrated bets with the manager making the decisions that cost a bit more.
The graph below is my made-up, but hopefully still provides a helpful way of thinking about different investment strategies and structures. There are three dimensions:
- How active is the strategy? In other words, how close is their strategy to a broadly diversified portfolio? This is by no means the only definition of active, but is one I’m going with in my made-up graph.
- How much does the strategy cost to access?
- And how liquid is the strategy?
Notice that there’s nothing here about whether a strategy has alpha. By definition, a truly passive strategy is not going to have alpha. However, just because a strategy is active, perhaps with a concentrated portfolio of difficult to invest in securities, that doesn’t mean that the fund manager has any alpha. In fact, very active strategies can have negative alpha. A good rule of thumb - assume no alpha and that all of your returns are coming from risk premiums. Some risk premiums might be harder to get, so they necessitate a more active, more costly strategy. But, these are still just risk premiums, not a magic source of alpha.
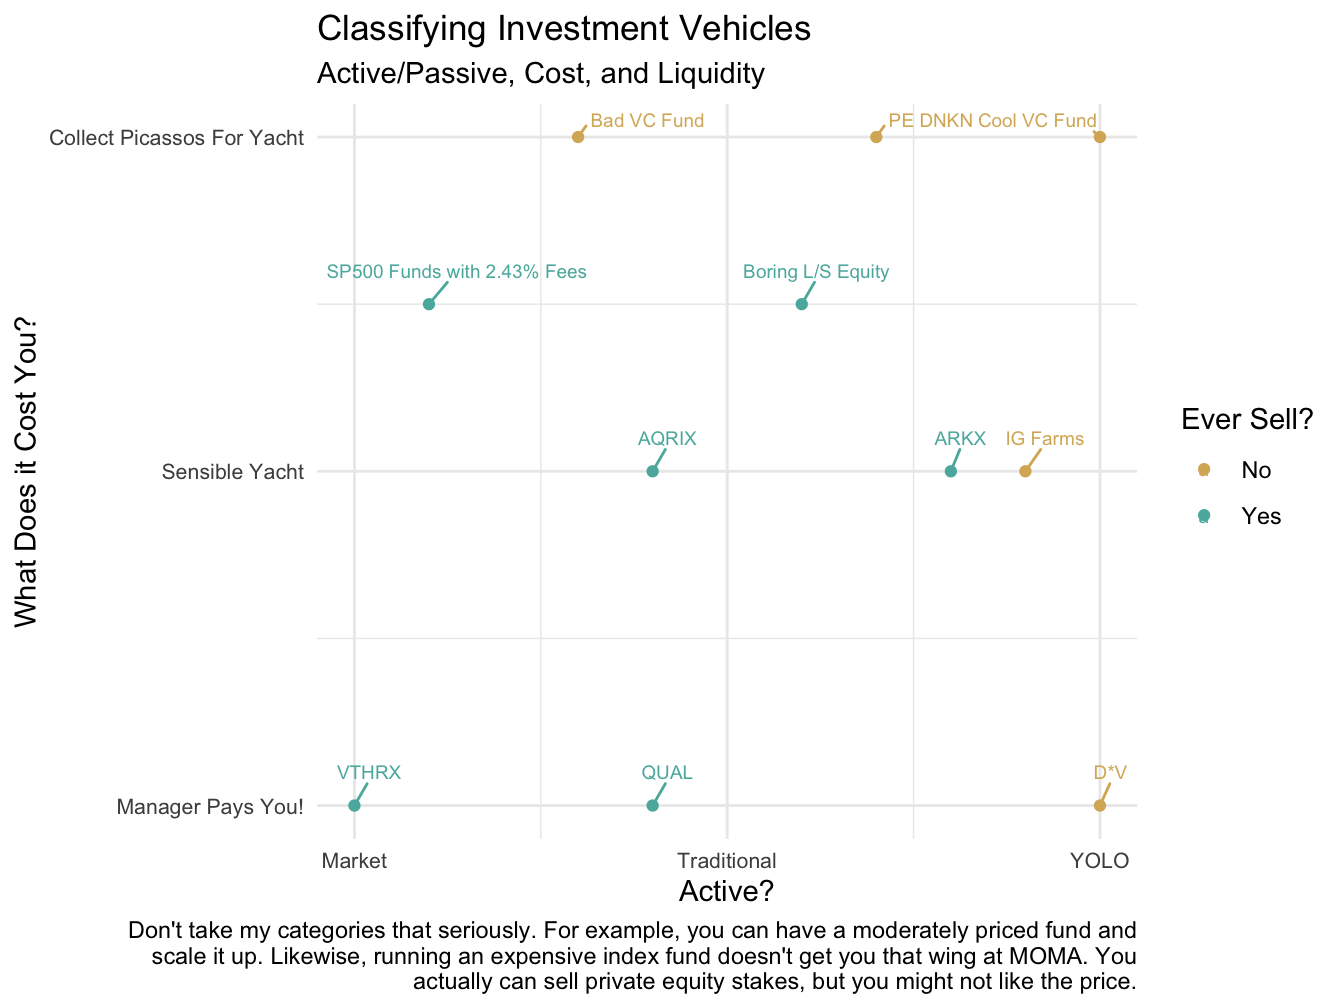
Figure 3.1: An Essentially Made Up But Kind of Still Accurate Way of Categorizing Investments
I have given several examples of strategies and structures in the graph. For example, QUAL is that iShares Quality ETF. The ETF structure is quite cheap and the strategy is a diversified portfolio of U.S. stocks that meet their quality definition. The type of stocks held might not be that different from what a traditional growth-at-a-reasonable price (GARP) manager might do, except that the ETF is simply selecting stocks that meet the definition, which makes the strategy very cheap to implement.
Other strategies are more active. For example, I get ads to buy farmland on Instagram a lot. And a new space-focused thematic ETF by Ark Invest is likely to be very concentrated, where Cathie Wood selects the positions and weights.10 You can sell the ETFs intraday. Good luck getting out of privately placed securities, like securities backed by real estate purchased directly from the fund. Private equity, like the recent purchase of Dunkin’ Donuts by PE-backed Inspire Brands, is another strategy that can be quite concentrated, costly, and illiquid. It is also active, but there is a question of whether or not general private equity returns can be replicated using publicly-available securities.
And, apparently, D*V managed to sell some of his GME. But, when you are in a bubble scenario, timing the exit is very tricky.
3.2 40-Act Funds (Mutual Funds and ETFs)
These are mutual funds and exchange traded funds. They are called 40-Act funds because their creation is due to the Investment Company Act of 1940 as registered investment companies. The 40-Act covers four types of funds: mutual funds, ETFs, closed-end funds, and unit investment trusts (UITs). Each of these structures has a pass-through tax status, such that the investor holding the fund is taxed, not the fund itself. However, as we’ll see, mutual funds and ETFs are taxed differently.
The 40-Act increased market transparency and created the types of disclosures that registered investment funds now make, as well as regulated leverage and general oversight of the fund. These funds must file prospectuses and report returns and holdings. There is a board of directors that overseas operations. There are limits on the use of leverage and derivatives. Finally, the 40-Act resticts compensation types, such that these funds do not get the type of performance fees that you see in hedge funds and private equity. For example, registered investment funds can not charge an option-like fee where the fund gets a portion of positive performance above a threshold, but does not participate in the downside.
These rules exist to mitigate agency problems. As you learned in corporate finance, agency problems exist when the principal (the fund manager) does not act in the best interest of the investors (the agent). The system is far from perfect. It can be difficult to tell how much a fund or advice actually costs, many 401(k) plans use funds with high fees, many registered investment advisors have conflicts of interest, and there is a great deal of misconduct among financial advisors in general.
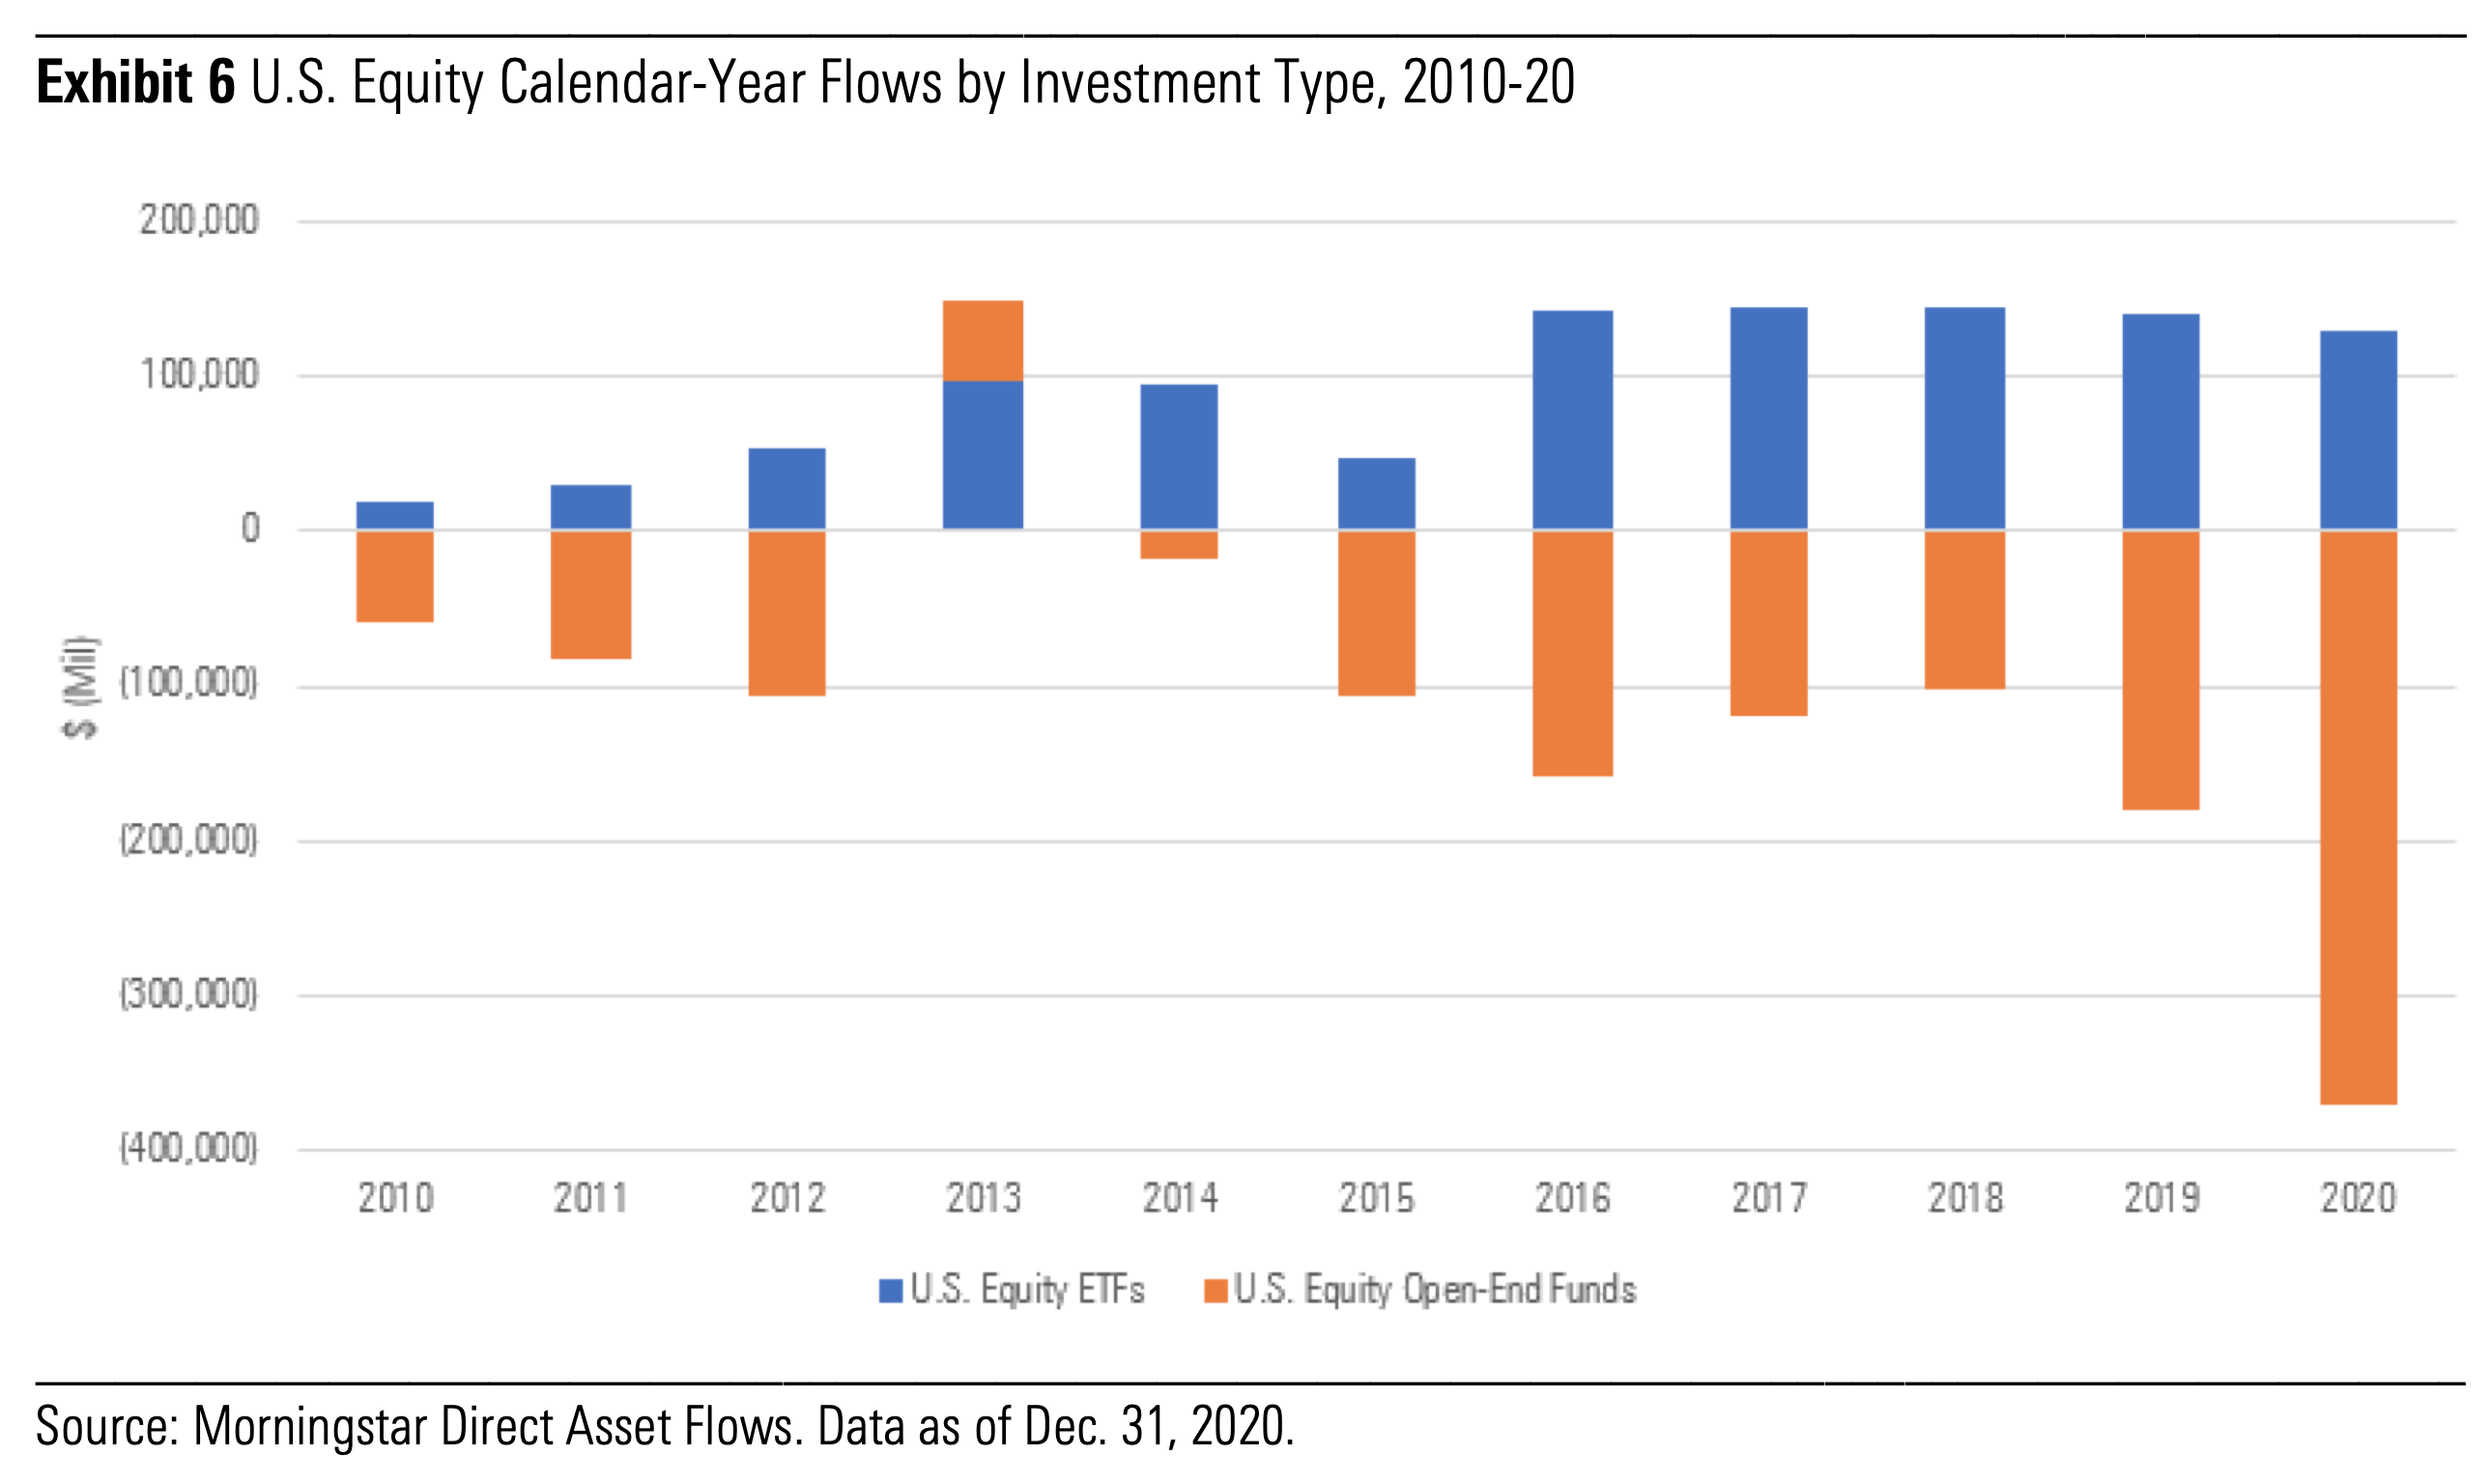
Figure 3.2: Flows have been going into ETFs, not traditional mutual funds. Source: Morningstar
3.2.1 Mutual Funds
You know what a mutual fund is. These funds issue shares when purchased and are redeemable at net asset value (NAV) at the end of each trading day. We are going to discuss open-ended mutual funds, where the investor purchases or redeems shares from the issuer (i.e. the fund company). Therefore, the number of shares outstanding is always changing.
Closed-end mutual funds have a fixed number of shares and trade like a stock. They also can trade at a premium or discount to NAV. However, they are a very small part of the investment landscape, so I’m skipping them in my notes. They use to be more important.
Mutual funds can be active, like a traditional fund focused on stock selection and a small number of holdings, or they can be passive and give you global stock exposure for next to nothing. Or, they can be active and still just give you essentially benchmark exposure while charging you higher fees.
The active funds will generate returns from risk premiums and, hopefully, by taking advantage of anomalies. Note the variety of ways active managers try to capture anomalies now. Some are concentrated and going fundamental analysis, listening to conference calls, talking to management and suppliers, etc. Long-leaf Partners is a value equity fund that follows this type of strategy. Others do something similar, but without the “hands-on” approach. For example, LSV Asset Management also does deep-value style investing, but they are running computer screens instead of talking to the CFO. Both funds have been around a long time and both funds are trying to access similar risk premiums and anomalies.
Much of the material that follows again pulls from Ang (2014).
3.2.1.1 Performance and Persistence
How well have mutual funds done? This brings us back to Chapter 2, since we need a risk model to assess performance. It doesn’t help us to say that mutual funds have, on average, returns x% per year on average. We need a point of reference based on the risks that they took.
But, before that, we should acknowledge that the data can be challenging here. Mutual funds come and go. Poorly performing funds close and disappear. When looking at historical funds we want to acknowledge and correct for this suvivorship-bias. The funds that we observe right now are the “winners,” which positively biases our measures of historical performance. Ang (2014) uses the examples of two funds in the same fund family, Janus Worldwide and Janus Global Research. Janus Global Research is an older fund with much better risk-adjusted performance than Janus Worldwide. In 2013, the two funds merged together, “erasing” the record of Janus Worldwide, unless you were careful enough to preserve it. This is how mutual fund families can run ads about how all of their funds beat their Lipper averages! If you use just the returns of live mutual funds and ignore all of the “dead” funds, you’ll end up overstating performance by 1-2% per year and thinking that mutual managers add more value than they really do.
How well do mutual fund managers do on average? This is a huge topic. Mutual funds follow all types of strategies, all over the globe. The mutual fund is just the wrapper for the strategy. The fact that something is a mutual fund tells us little about the risks that they take. Again, we need a risk model to assess performance. If you tell me that you doubled your money last week, I’m going to ask you about the risks that you took! I will not be impressed if you tell me that you put it all on black in Vegas and came up a winner (1:1 payout with 47.4% odds and double-zero wheel).
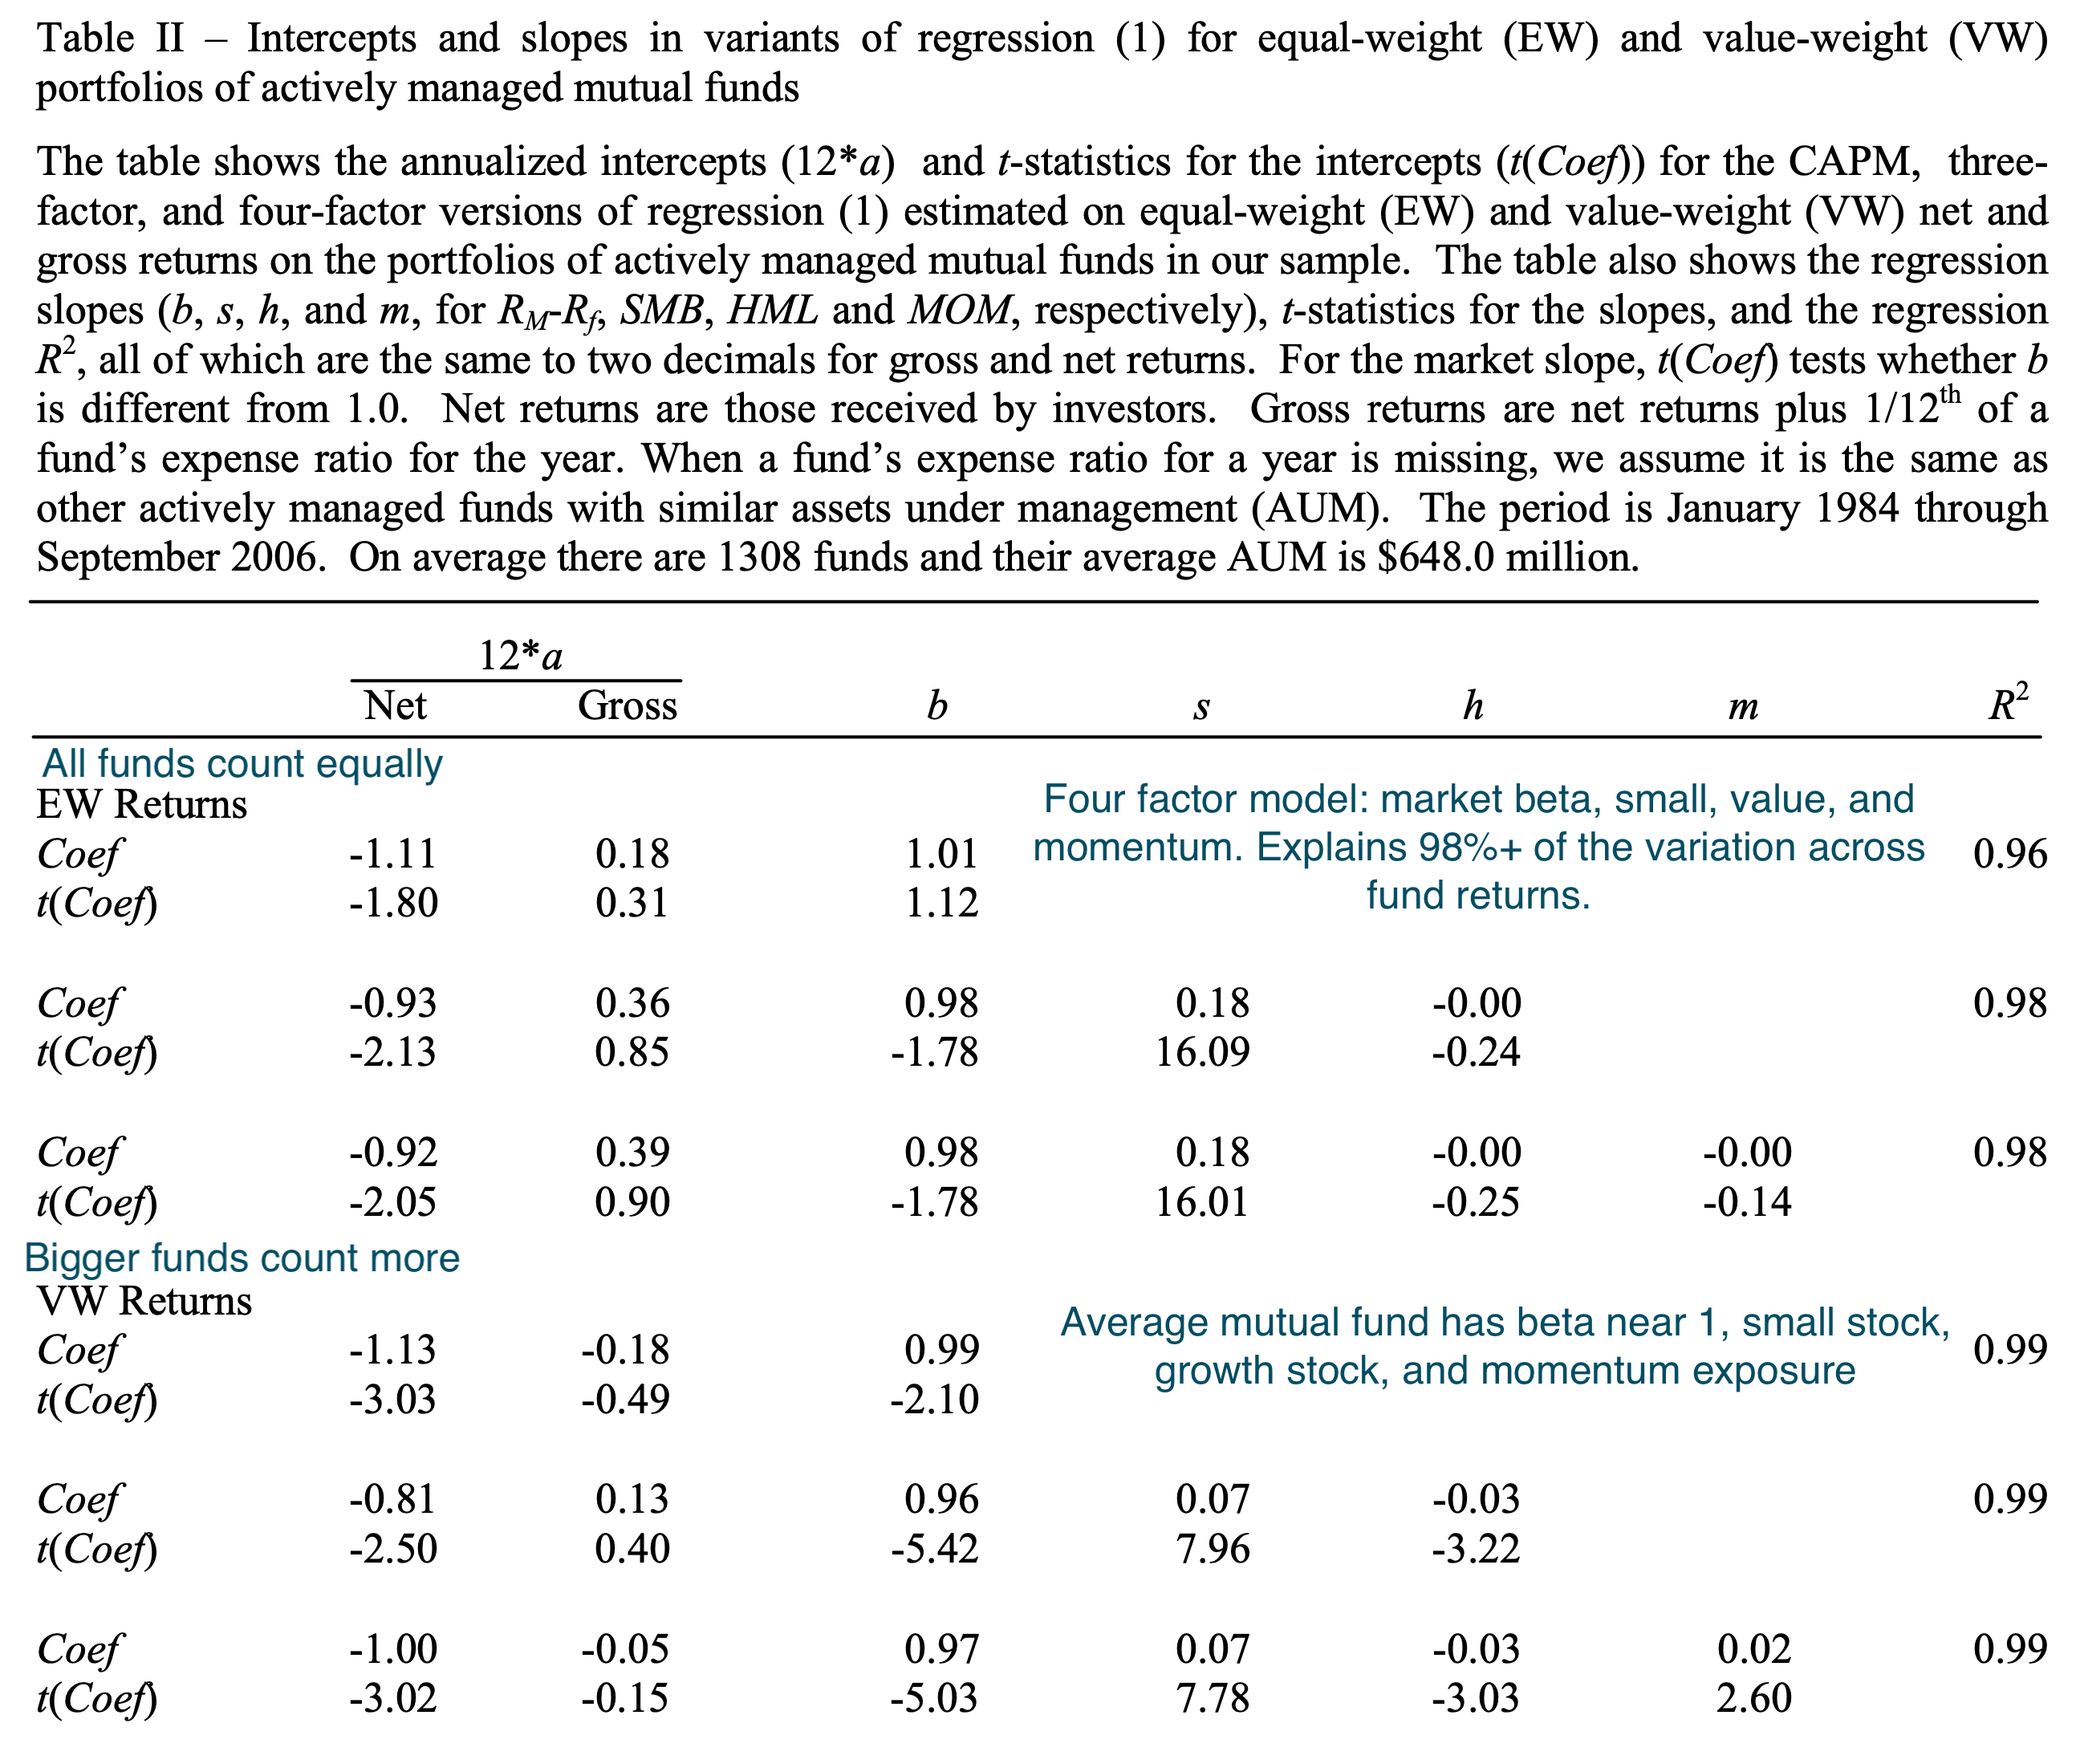
Figure 3.3: The average mutual fund has negative alpha, after fees. Source: Fama and French (2010).
One of the most influential and relatively recent papers on this topic is, again, by Fama and French (2010). One of their main results is shown in Figure 3.3. The average mutual fund does not have alpha after fees and most of the variation across fund returns is explained by four factors: market risk, small stock risk, value stock risk, and momentum. This does not mean that every fund’s return is explained by these factors or that no funds have alpha. We are just looking at the typical fund here. But, consistent alpha is very rare among mutual funds.
Other work has shown that larger funds do worse and more expensive funds do worse. You don’t necessarily get what you pay for in asset management, which actually makes sense. Active management, “picking stocks,” is a zero-sum game, in that for every winner there must be a loser. Competition in this game destroys a trader’s edge. If you have the rare skill to consistently beat the market, then you are going to capture much of that skill in fees. Other businesses are not like that. The model by Berk and Green (2004) makes a similar point. Successful managers attract assets that reduce future returns due to dis-economies of scale. In other words, if I have skill, my best idea might be great, but my 100th best idea might actually not be that good. But running more money means I might have to invest in that 100th best idea. The best managers might also get to charge higher fees in equilibrium. So, more fees and more assets to the best managers means that clients end up with little to no after-fee alpha in equilibrium.
But, you don’t want to invest in the average fund, right? You want to invest in the good funds, before everyone else has discovered them? Can we find the hidden good funds and just invest in those? This is a different question and gets at performance persistence. Can we identify talented managers who are going to provide positive risk-adjusted returns for at least some portion of the future? There is evidence that the worst funds stay bad, so you can try to avoid these. However, there is not much evidence that the best funds continue to outperform. Any return pesistence that you do see is likely from the fact that some mutual funds hold momentum stocks and then these stocks continue to do well. But, this performance isn’t about manager skill – it is about taking factor risk! Here is a recent paper that shows how hedge fund managers (discussed below) are contrarian on average when selecting securities, while mutual fund managers are trend-followers. The authors show that the contrarian-minded hedge funds actually do have performance persistence. This fits with what I’ve seen in the industry. Finally, there is evidence that more active and patient investors are rewarded. This means holding portfolios that don’t look like the overall market and patiently holding on as the market eventually moves the prices of the securities that you skillfully selected in your favor. However, a lot of this ourperformance occurred in the past. The last decade has been tough for any manager that deviated too far from the market capitatlization weighted index.
What do actual mutual fund investors care about? This question gets at flows. Where do investors send their money? Turns out that they look at recent returns and Morningstar rankings. Very few investors are actually looking at these funds to see what’s driving their returns. Mutual fund flows are also “sticky,” as investors chase good funds and are then reluctant to leave bad funds.
Can Morningstar research help you predict mutual fund returns? Maybe! Here’s an older paper that suggests that the Morningstar star ratings are useful. A recent paper shows that the qualitative adjustments made by Morningstar researchers appear to help select funds. Similarily, analyst reports at Morningstar might add value above the simple quantitative rating. However, you need to be careful. Mutual funds will misrepresent their categories, which lead to incorrect risk adjustments. If you properly categorize fixed income funds, for example, five-star Morningstar funds do not look as promising.
Recent work on mutual fund selection has even used machine learning techniques in order to try to find funds that will produce positive risk-adjusted returns in the future.
Taking all of this evidence in, I think that you can argue that we’ve had too much active management in the past and that the move to passive and cheap strategies is a long overdue correction. Will it swing too far in the other direction? Does too much indexing inhibit price discovery and make markets less efficient? I’ll get into this a bit in Chapter 4, but will just say that I doubt we’re at that point yet.
3.2.1.2 Types of Fees
I think that you’ve seen this material in our investments course, but I want to quickly summarize some of the types of fees that you pay when you invest in mutual funds. We’ll contrast these with hedge funds below. Some fees to pay attention to are front-end loads (pay a percentage of assets invested when you buy the fund), back-end loads (the same, but when you sell), and operating expense fees. You can tell a story about how loads can be good for investors, since they discourage entry and exit into the fund, which could cause the manager to trade and impact the performance of other investors. However, I would never pay one. Operating expenses are a percentage of assets managed and include management fees and 12(b)-1 fees, which pay for the marketing and distribution of the fund. I also see no reason to ever use a fund with 12(b)-1 fees.
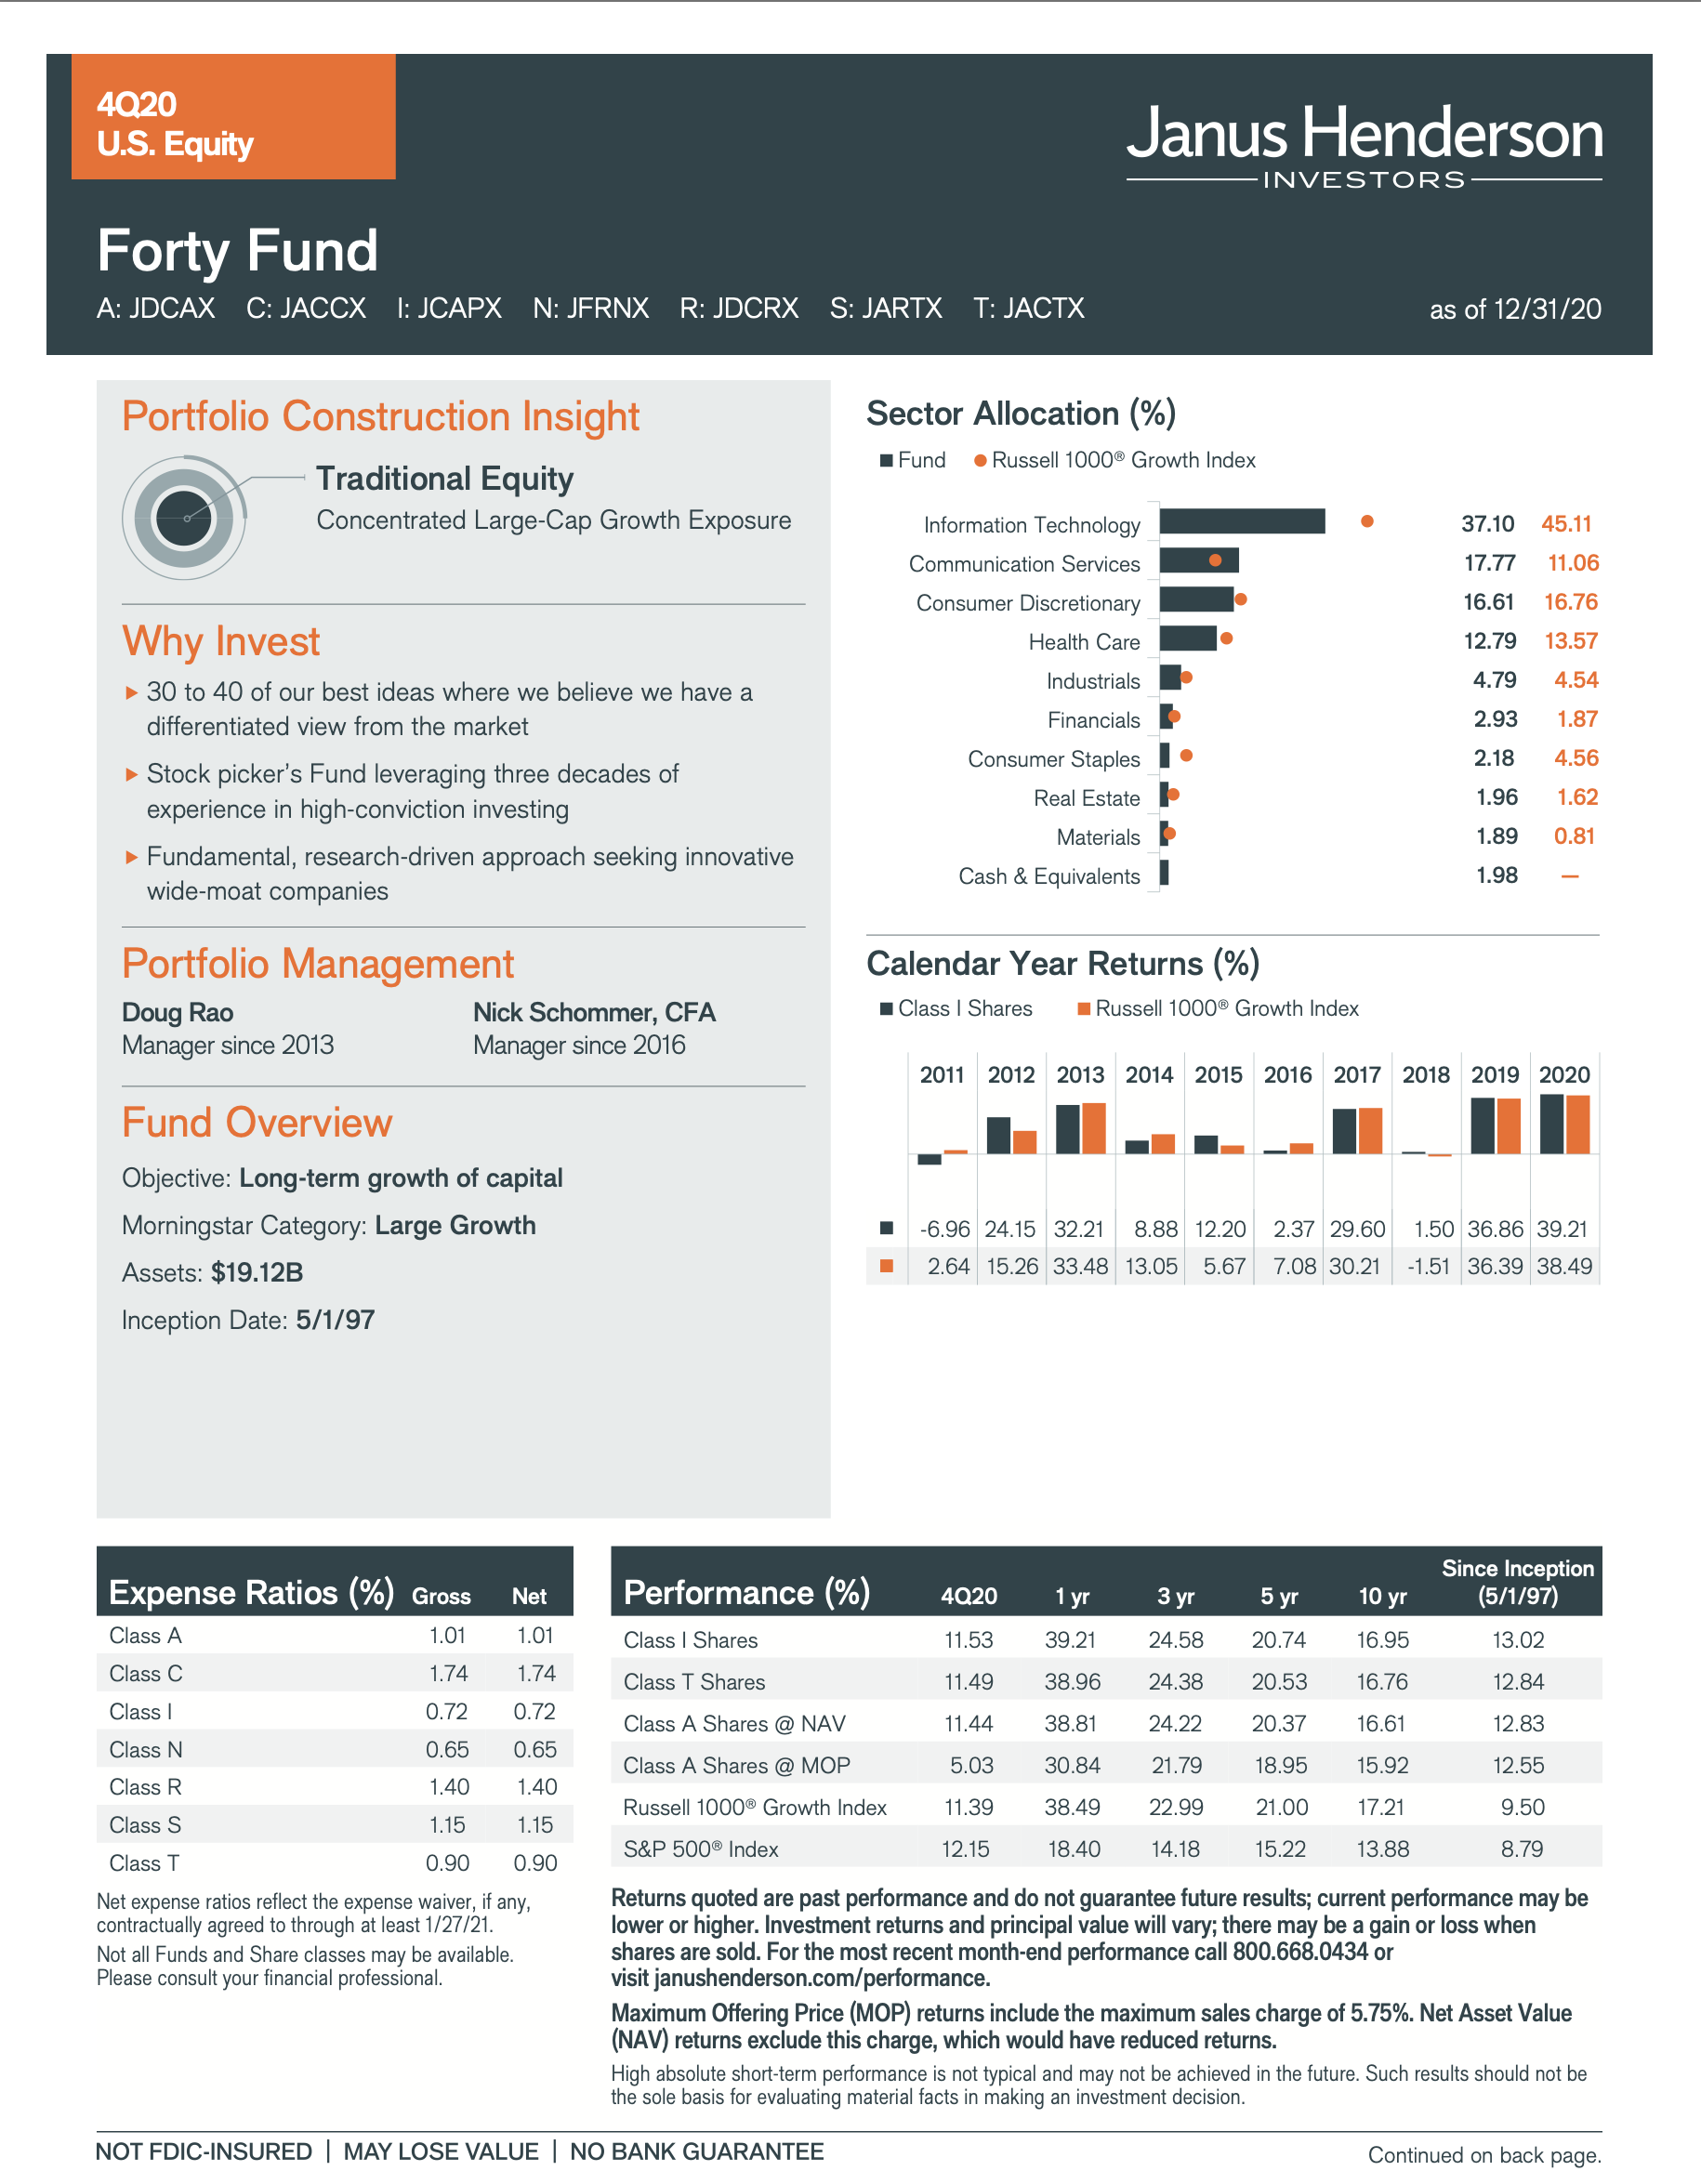
Figure 3.4: The Janus Henderson Forty fund has seven different share classes with different fee structures. Source: Janus Henderson.
You’ll see fees vary by share class (e.g. Class A, Class B, etc.). You can see an example of this for the large-cap growth Janus Henderson Forty fund in Figure 3.4. Why do they have so many share classes? Each share class has a different type of fee structure, some with loads, some with marketing fees, etc. You can see this in Figure Figure 3.5. You can invest in a large stock growth ETF for 4 basis points, or 0.04%. The rise of ETFs and index funds has put downward pressure on fund fees, though they are still quite a bit higher than the more passive alternatives.
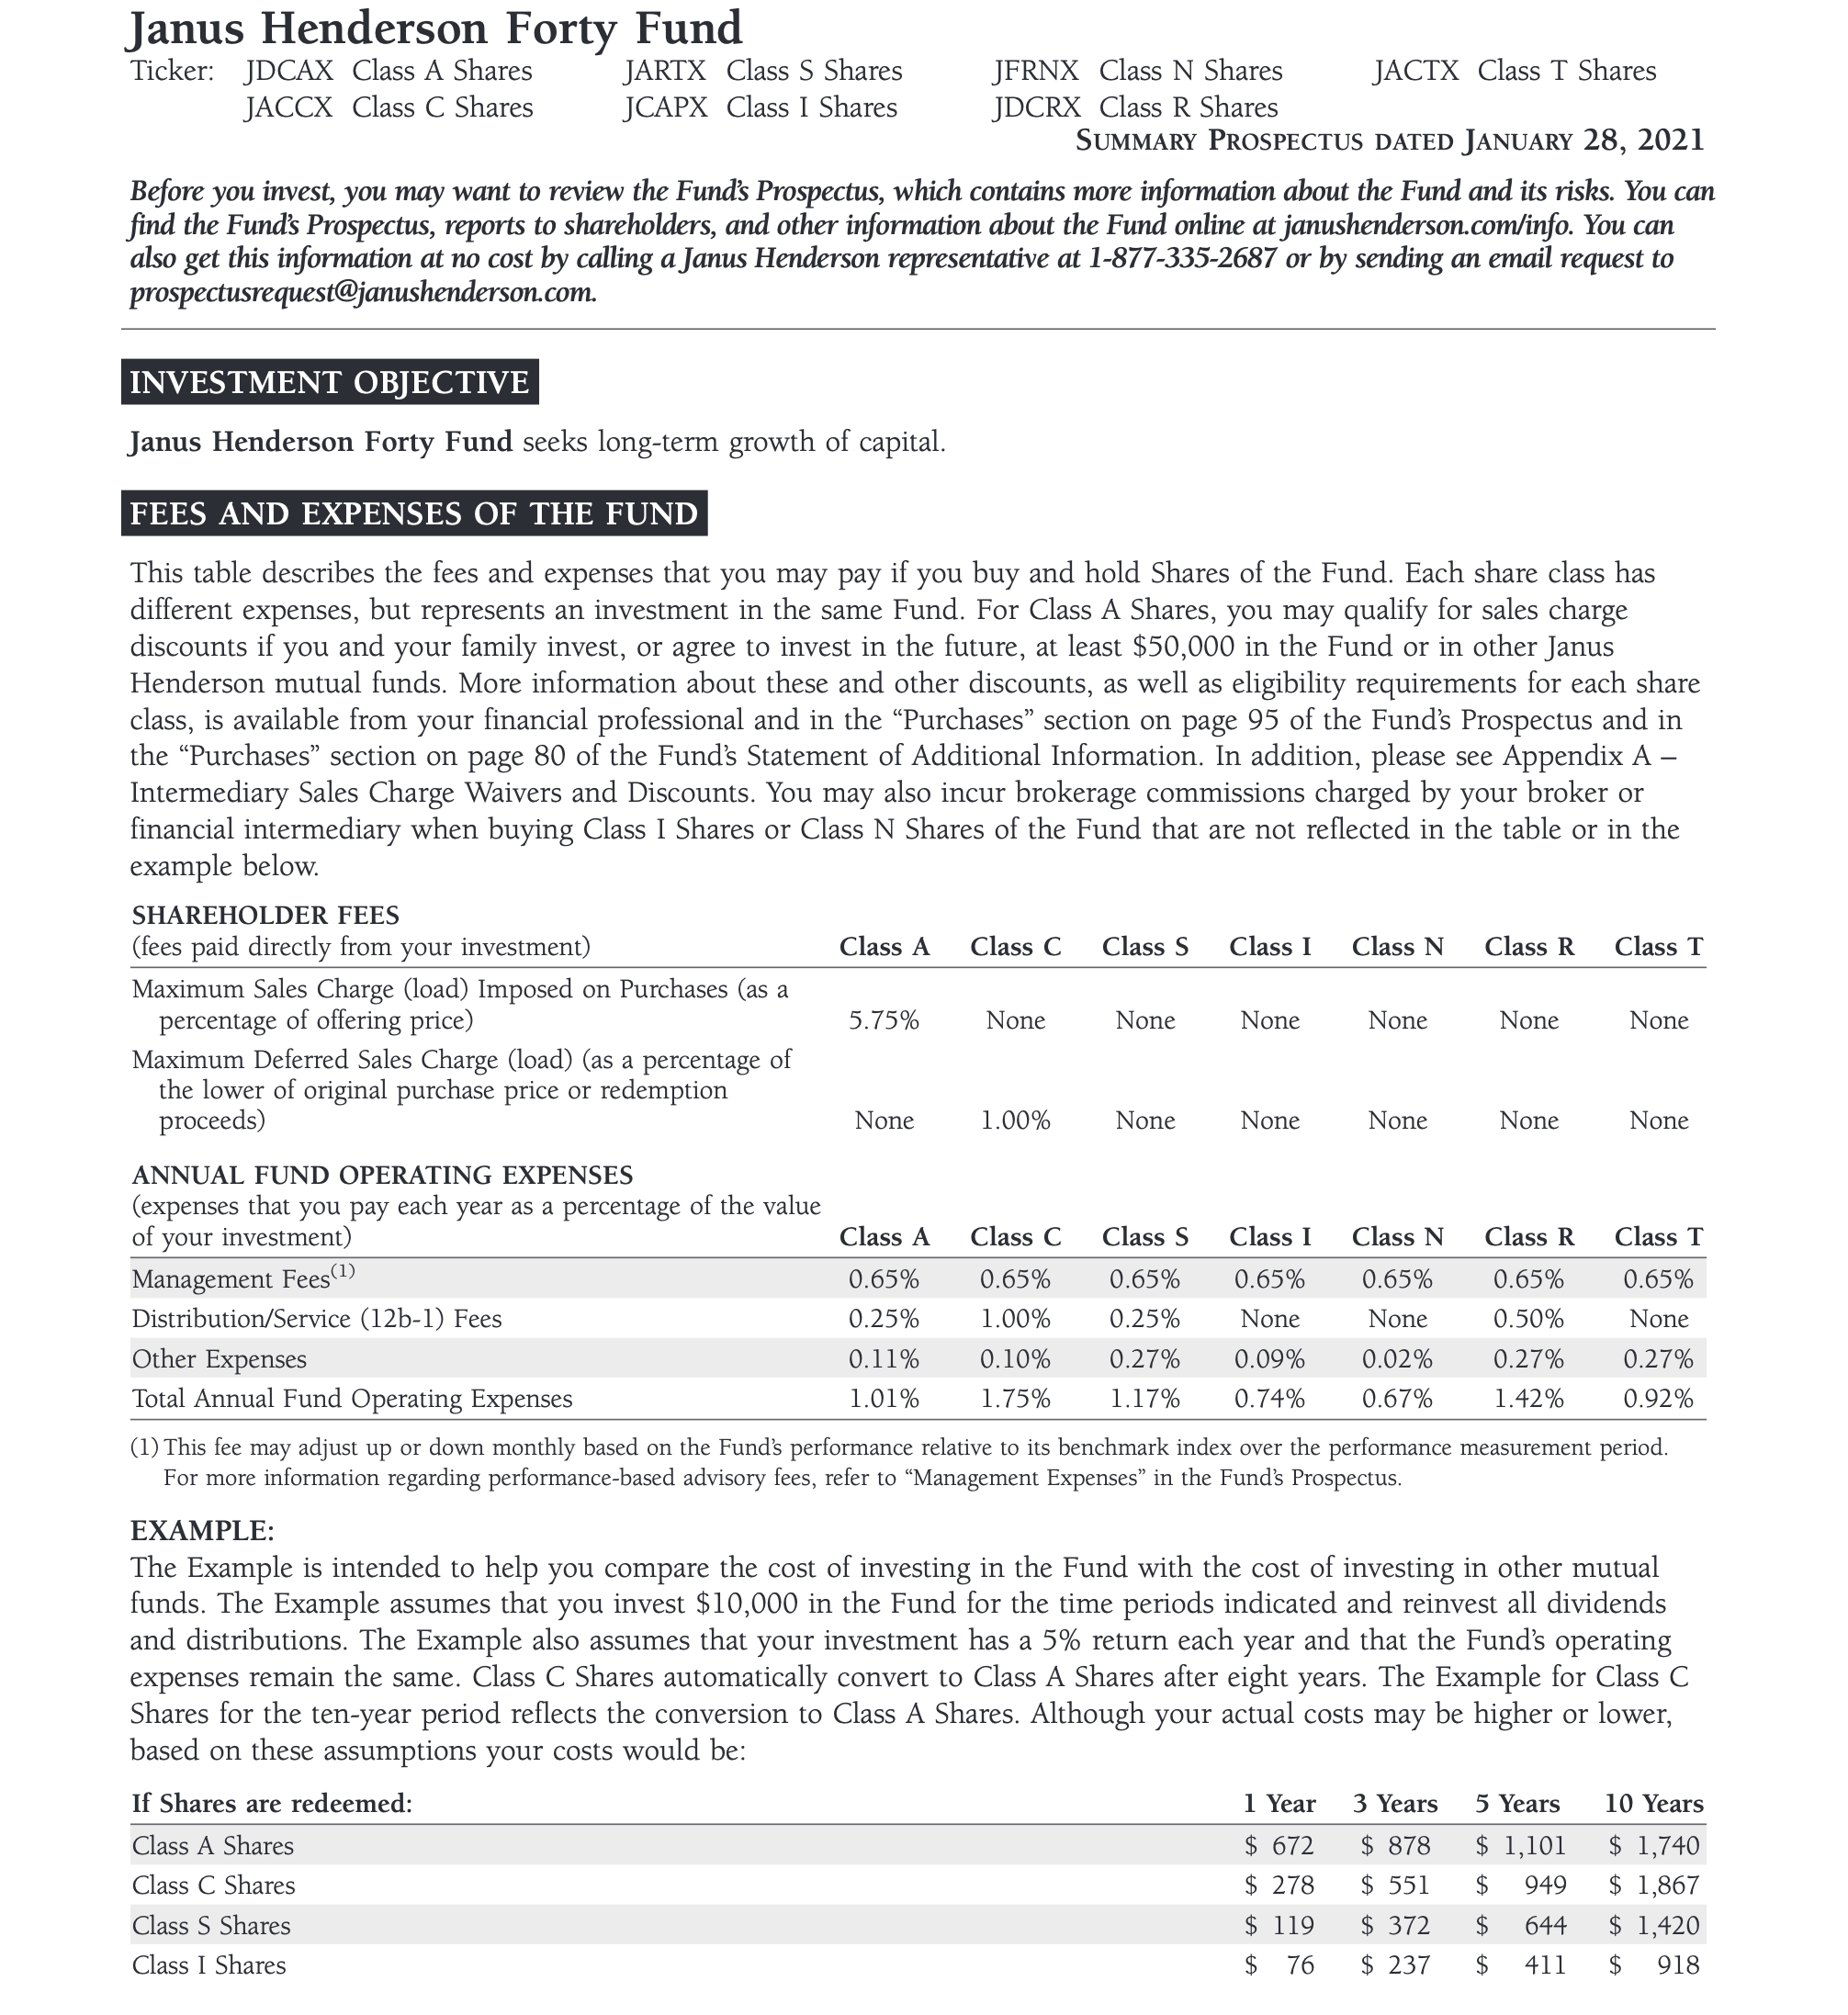
Figure 3.5: The fee structure is complicated! Source: Janus Henderson.
Finally, mutual funds face trading costs when making their investments. For example, the fund might pay commissions when buying and selling securities. These need to be disclosed by the fund, but not in the operations fee. All investors face the bid-ask spread when trading. Afterall, this is how market makers earn a living – selling things (the ask) for a little more then they pay (the bid). Finally, the biggest trading cost for a professional investor is potentially market impact. This is where skilled traders (and programmers) are important. You don’t want your own trading activity to impact the price that you’re paying.
3.2.2 Exchange Traded Funds (ETFs)
Mutual funds have been around a long time. The first ETFs came about in the 1990’s, with SPDR (to track the S&P 500) and QQQ (to track the NASDAQ). However, there recent growth is changing how individuals, financial advisors, and even hedge funds invest. From Josh Brown at Ritholtz Wealth Management on how investment advisors have left the stock-picking business:
Advisors are obsessed with delivering a low expense ratio core portfolio because it makes their overall management fee to the end-client more palatable. This is a major part of the story about this era’s mass defection from traditional ’40 Act mutual funds and more expensive active management. CNBC.com said last fall that “The latest survey of advisors conducted by the Financial Planning Association found that 88 percent of those surveyed now use ETFs, compared to 40 percent in 2006.”
The evidence for overall average performance of ETFs is similar to mutual funds, as you might expect. After all, the ETF is just the wrapper, not the strategy, though, historically, ETFs have been for “passive” than mutual funds. This is changing and depends on exactly how you define passive.
The SEC has a nice summary of ETFs and their properties here. This paper is also good. Bloomberg has a six-part podcast on the history of ETFs.
.](images/02-etf-aum.png)
Figure 3.6: The ETF world is dominated by just a few firms, though ARK is currently fourth in flows over the past three months. Margins are low for most firms, so you need to scale. Source: ETFdb.
3.2.2.1 Differences from Mutual Funds
There are several differences from mutual funds that have made the ETF wrapper attractive to investors, as discussed in Ang (2014).
- More liquidity. ETFs trade throughout the day, so they can give you immediate liquidity if you want to sell, or immediate exposure if you want to buy. Maintaining this liquidity can be tricky, though. ETFs, like mutual funds, have a Net Asset Value (NAV) for their underlying assets. Ideally, the price should match the NAV, like with mutual funds, but there can be small discrepancies.
ETF shares can be created by firms acting as authorized participants (AP). An AP, like a broker or large institutional investor, can deliver the basket of underlying securities that the ETF owns to the ETF and receive large blocks of shares in the ETF. They can also do the opposite, by delivering shares and receiving the underlying securities. This share creation and distruction process helps keep a price near the NAV.
ETF pricing can be thought of as an exercise in no arbitrage opportunities should exist. Suppose that an ETF was trading on an exchange for $25.10/share, but the underlying securities were worth only $25/share. This is an arbitrage opportunity since the ETF is just a wrapper for the underyling stocks and bonds owned. The AP could deliver the underlying securities worth $25 and receive shares worth $25.10. They would then sell the shares, driving the price back to NAV. Price deviations from NAV are usually very small and last only a few minutes. Markets (and the computers doing the trading) are great at finding these types of arbitrage opportunities.
But, this isn’t always the case. The Flash Crash on May 6th, 2010 saw markets drop 5% at 2:40pm for about 20 minutes. Other weird prices occurred across more than 300 securities. For example, Sotheby’s went from $34 to $99,999.99. ETFs accounted for 70% of the trades that were eventually cancelled. Recent work has found that market shocks like this can come from ETF trading.
Tax efficiency. You don’t get to time your tax exposure with mutual funds, as they will send you capital gain distributions. ETFs, however, only create a tax liability when sold.
More transparency. ETFs usually provide their holdings daily, though this is changing with active ETFs and new regulations. More transparency may or may not be good, depending on your perspective. As an investor, you might want to know what you own on a daily basis. But, you also don’t want your manager to give up her edge by telling the world what they are up to. Some positions take time to build and publishing daily positions could allow others to move the price before a position is entered or exited.
Ability to short. ETFs trade on exchanges, like a stock, and can be shorted.
The ability to trade intra-day and short may or may not be a good thing for the average investor, depending on how much we think they should be engaged in this type of trading. Hedge funds use ETFs as a way to make more sophisticated long/short bets and hedge other exposures in their portfolio.
3.2.2.2 Wide Variety of ETFs
ETFs started off as passive ways to invest in market indices. They do much more than that now. We’ll discuss this new range of thematic and/or active ETFs, like ARK, in Chapter 4. You can read more about leveraged ETFs here. Basically, don’t hold them for more than a day and only if you really know what you’re trying to do.
3.3 Hedge Funds
“Hedge funds are investment pools that are relatively unconstrained in what they do. They are relatively unregulated (for now), charge very high fees, will not necessarily give you your money back when you want it, and will generally not tell you what they do. They are supposed to make money all the time, and when they fail at this, their investors redeem and go to someone else who has recently been making money. Every three or four years they deliver a one-in-a-hundred year flood. They are generally run for rich people in Geneva, Switzerland, by rich people in Greenwich, Connecticut. – Cliff Asness (AQR)”
Hedge funds are a legal structure. They are not an asset class or a type of investment. In this sense, they are like mutual funds or ETFs. Being a mutual fund or ETF tells you next to nothing about the underlying risk and return characteristics of the strategy. Hedge funds can be very high risk. They can be low risk. They can be opaque or reasonably transperant. It all just depends.
What are the defining characteristics of their legal structure? Hedge funds are exempt from the 40-Act. They are allowed to do to more complex strategies (but they don’t have to!) in return for less regulation. These strategies might include the use of leverage, shorting (hence, the “hedge” in hedge fund), or derivatives. Their compensation contracts typically include a management fee (e.g. 1% of assets per year), as well as an performance fee (15% of profits above a certain hurdle rate). They may also have a high water mark in their compensation contract, where the fund only gets the performance fee if the fund is above their peak value. This last feature ensures that the manager doesn’t get paid “twice” if they lose money and then go up again.
There’s limited disclosure, in that they do not have to file much with the SEC. Larger hedge funds (>$100mm in AUM) do have to file Form 13F, which details their quarter-end long positions on U.S. exchange traded stocks. You can find these on the SEC Edgar page, on Factset, and on our Bloomberg terminals.
They are also not allowed to raise money in the same way that mutual funds do. They are traditionally restricted in how they can advertise, though the JOBS Act changed part of that. Still, you don’t see hedge fund advertisements on TV or YouTube. Finally, hedge fund investors must be [accredited], as defined by the SEC. This is because these are private market investments, not public markets, like mutual funds or ETFs. The SEC says that they won’t regulate private markets as much, but that investors must meet a certain criteria of wealth, income, and/or knowledge.
An investor in a hedge fund invests in a feeder fund, whose sole purpose in life is to invest in the master fund, where the actual trades take place. This is called the master-feeder structure. U.S. taxable investors prefer a feeder fund that is registered in the United States, while foreign investors and tax-exempt U.S. investors prefer an offshore feeder fund. The master fund is typically organized as a partnership, where the feeder funds are the limited partners, and the general partner is a company owned by the management company. This is like a private equity partnership, with the LPs as investors and GPs as the fund managers.
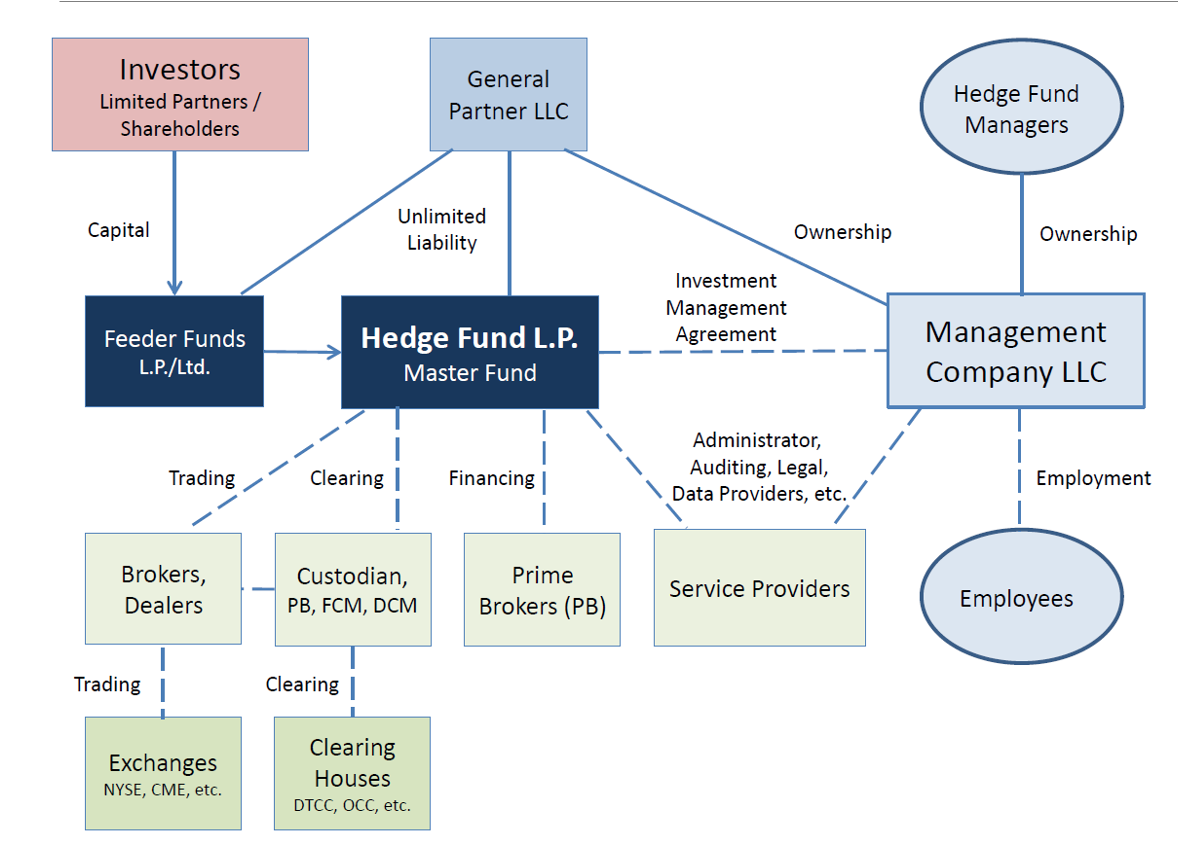
Hedge funds can only have a limited number of investors, or limited partners. And, the hedge fund gets to choose them! This is very different from the mutual fund or ETF world. Hedge fund investing is an example of a two-sided market, where both parties have to agree. Investors also have to make the minumum investment, usually at least $1mm. Most institutional-size hedge funds are only going to accept investments larger than that (e.g. $5 million or more).
Investors in hedge funds also have limited access to their capital after making their investment. They have lockups, so that you can’t withdraw your money for perhaps a year after making your initial investment. They have withdrawal notices, where you have to tell the mananger three months in advance that you want your money back. And they have redemption periods where you can only get your money back at the end of the quarter. Many of these restrictions are related to the underlying liquidity of the investment strategy, where if the manager owns difficult-to-sell securities, then you don’t want to have your investors pulling their money, or even adding capital, monthly. In fact, there is evidence that managers with more stable capital, money that can’t be withdrawn, are able to take advantage of more anomalies and earn higher returns.
3.3.1 Hedge Fund Styles
The original goal of a hedge fund, going back to the “Jones Model” of A. W. Jones in 1949, was to make money regardless of the direction of the market. This would come from being long some securities, while being short others. It it still true that, on average, hedge fund managers have lower betas than traditional mutual funds, but hedge funds are by no means zero beta (i.e. market neutral) strategies. They can follow all kinds of strategies, each with a different set of risk and return profiles.
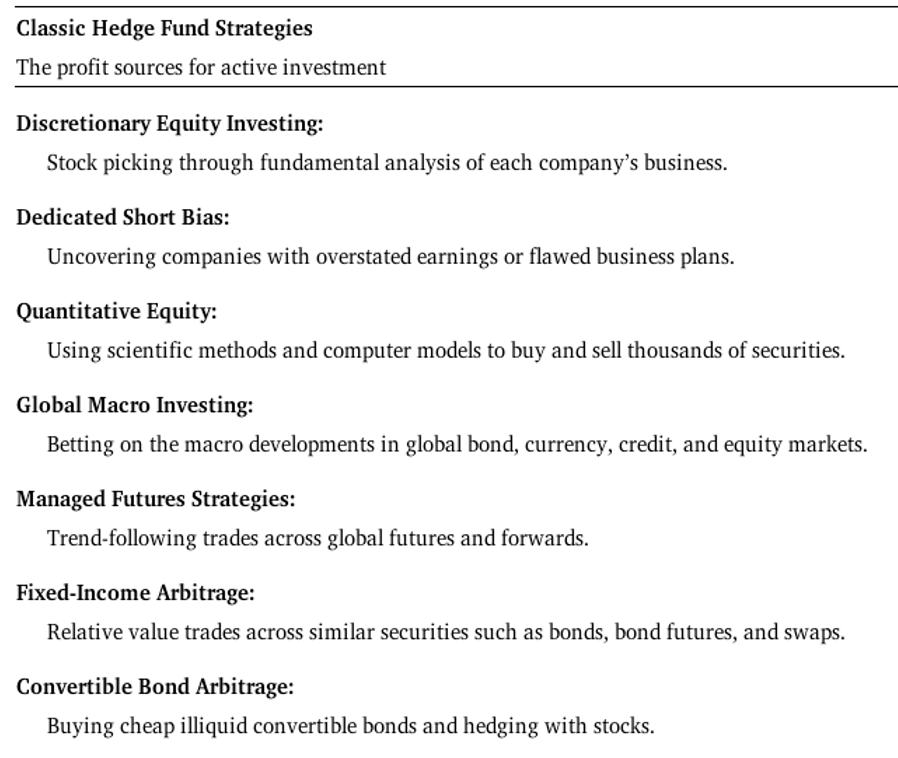
Figure 3.8: Hedge funds engage in a number of styles, which each have a source of risk and return. Hopefully, the managers can add alpha on top of the risk premiums that they are earning. Source: Pedersen (2015)
These strategies are summarized in Figure 3.8. Some hedge funds just trade equities. Some are global, some are U.S.-focused, etc. Some use options and over derivatives. Many don’t. Some focus just on fixed income. Some own privately held firms and look like a little like venture capital. Some are activists and get involved with the firms they are invested in. Some are extremely quantitative and hire people physics and computer science backgrounds. Others invest like Warren Buffett and spend their time reading 10Ks. Some are made of up economists, as well as people with a computer science background. Some are academics who decided to trade options and make money when the market becomes very volatile. There really is no one single hedge fund type.
Discretionary, or long/short equity, managers do exactly what the description sounds like. They will generally have market betas around 0.5, though that can certainly vary. For example, these managers might have what is called gross exposure of 150%, with net long exposure of 100% and net short exposure of 50%. They are usually picking stocks using the industry analysis and valuation techniques that you’ve seen in other classes. They might also use technical trading signals, such as momentum and reversals. There’s evidence that these types of hedge funds provide liquidity to markets, in that they buy stocks when others are selling, perhaps because the sellers are forced to do so because of their own investor withdrawals. If you’re a trader, you like buying from forced sellers. However, this strategy is short volatility (see below), so it will lose a lot, some of the time. Finally, some of these funds are getting more involved in venture capital, as the line between hedge funds and private equity gets blurred.
Dedicated short sellers are a small group of funds that are net short, betting on specific firms that they think will go down in price. They have an uphill battle, since markets go up most of the time. They aren’t trying to time the market or provide insurance, though. Instead, I think about short-sellers as looking for fraud and other deeply troubled companies, not just overvalued securities. Thought not a hedge fund, this report on the SPAC Clover is an example of this type of work.
Quantitative equity funds are our factor funds, or any fund type of automates their process. They can be long-term holders of securities, or trade frequently as signals change. The idea is to have a more “scientific” process that allows you to be more systematic in your security selection. They usually hold hundreds, if not thousands, of securities, making small bets on each, rather than the concentrated portfolios that you can see in discretionary equity managers. Create your own fund here and then get some ideas for a fund name here.
Global macro covers all sorts of securities, though the funds are generally trying to find trends in broad market indices and currencies. I’d classify many of the strategies run by Bridgewater Associates as macro. One of the largest hedge funds in the world, they have struggled lately. Managed futures or commodity trading advisors (CTAs) are also trend-following strategies that use very liquid securities, such as futures, to implement their strategies.
Finally, there are the relative value or arbitrage strategies. These managers are often combining securities across markets, such as equities, fixed income, and options, in order to take advantage of mispricings. For example, a manager might decide that a particular piece of debt issued by a firm is mispriced relative to another piece of debt or the firm’s equity. Fixed income arbitrage funds might decide that a particular Treasury issue is too cheap relative to a very similar Treasury issue. You don’t make that much money doing these types of trade, since mispricings in liquid markets are small, so fixed income arb funds use leverage to increase their returns. Duarte et al. (2007) is a nice summary of the sources of returns for many fixed income arbitrage strategies. Convertible bond arbitrage involves buying a firm’s convertible debt, which has an embedded call option that can be underpriced, and then shorting the equity to hedge this exposure. Merger arbitrage means going long the target firm and short the acquiring firm and making money as the target firm’s price approaches the price set by the acquisition. Note that this is a bet on the merger being completed and will lose money if the merger doesn’t go through. In fact, all of these strategies are exposed to extreme market events.
3.3.2 Hedge Fund Performance
Even with all of these styles, we can still think of hedge funds as bundles of risk factors. This means that we can assess their performance and look for manager skill (i.e. alpha, positive risk-adjusted returns) using the same approach we did for mutual funds and ETFs.
Thousands of studies have been done about hedge funds and their returns. Recent work by Bollen et al. (2020) might best summarize where we stand. To quote from their introduction:
An aggregate equally weighted hedge fund index features cumulative return of 225% over the period 1997 through 2007, far outpacing an equally weighted stock and bond portfolio, which generates a cumulative return of 125%. In contrast, the hedge fund portfolio earns a cumulative return of only 25% from 2008 through 2016, whereas the stock and bond portfolio returns 70% despite the large drawdown in equity markets during the financial crisis. Analyses of the cross-sectional distribution of individual hedge funds also indicate a marked decline in performance over time. The percentage of funds with positive and significant seven- factor alpha, for example, drops from about 20% to 10% over the sample, while the percentage with significantly negative alpha increases from 5% to, at times, about 20%. In sum, we confirm reports that hedge fund performance has weakened considerably over the past decade.
Figure 3.9: Yes, Jim Simons and Rennaissance Technology has (had?) incredible alpha. They will not take our money and are the exception that proves the rule – real, true, scalable alpha is rare.
So, the average hedge fund this past decade has underperformed. This fits with the general narrative and disappointment you see among institutional investors (i.e. hedge fund clients). The authors also look at whether or not you can select hedge funds that will outperform. After all, we don’t want the average funds. Further, they note that the Berk and Green (2004) framework that we’ve discussed may not hold in the hedge fund world. A model by Glode and Green (2011) supports the idea that there should be performance persistence in the hedge fund world, as initial hedge fund investors share more in the trading profits. Bollen et al. (2020) use a number of different predictors that have shown used in previous work to select for funds that perform better in the future in order to see if they can select hedge fund portfolios that improve the Sharpe ratio of the standard 60/40 stock/bond portfolio. They write:
Over the full sample, seven of the predictors generate a significant increase in the multi-asset class portfolio’s Sharpe ratio relative to that of the stock/bond portfolio. The top three are the aforementioned variations of alpha. In all cases, the improvement in Sharpe ratio is achieved by substantially reducing the volatility of the overall portfolio. Consequently, these seven predictors also significantly improve the utility achieved by a risk-averse investor when risk aversion is set sufficiently high. When we repeat the analysis over the two sub-periods, however, the improvement in Sharpe ratio is only present in the 1997 – 2007 sub-period. In the 2008 – 2016 sub-period, the hedge fund allocation generally reduces volatility but lowers average return as well, leaving the Sharpe ratio unchanged. This result indicates that an overall deterioration in hedge fund performance cannot be overcome by using the predictors.
Again, in the past decade, hedge funds haven’t helped the typical institutional portfolio that much. Now, might the future be different? We’ve been in an environment of good market returns with a few market leaders, such as the FAANG stocks. Correlations among stocks is higher, perhaps making stock picking more difficult. Maybe hedge funds and their ability to select winners and losers will be more useful over the next decade? The Bollen et al. (2020) article suggests that this might be the case.
](images/02-hf-perf.png)
Figure 3.10: Hedge fund performance was much better prior to 2008. The past decade or so has been tough. Source: Bollen et al. (2020)
I don’t know. Stock picking has always been difficult! Most stocks are losers and 4% of stocks explain the entire return of the market. It is only in the aggregate that the equity risk premium arises. And, if the market is going up and it is obvious it did so because of “The Fed” or some other excuse, then buy the stocks that will benefit the most. I’m not very sympathetic to arguments that rely on something being obvious and yet you can’t make money off of it. I wouldn’t be typing this right now if it were “obvious” that the market would see unprecendented gains after 2008 – 2009, led by firms, some with little to no profits, that were on their way to becoming quasi-monopolies in winner-take-all style industries with massive network effects and impregnable economic moats. It’s the hedge fund’s job to figure this stuff out and buy AMZN and AAPL in 2008.
](images/02-hf-alpha.png)
Figure 3.11: Fewer hedge funds with positive alpha and more with negative alpha. Source: Bollen et al. (2020)
Some of the same authors discuss the overall size and performance of the hedge fund industry using different and, perhaps, better data. It turns out that it is tough to know how large hedge funds are or even how many there are. They just don’t have the same reporting requirements as 40-Act funds, so they don’t have to tell regulators their size or performance. Almost everyone studying hedge fund returns uses self-reported data that the hedge funds have chosen to disclose to third-party vendors. You can see why this might be a problem – maybe the better funds, on average, choose to advertise their returns this way in the first place!
Recent regulatory changes from the Dodd-Frank Act, however, now have large hedge funds reporting their performance and other information to the SEC via Form PF. These reports, though, are confidential and used to assess systematic risk in the financial system that might cause something like the 2008 – 2009 crisis again. But, Barth et al.(2020) have access to this data and show that the hedge fund industry is perhaps 40% larger than previously thought and that many good performing hedge funds have not been reporting their returns to commercial databases that the general public can use, at least during the early part of the last decade. This means that more recent studies of hedge fund performance might actually be missing the good performing funds.
During the last decade, the hedge fund world has become more institutional, as larger funds attract flows and the risk and return expectations dropped. Hedge funds are now more professional, with client services and large offices, instead of two people with a Bloomberg terminal. Hedge funds are generally pitched now as diversifiers in the portfolio, as access to factors that you can’t get in a mutual fund or ETF, rather than a source of dramatic outperformance. However, hedge fund returns are still positively correlated with overall market returns and volatility, as shown in Figure 3.12. This indicates that sophisticated hedge fund strategies still have big exposures, on average, to the basic risk factors that we’ve discussed. I will note the negative correlation between macro fund returns and market volatility. These types of trend-following, often long-volatility hedge funds usually go into a portfolio with the hope of providing some downside protection.
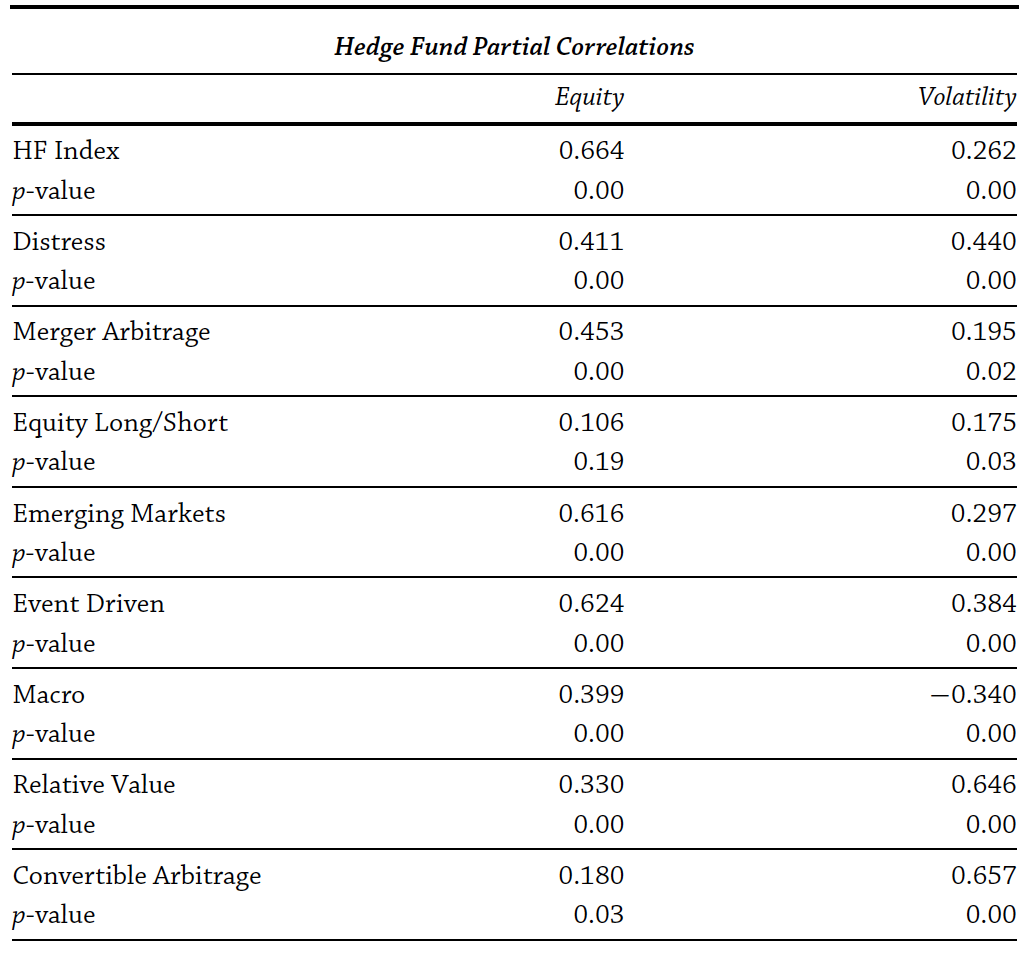
Figure 3.12: Hedge fund strategies have positive correlations with major risk factors. Source: Ang (2014)
Many hedge funds also have a great deal of exposure to illiquidity risk. Earlier work by Sadka (2010) finds that hedge funds that are exposure to illiquidity risk outperform. This makes sense – funds need to be compensated for holding securities that are difficult to sell during a market crisis. Hedge funds structure their contracts with lockups and withdrawal restrictions, as discussed above, in order to match their investor liquidity to their investment liquidity. During the financial crisis of 2008 – 2009, many hedge fund investors wanted to withdraw their money at the same time, creating what are called fire sales that drive the price of assets down even more. Many hedge funds used additional restrictions on their investors to keep them from getting their money back. Most hedge fund contracts contain a clause that allows them to lock-up their investors for an indefinite period of time, though this obviously comes at a reputational cost.
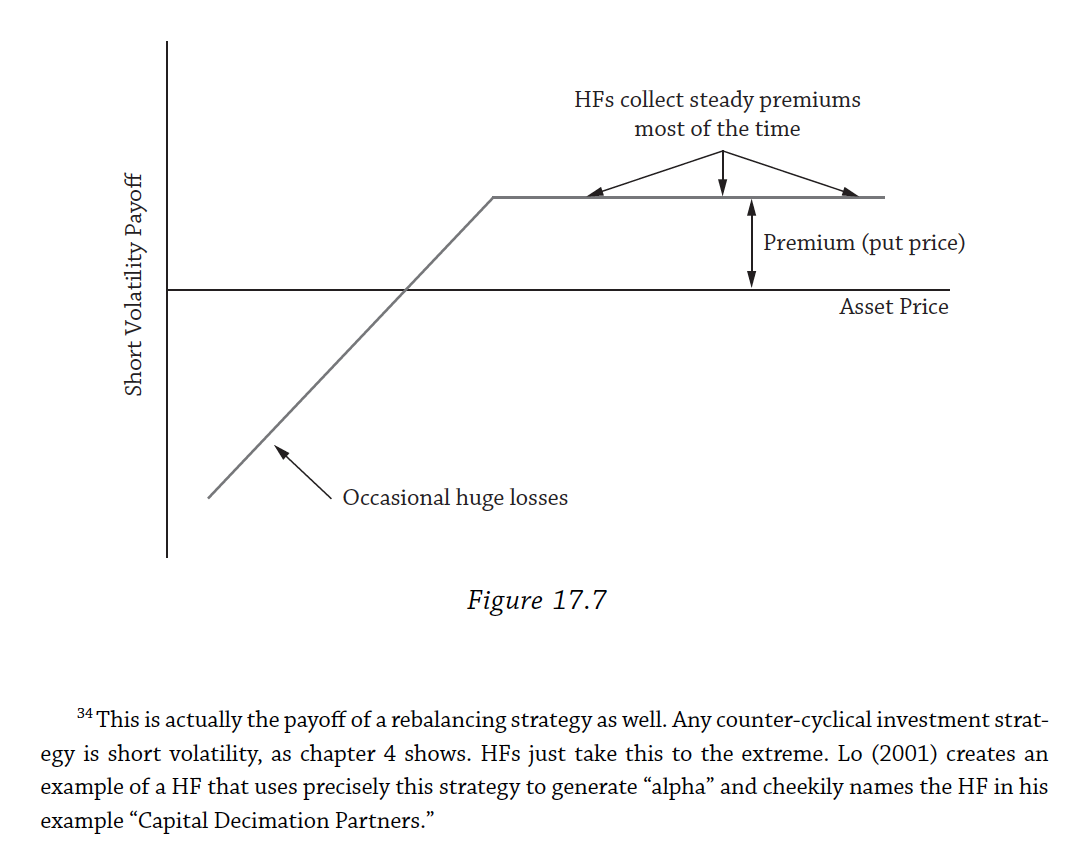
Figure 3.13: A lot of hedge fund strategies look like selling put options, or selling insurance. Source: Ang (2014)
Many hedge fund strategies are also short volatility. What can look like alpha is actually a strategy that makes a steady return during normal market conditions and then loses a lot under other circumstances. Figure 3.13 shows this type of strategy graphically – you should recognize the shape as being short a put option. The circumstances surrounding the losses don’t even have to be a general market downturn, such as the Quant Quake of 2007, where many crowded hedge fund trades all went down at the same time.
Because of all of these different risk factors that hedge funds might be exposed to, we don’t typically only use the Fama-French factors to assess performance. The model developed by Fung and Hsieh (2004) is still used to separate standard risk taking, alternative risks, and alphas in hedge funds returns. In this simple, regression-based framework, you essentially do the same thing that we saw with the Fama-French factors. There are much more sophisticated risk decomposition products out there, such as this holdings-based on by MSCI Barra. These platforms would take the hedge fund holdings, rather than just the past returns, and decompose the risks the fund manager has into different premiums, industry sectors, currencies, etc.
3.4 Role of FinTech
I am going with a broad definition of FinTech that essentially means “things that didn’t really exist a decade ago and might have an app.” And, in order to keep these notes to a reasonable length, I will just discuss a few examples. We could spend an entire semester on blockchain, bitcoin, and other emerging technologies that may or may not end up being useful. I will also keep the theme from above going – investment products that simplify and reduce costs seem important to me. Other things seem like distractions at best.
Robo-advisers are the most important example of FinTech for our purposes. These products essentially automate the investment process for individuals. You answer a similar set of risk tolerance questions to what a financial adviser would ask you and then the software puts you into the appropriate set of low-cost ETFs, or similar product.
Everyone has one of these now. There are relative newcomers, like Wealthfront and Betterment. Vanguard and Schwab have their own too. To me, these products show us how investing basics like putting together a low cost retirement portfolio, are actually pretty “easy.”11 And VC funding is going to savings apps geared towards younger savers now.
Better technology and lower trading costs is also allowing advisers to do something called direct indexing, or buying the individual securities that make up the index, rather than an index fund. Many of the robo-advisers do this and there is a tax advantage if you can do it at scale. Other platforms are doing custom indexing, which I find interesting. I like the idea that the broad index is your default and then you can deviate from that if you want. This is how I think about investing.
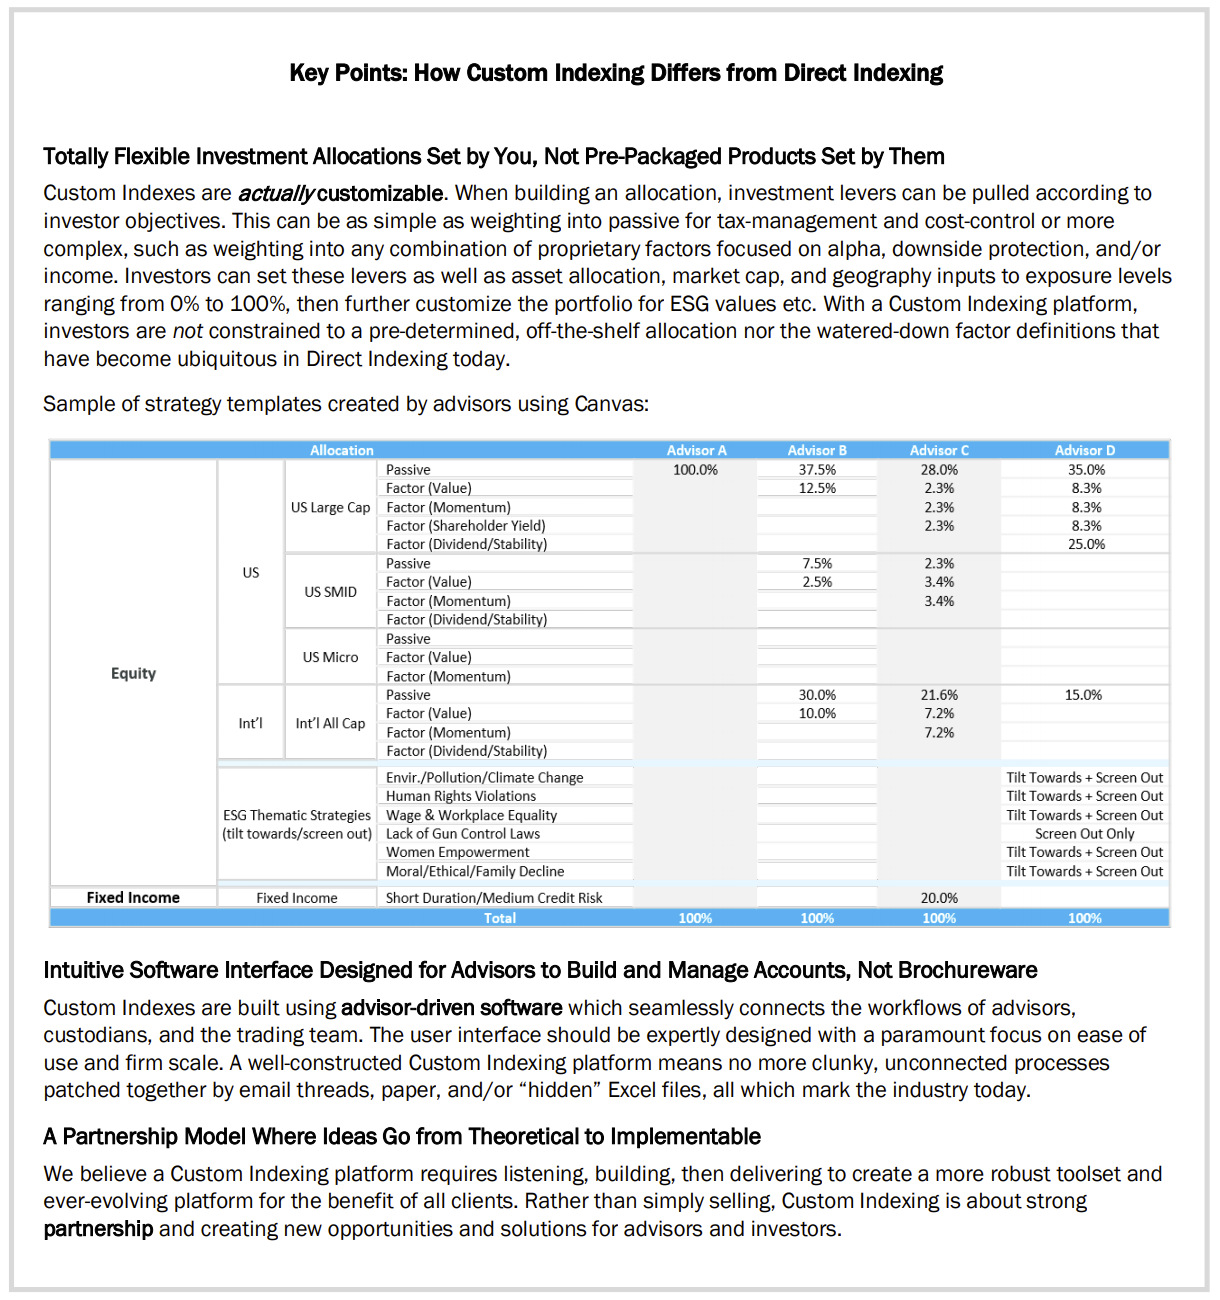
Figure 3.14: I am intrigued by custom index products that let you start by replicating the broad market and then tilting towards factor exposures or your ESG preferences, if you can do it for a low enough cost. I do worry about every advisor trying to tweak their factor exposures. Source: OSAM
There are plenty of other products too, many related to the JOBS Act that allowed the sale of private securities to many more individuals. This has lead to apps that let you sell your startup and apps that let you supposedly invest like a hedge fund12 and other apps that supposedly let you invest like a hedge fund13. You can buy real estate, buy farmland, buy and sell fractional art and other collectibles, and invest in firms founded by alumni of you school. Products like these seem like fun, by I’m skeptical that they will matter that much for the average saver. I worry about the fees and liquidity of some and am very skeptical of the general premise of others.14 I’m much more interested in products that lower costs and remove frictions for investing basics like saving from every paycheck and then putting that money into low-cost index funds that the app would then make you put in a dozen different passwords to even check the value of your accounts. Further, many countries don’t have the easy access to low-cost funds that we have here. Creating services for those customers, rather than just another game-like trading platform for individual stocks, seems useful.
Side-eyes to venture capital and private equity. We’ll discuss their strategies, performance, and structure in Chapter 6.↩︎
The management fee is fairly cheap 45 bps, but shorting is costly, which raises the overall fees.↩︎
Note that this is where the active vs. passive distinction gets tricky. Couldn’t I also put together a roughly equally-weighted ETF of space-related firms, charge you 10 bps, and get basically the same risk and return profile? To me, this is a cheap, but active strategy, since the ETF would look nothing like the broader stock market. However, the returns might still be driven by just a few risk premiums and perhaps a broad anomaly like “people underestimate the importance of space-related firms.” Anyway, if you think about this stuff to much, you can just end up confusing yourself!↩︎
If you get the basics right, don’t buy too large a house, don’t lease a bunch of cars, do what you can to increase your income, save in tax advantaged accounts, and use low-cost funds in these accounts, then you can go out and enjoy that latte. It won’t break your budget.↩︎
Nope.↩︎
That’s another nope.↩︎
Why do these VC and real estate investments need my money? Institutional investors are sitting on piles of cash. Why did they pass these investments up?↩︎