1 Introduction
Structural equation modeling (SEM) is a linear model framework, it is not a single method/model, but rather a collection of various statistical techniques. But essentially, SEM is predicated on linear regression.
1.1 Structure
SEM studies the structure between variables, observed ones, latent ones, or both.
In social science, we usually investigate multiple variables simultaneously. It quickly becomes unmanageable to model them all at once using conventional regression. More importantly, one of the core tasks of social science research is to unveil the relationship among variables. This can be breakdown into two steps:
- find variables that are correlated, this is done by investigating the correlation matrix of target variables,
We want these variables to correlate with each other, because inference about variables mutually independent with each other makes no sense. In this regard, the input of SEM is correlation matrix of variables.
- parse the correlation matrix, this is done by enunciate the correlation matrix in the form of a structure.
If correlated, we want to know why, why are these variables correlated? In other words, for two correlated variables \(A\) and \(B\), a significant correlation is just what we observed, but it is not informative enough, we do not know which variable is the cause. It could be either \(A\) caused \(B\) or \(B\) caused \(A\).
If we have 3 correlated variables \(A\), \(B\) and \(C\), we can specify the relationship as following
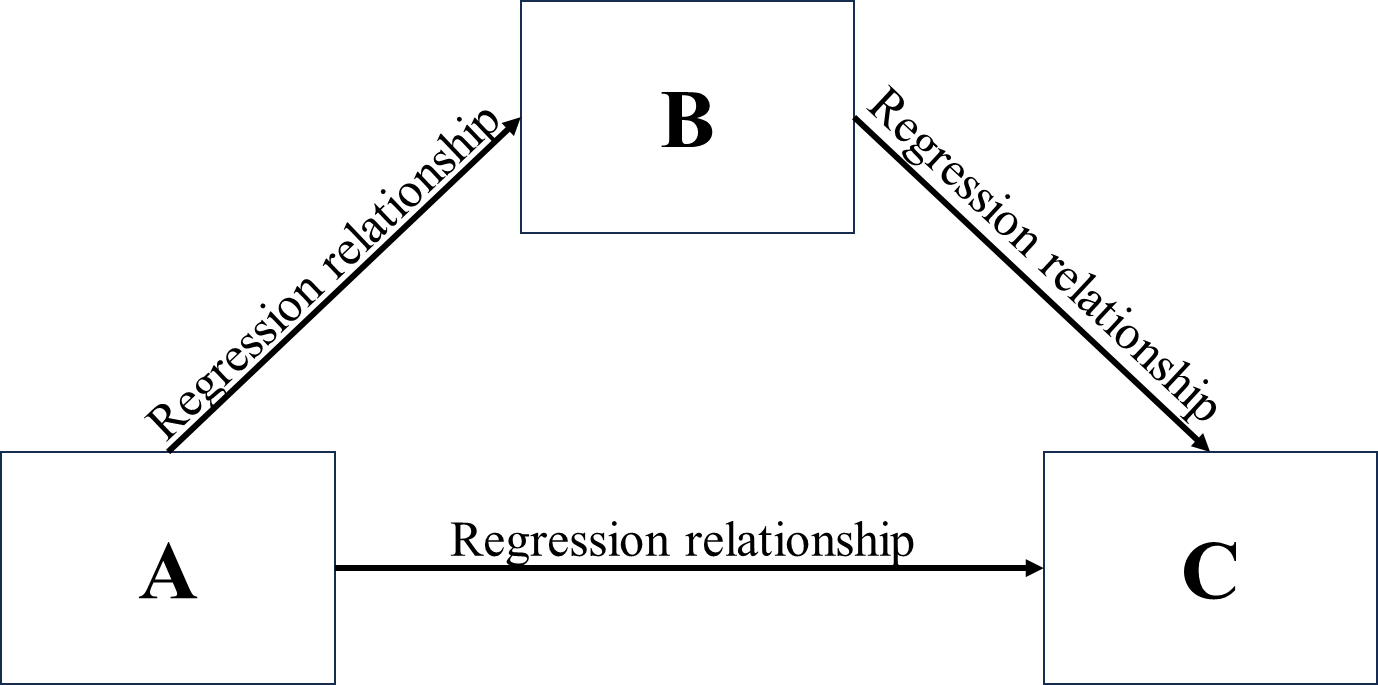
where we assume \(B\) is caused by \(A\) (regression relationship between \(A\) as independent variable and \(B\) as dependent variable), \(C\) is caused by both \(A\) and \(B\). In doing so, we have a meaningful structure that explains why these three variables are correlated with each other.
1.2 Equations
Suppose we have the above structure in mind, the next step is expressing it by a bunch of equations, or more specifically, regression equations with unknown parameters.
The regression equations of above structure are
\[\begin{align} B&=\beta_{01}+\beta_{11}A \\ C&=\beta_{02}+\beta_{12}A+\beta_{22}B. \end{align}\]
This set of equations is equivalent to the path diagram above. Usually, we treat these equations collectively as a model.
1.3 Modeling
The final question: can the structure we specified above explain why \(A\), \(B\) and \(C\) are correlated with each other? To answer that, we need to go through the modeling process, it usually contains 3 steps:
- collect data,
- fit specified model to data,
- evaluate model-data fit.
In general, if our model was theoretically well justified and fit the data well, we can conclude with caution that the hypothesized causational pattern between \(A\), \(B\) and \(C\) is supported by data, this structure can be use to explain the observed correlations among these 3 variables. But note that:
- a SEM model without theoretical root is only an nonsense mathematical model and can not be used for causal inference;
- even with theoretical justification, a good-fit SEM model is only a weak evidence of causality, more evidence is required, e.g. the results of randomized experiment involving intervention.
In summary, SEM is a process of testing whether the correlation among variables can be explained by a clear structure made of regression relationships.