5 Additional Analysis
This section delves into the processes of acquiring supplementary datasets from the World Bank and the World Health Organization for comprehensive analysis alongside the original dataset.
5.1 Searching Specific Dataset
5.2 Utilization Guidelines
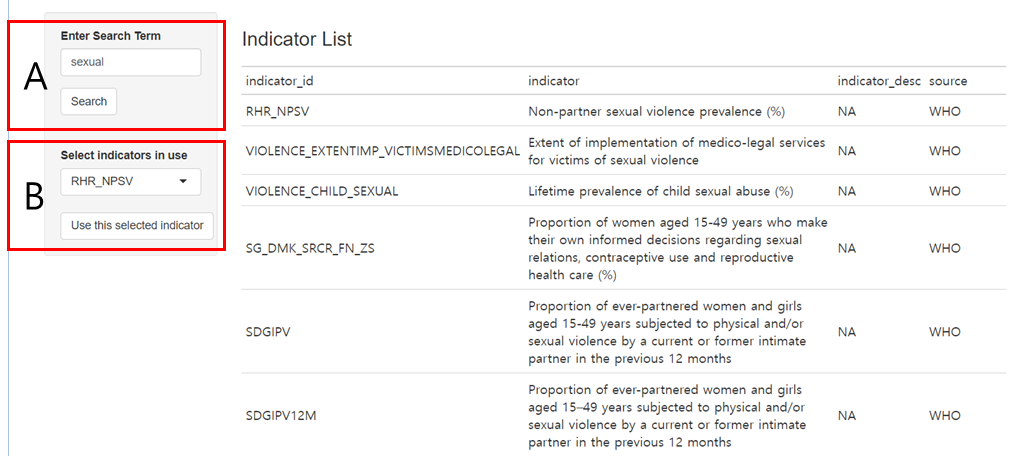
5.2.1 Inputting Search Terms (A)
Input relevant keywords in the ‘Search Term’ field. The search function sift through all indicators from the World Bank and WHO databases, returning a list that contains the specified term. For example, entering “sexual” prompts the application to locate and list indicators related to this term.
5.2.2 Indicator Selection and Usage (B)
After identifying the relevant indicator, select and confirm it using the ‘use this indicator’ button.

5.2.3 Data Statistics and Visualization
Indicator Summary Statistics:
n= Number of observationsn_country= Number of unique countriesmin_year= Earliest year in the databasemax_year= Most recent year in the database
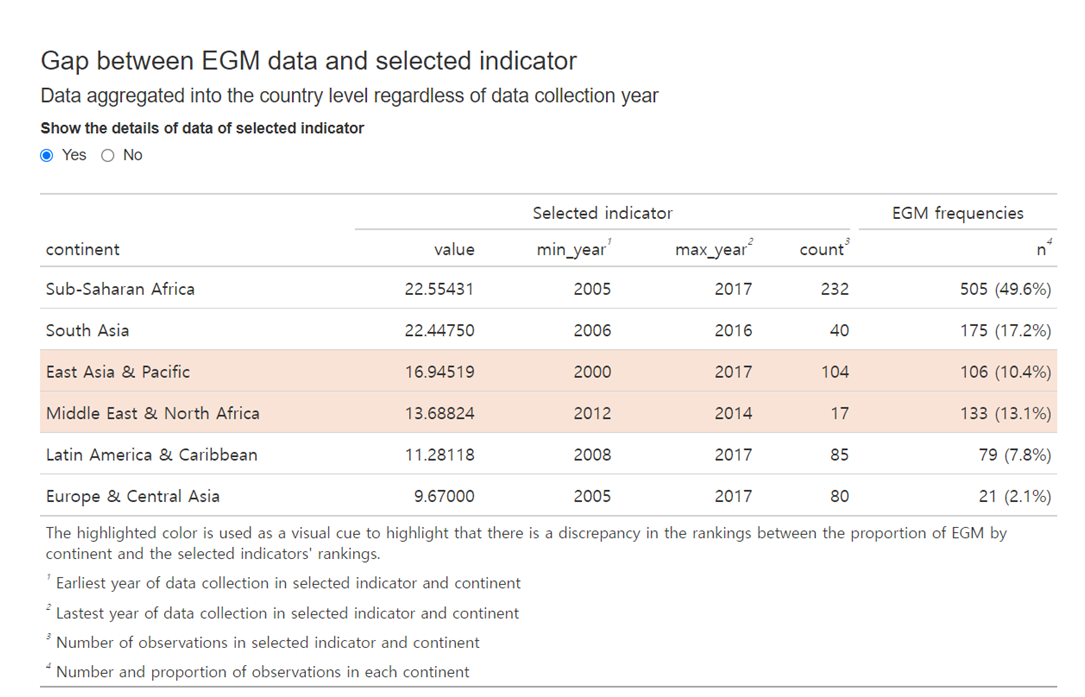
Gap between EGM data and selected indicator
This table reveals discrepancies between country-specific data frequencies and aggregated indicator values. Data is organized by frequency, highlighting disparities. For instance, the table may show frequency differences at the region
Selected id = SDGIPV
Selected indicator = Proportion of ever-partnered women and girls aged 15-49 years subjected to physical and/or sexual violence by a current or former intimate partner in the previous 12 months
Example project = Sexual and Reproductive Health and Rights Evidence Gap Map

This table aggregates observations and averages them according to World Bank regional classifications, allowing users to discern any mismatches between the indicator data and EGM frequencies.
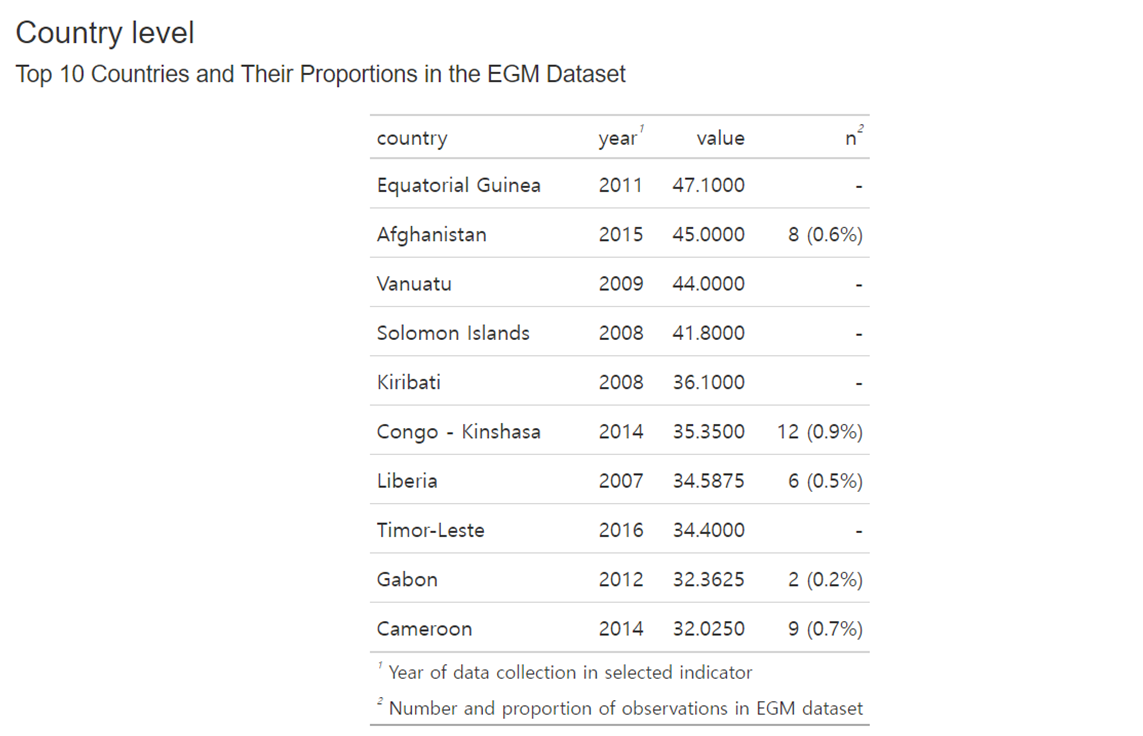
Top 10 countries and their proportion in EGM dataset
This table presents a list of the most frequently mentioned countries in the chosen EGM project, alongside their corresponding proportions.

5.3 Takeaways
Acquisition of International Datasets: Designed for retrieving datasets from global databases like the World Bank and WHO.
Gap Analysis: It offers tools for identifying and exploring potential discrepancies
Data Scope and Coverage: Due to differences in data coverage and observation across datasets, detailed examination is advised for a thorough analysis.