2 Checking Data Quality
Within this tab, you have the capability to examine data quality across three distinct dimensions:
Missing Values: Assess and identify any missing data within each category.
Outliers: Review inputs for potential anomalies, such as publication years that fall outside expected ranges.
Coding Consistency: Verify the alignment between pre-defined EGM codings and the codings actually used in the dataset.
2.1 Missing Values
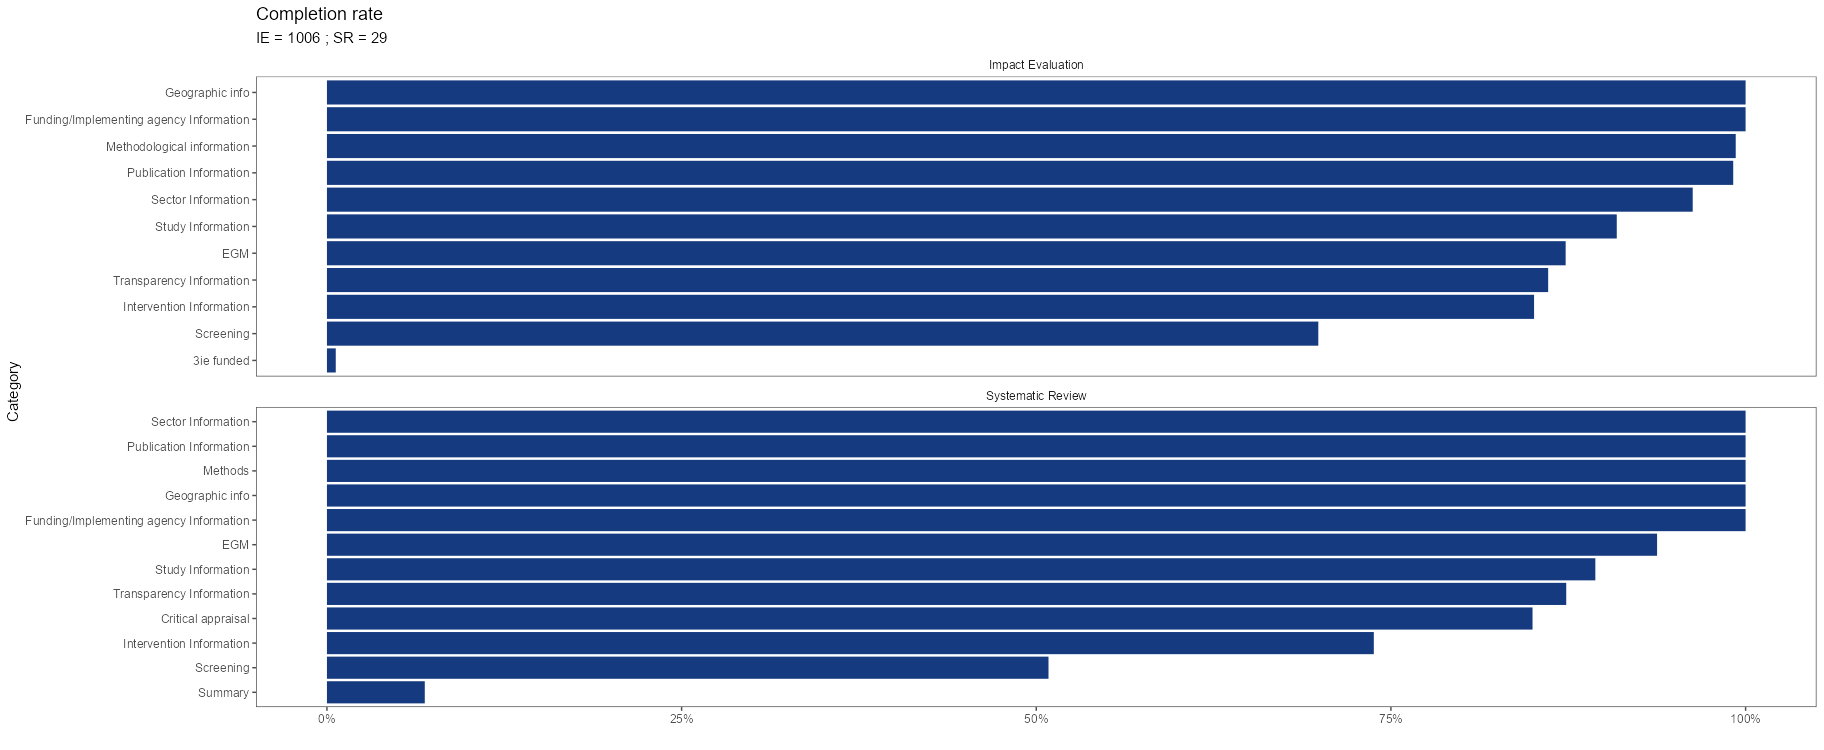
2.1.1 Overall Completion Rate
The initial plot provides a visual assessment of the completion rates for Impact Evaluations and Systematic Reviews. It breaks down the data by each input tab within the DEP portal and the EGM custom coding. A completion rate of 100% indicates there are no missing values in that section.
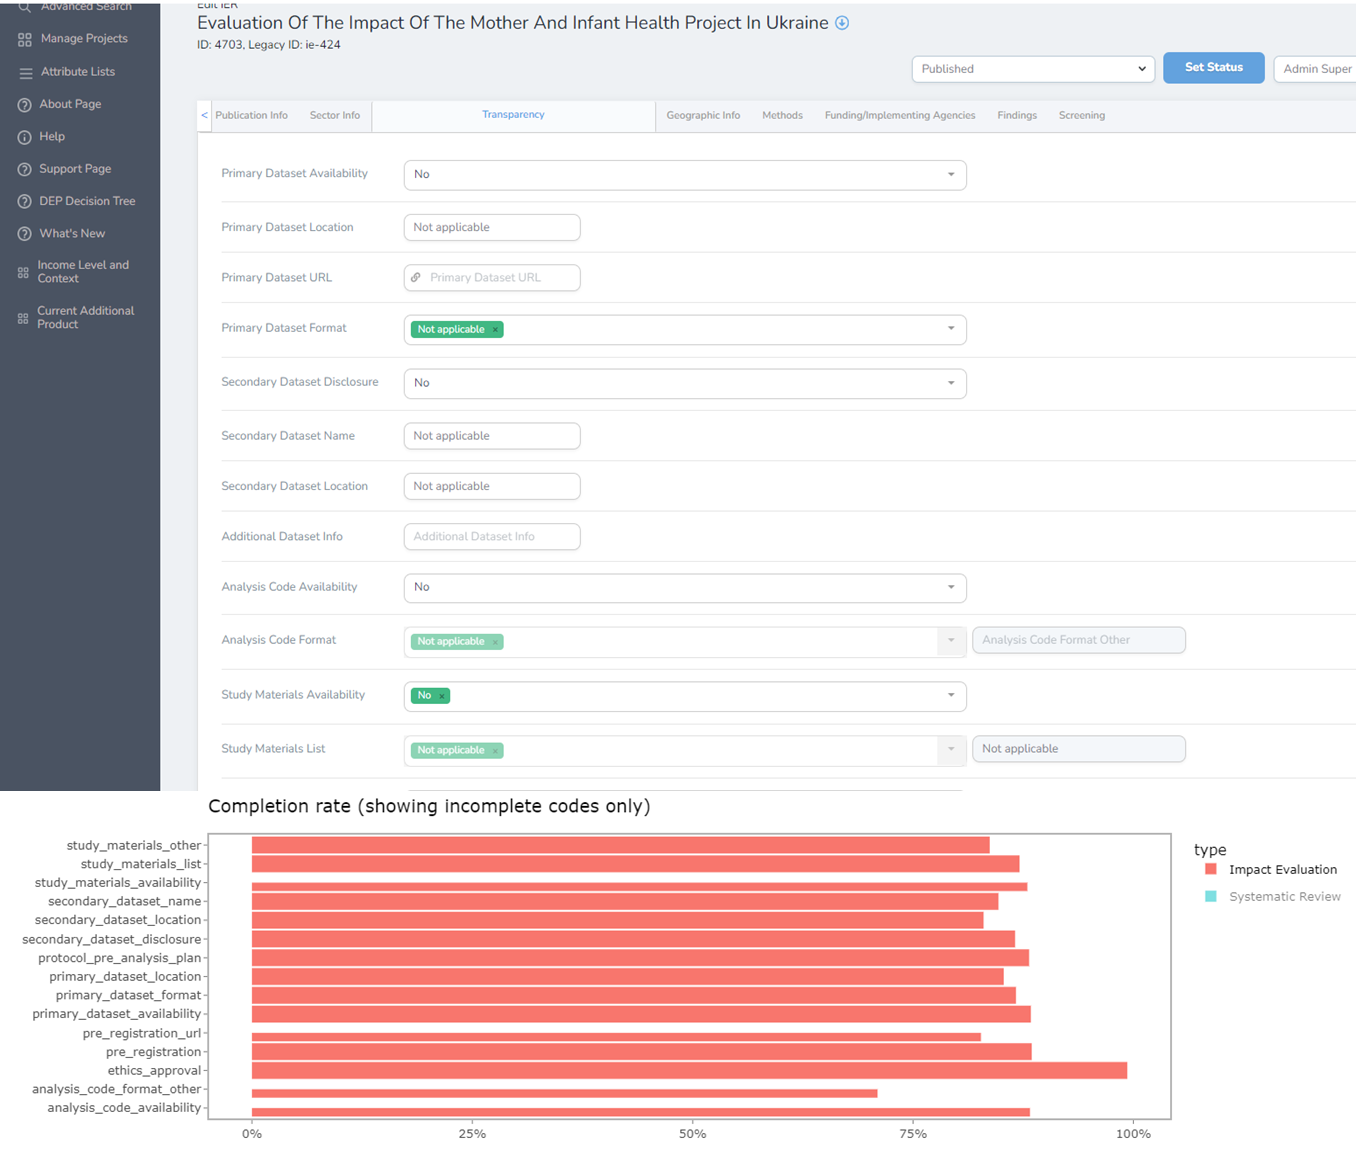
2.1.2 Completion Rate in Each Category
Dive deeper into the data at the individual input level. It’s important to note that certain tabs within the DEP require specific data fields to be completed. For example, the transparency information section encompasses over 10 distinct items, and the application displays the response rate for each of these items. By selecting a type, you can filter the visualization to highlight either Impact Evaluations or Systematic Reviews. Additionally, an accompanying table will list the study IDs that contain missing values for each scrutinized item.
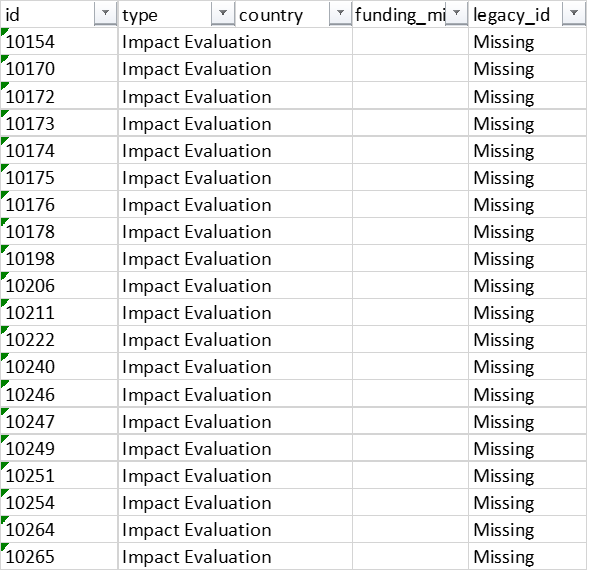
2.1.3 Missing Values Export
The application provides an option to download a comprehensive list of all missing values associated with each ID. In the downloaded document, cells labeled “Missing” indicate where data is absent, while empty cells signify areas where data input is complete.
2.2 Outlier
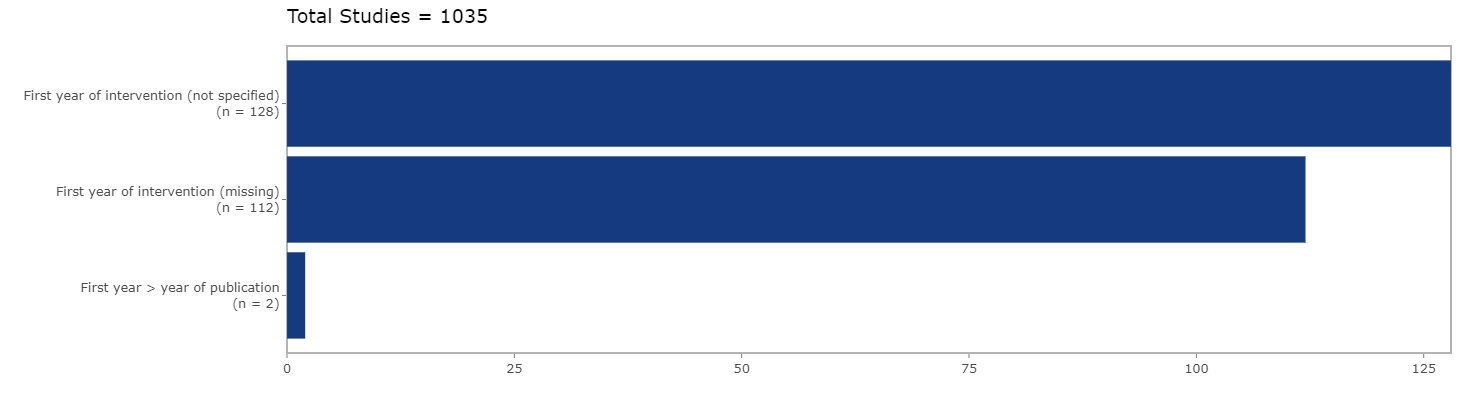
2.2.1 Publication Year vs. First Year of Intervention
The dataset should logically have the year of publication following the first year of intervention. Pay attention to the bar at the bottom, which indicates instances where the first year of intervention is erroneously recorded as occurring after the year of publication. Within this plot, hovering your mouse over individual bars will reveal the record IDs associated with these outliers.
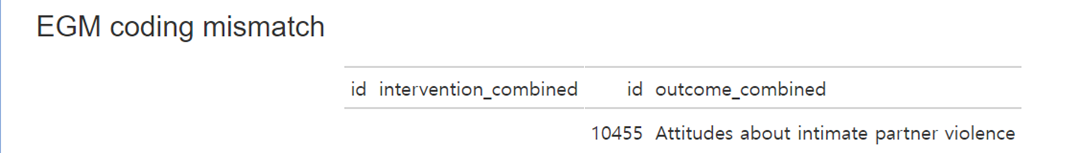
2.3 EGM coding mismatch
The application accommodates DEP and EGM standard codes within custom fields. However, mismatches may arise from the unintended use of DEP codes where EGM-specific ones are necessary. This section provides a mechanism to spot and rectify such inconsistencies. A table lists the IDs and their corresponding interventions or outcomes, making it easier to identify and amend any coding errors. A clear interface, free of results, indicates accurate coding without any discrepancies.
2.4 Takeaways
Assess missing values across categories.
Identify outliers, like incorrect publication years.
Ensure EGM coding consistency.
Utilize exports for detailed analysis correction.