Chapter 1 Introduction
How can we empower our colleagues to embrace Data Analytics? How can we enable our colleagues to solve their own Data Problems? Why is this an economically sensible approach? These are the key questions I want to answer in this thesis.
If you are short of time, my answer to “How” questions is “use the R Studio system as the enabling technology”. My answer to “Why” questions is “because its Mass Customisation, 3D printing for Data Projects”. If you do have time, in the following sections I hope to convince you of this!
Section 1
My thesis starts with a “show and tell” example.
I want us to solve an applied problem together using R Studio. I downloaded a data-set of 21,000 house sale transactions from Seattle in USA (the home of the Seahawks). I want us to develop an accurate prediction model for property sale price.
The data contains property sales prices for transactions between May 2014 and May 2015 in King County USA which includes Seattle. I downloaded it from the website Kaggle (2015). For each of the 21000 properties, we are given the sale price and variables describing the property (eg. number of bedrooms, size of living space,…).
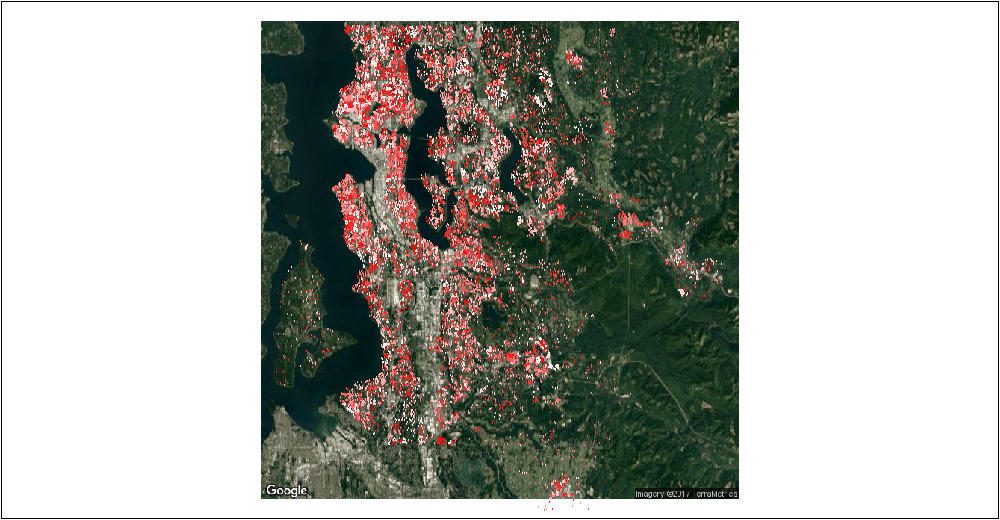
The location of the properties is plotted in Figure 1.1 below. I am happy to use a multiple linear regression model to predict house prices. I do not believe we would get a more accurate prediction model by linking response and explanatory variables with something more complicated!! Our key constraint is understanding the data!!

Figure 1.1: Here is the 21,000 properties in Seattle. The dots represent individual properties. Dark red properties are high value and light red properties are low value.
I start in Section 1.2 by using the Shiny package to build an app that allows interactive model fitting. This gives you a chance to fit your own model and engage with the problem and the data.
I then in Section 1.3 use the ggplot package to perform a wide range of data-visualisations on the original data-set and use these to guide model selection.
The original data-set was missing a large number of relevant data fields. In particular, for each property we know nothing about its neighbourhood. In Section 1.4 I use the spatial package in R to visualise an enriched data set and to guide further model selection. I do not give the technical details, but I used API calls from R Studio to the GoogleMaps and Zillow websites to obtain additional explanatory variables for each property.
To conclude in Section 1.5 this section I go back to basics. I take a very traditional statistical approach to model fitting. I make this look nice by using R Markdown styling and ggplot graphics, but I hope you find this bit boring! I hope that you prefer the interactive or visualisation approaches of preceding sections!!
Section 2
I believe R Studio is a 3-D printer for Business Analytics.
In Section 2.6 I start by presenting the key components of the R Studio system.
This 3-D printer is powerful because it enables the mass production of customised Analytics tools, so called “Mass Customisation”. Section 2.7 is an (optional) refresher on the theory of “Mass Customisation” as presented in Business School Literature.
I do not believe Microsoft software can compete with R Studio for Data Analytics. This final Section 2.7 is an (optional) case-study where I explain my position.
Section 3
This contains concluding remarks and a few appendices.
In [Section 3.10]{#RegressionRecap} I have summarised some key results of fitting Linear Regression Models. In [Section 3.11]{#ggplot2recap} I have provided an introduction to the ggplot package. In [Section 3.12]{#Reproducibility}, I have provided reproducibility information for my project.
(Regression Recap, ggplot recap, a primer on Reproducible Research.)
Happy Reading!
Ed.
References
Kaggle. 2015. “This Dataset Contains House Sale Prices for King County.” https://www.kaggle.com/harlfoxem/housesalesprediction.