Chapter 3 Visualising Data
R is known for its ease of producing data visualisations. For quickly producing a range of plots, the ggplot2 package is awesome. See Appendix on ggplot2 for a refresher on this package.
## LogSalePrice ~ (ConstructionYear + LivingSpace + NumberOfFloors +
##     SeattleFlag + RenovationYear + TotalArea + NumberOfBedrooms +
## NumberOfBathrooms + Condition + Grade) * FlatFlag| Model | DoF | RSS | DOF_Diff | SUmOfSq | FProb | |
|---|---|---|---|---|---|---|
| 1 | Fit1 | 21425.00 | 2018.00 | |||
| 2 | Fit2 | 21414.00 | 1999.00 | 11.00 | 18.41 | 0.00 |
Outliers
We can use visualisations to help identify outliers. For example, in Figures 3.1 we see that there exists a group of properties with very high values. We need to transform the reponse variable in order to achieve a satisfactory model fit. The results of a log transform are shown in 3.2.
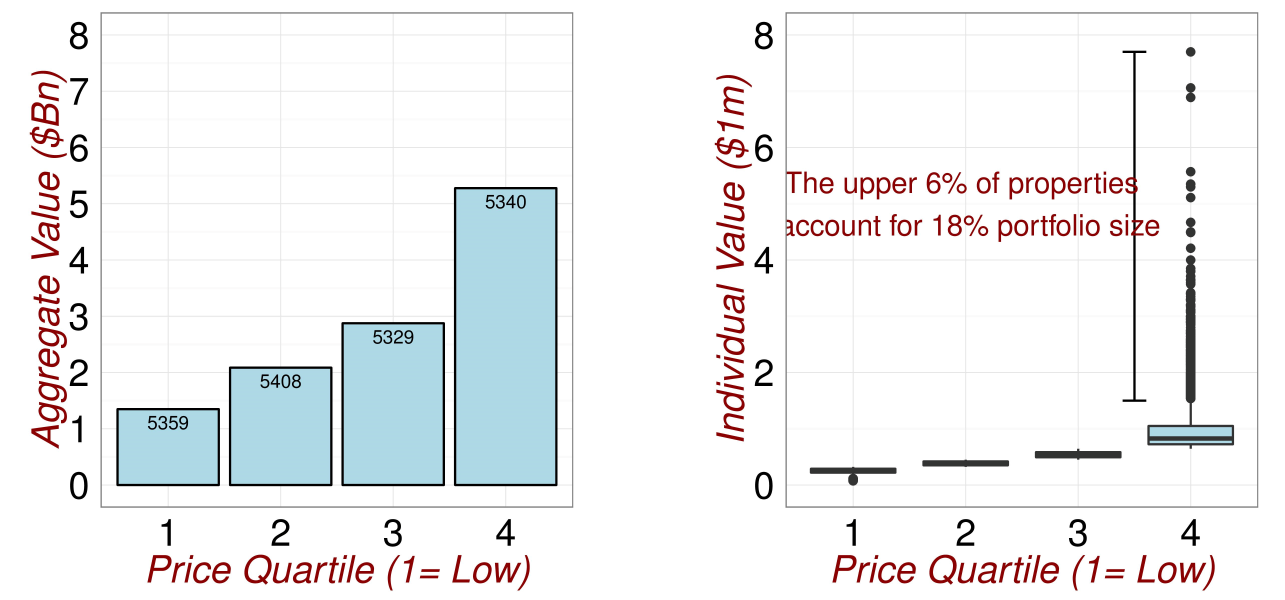
Figure 3.1: Checking for Outliers.
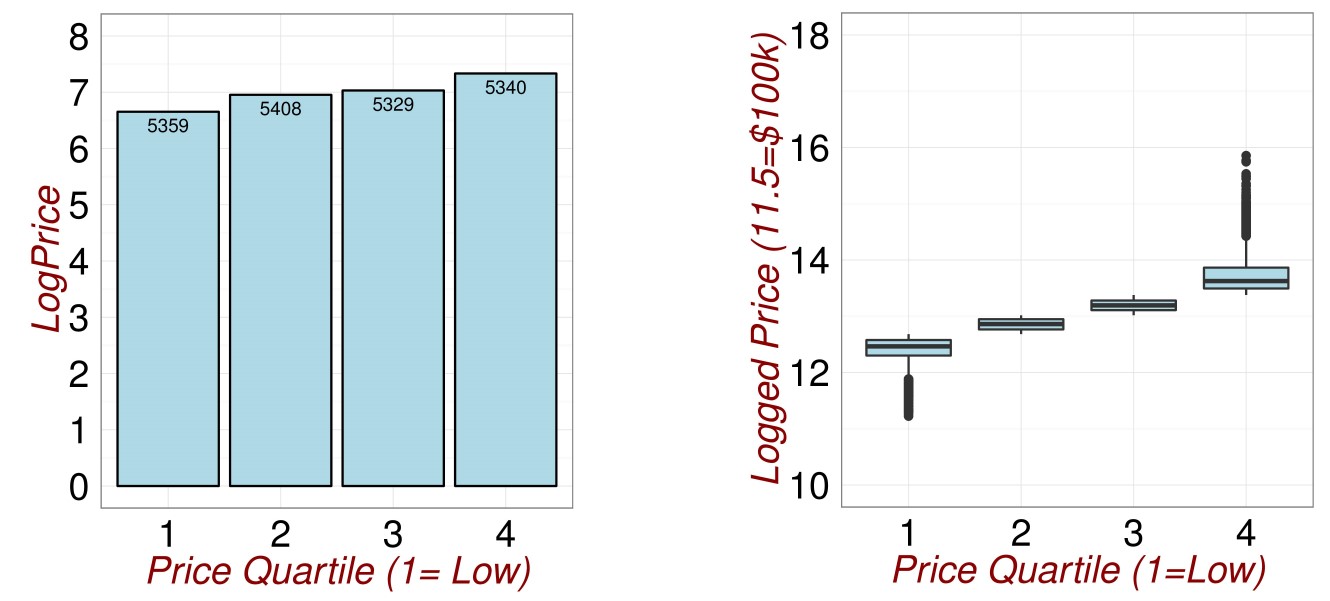
Figure 3.2: Checking for Outliers.
Covariates
Grids of plots are useful for understanding the different segments of the portfolio. For example in (fig:Outliers3), we examine the 21000 properties by (log) price quartile.The lowest price quartile has very low floor number which may indicate more appartments than condominiums. The highest price quartile has more properties with a View. This may indicate they are in superior locations.
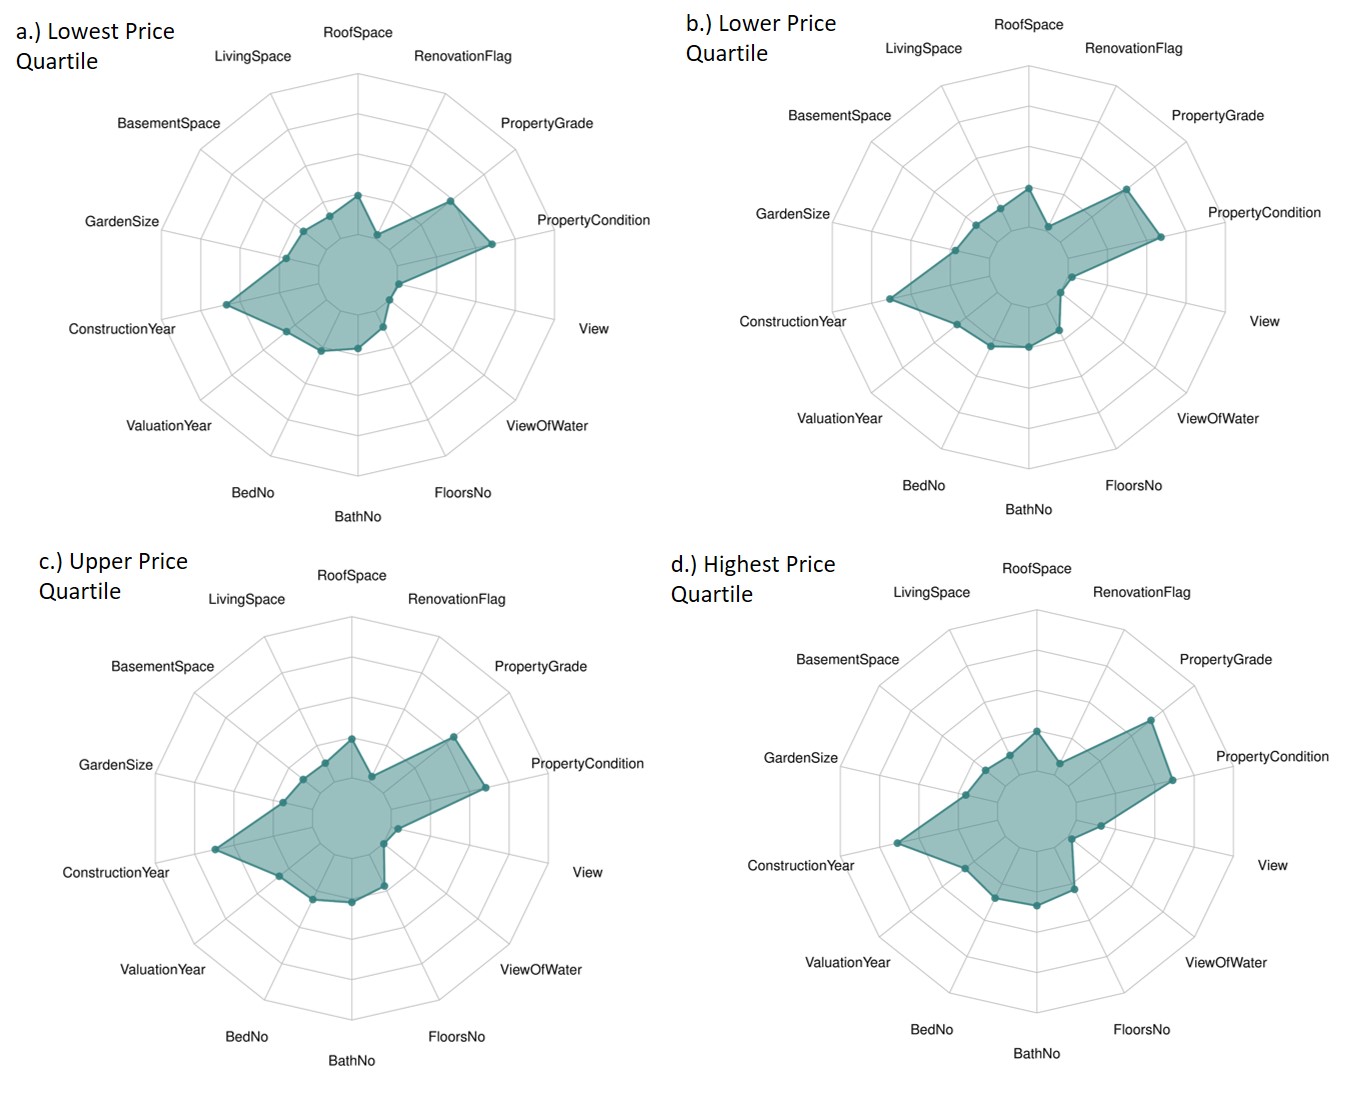
Figure 3.3: Checking for Outliers.
Visualisations
It is so easy to create plots in R that you can go wild. In figures (fig:DataExploration1) and (fig:DataExploration2), I do exactly this.
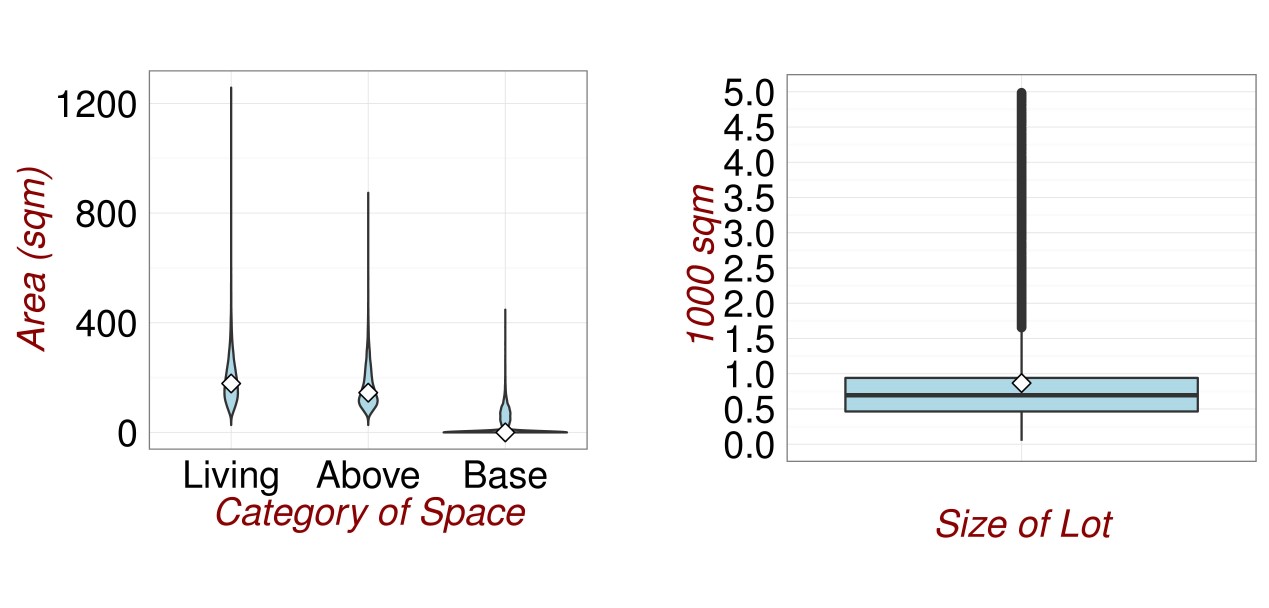
Figure 3.4: Revisiting the Data.
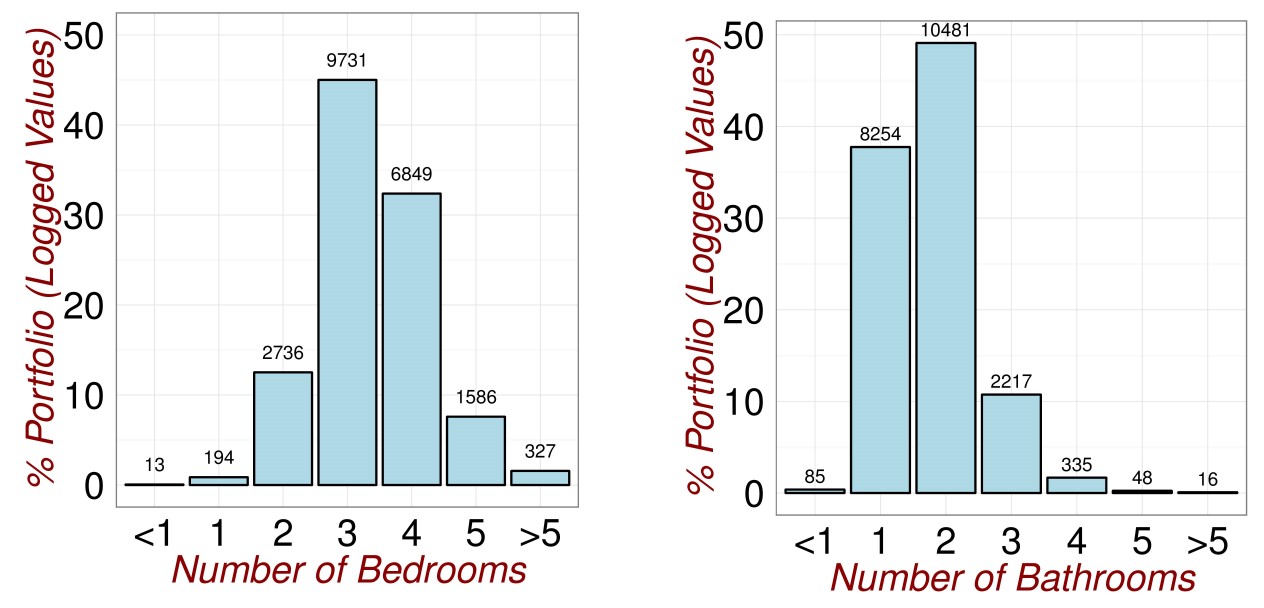
Figure 3.4: Revisiting the Data.
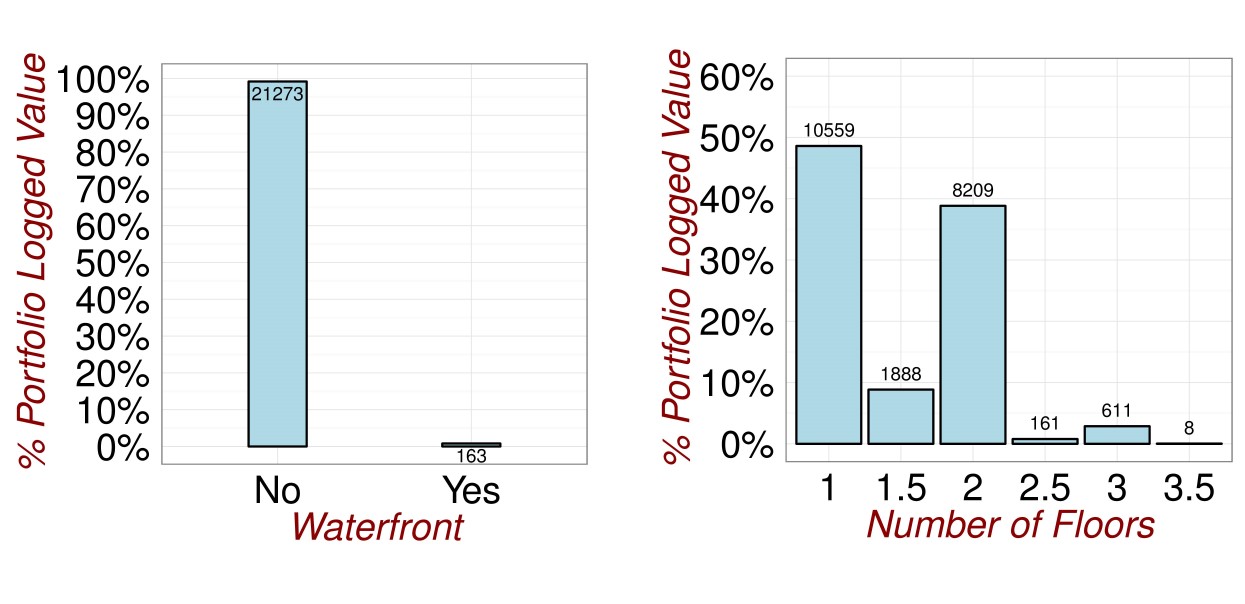
Figure 3.4: Revisiting the Data.

Figure 3.4: Revisiting the Data.
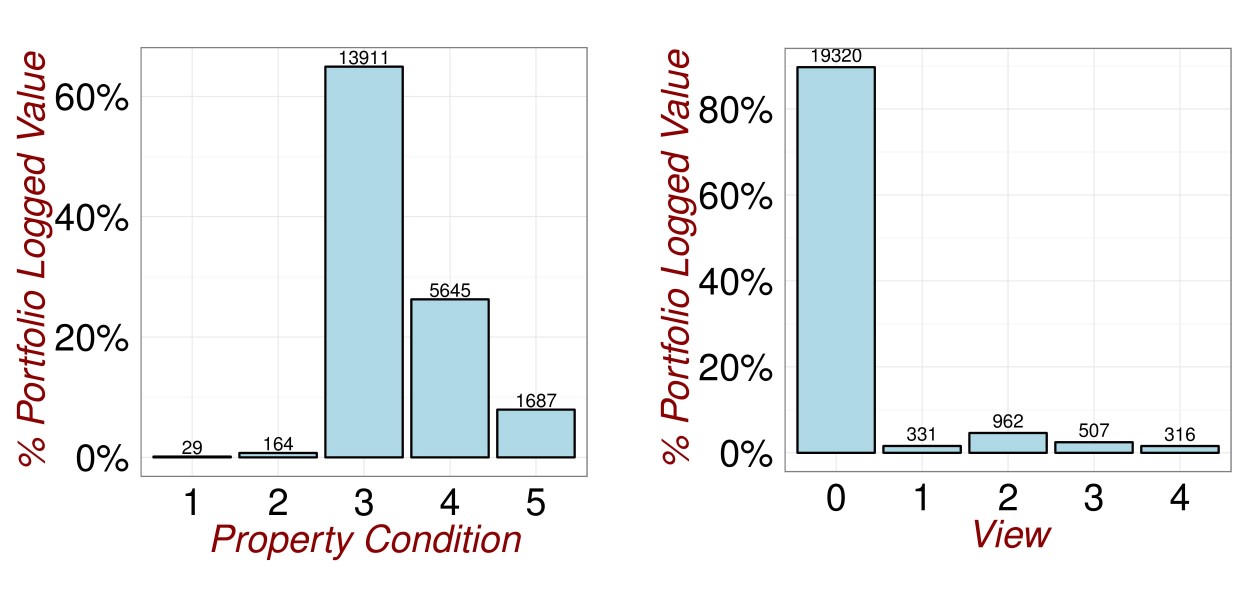
Figure 3.4: Revisiting the Data.
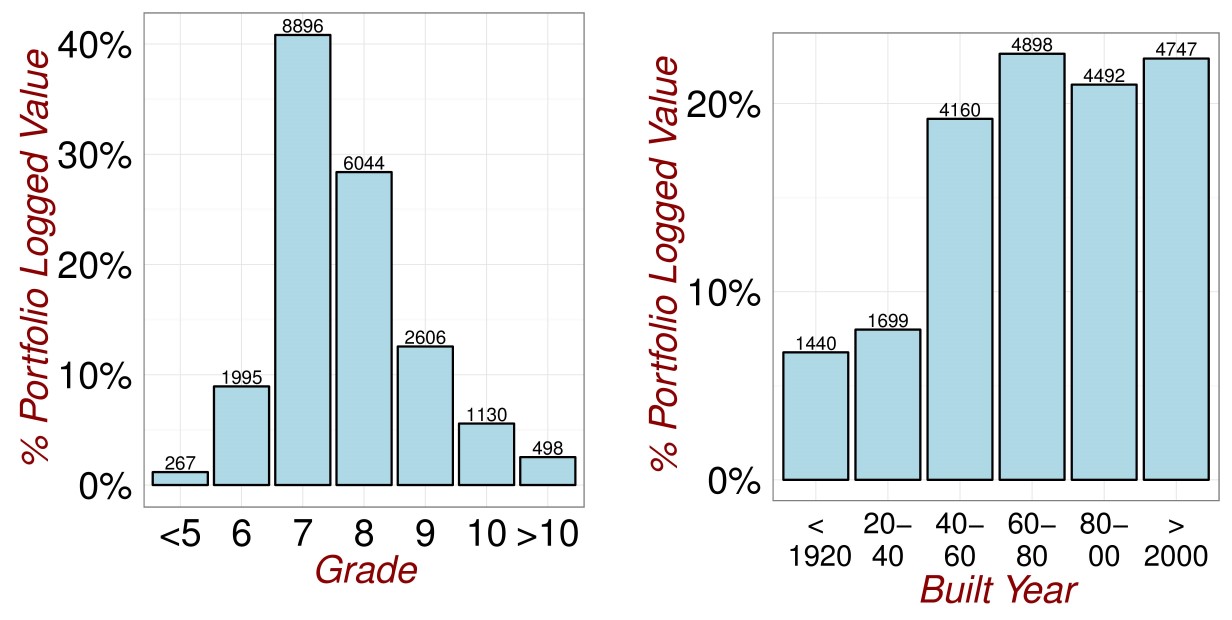
Figure 3.4: Revisiting the Data.
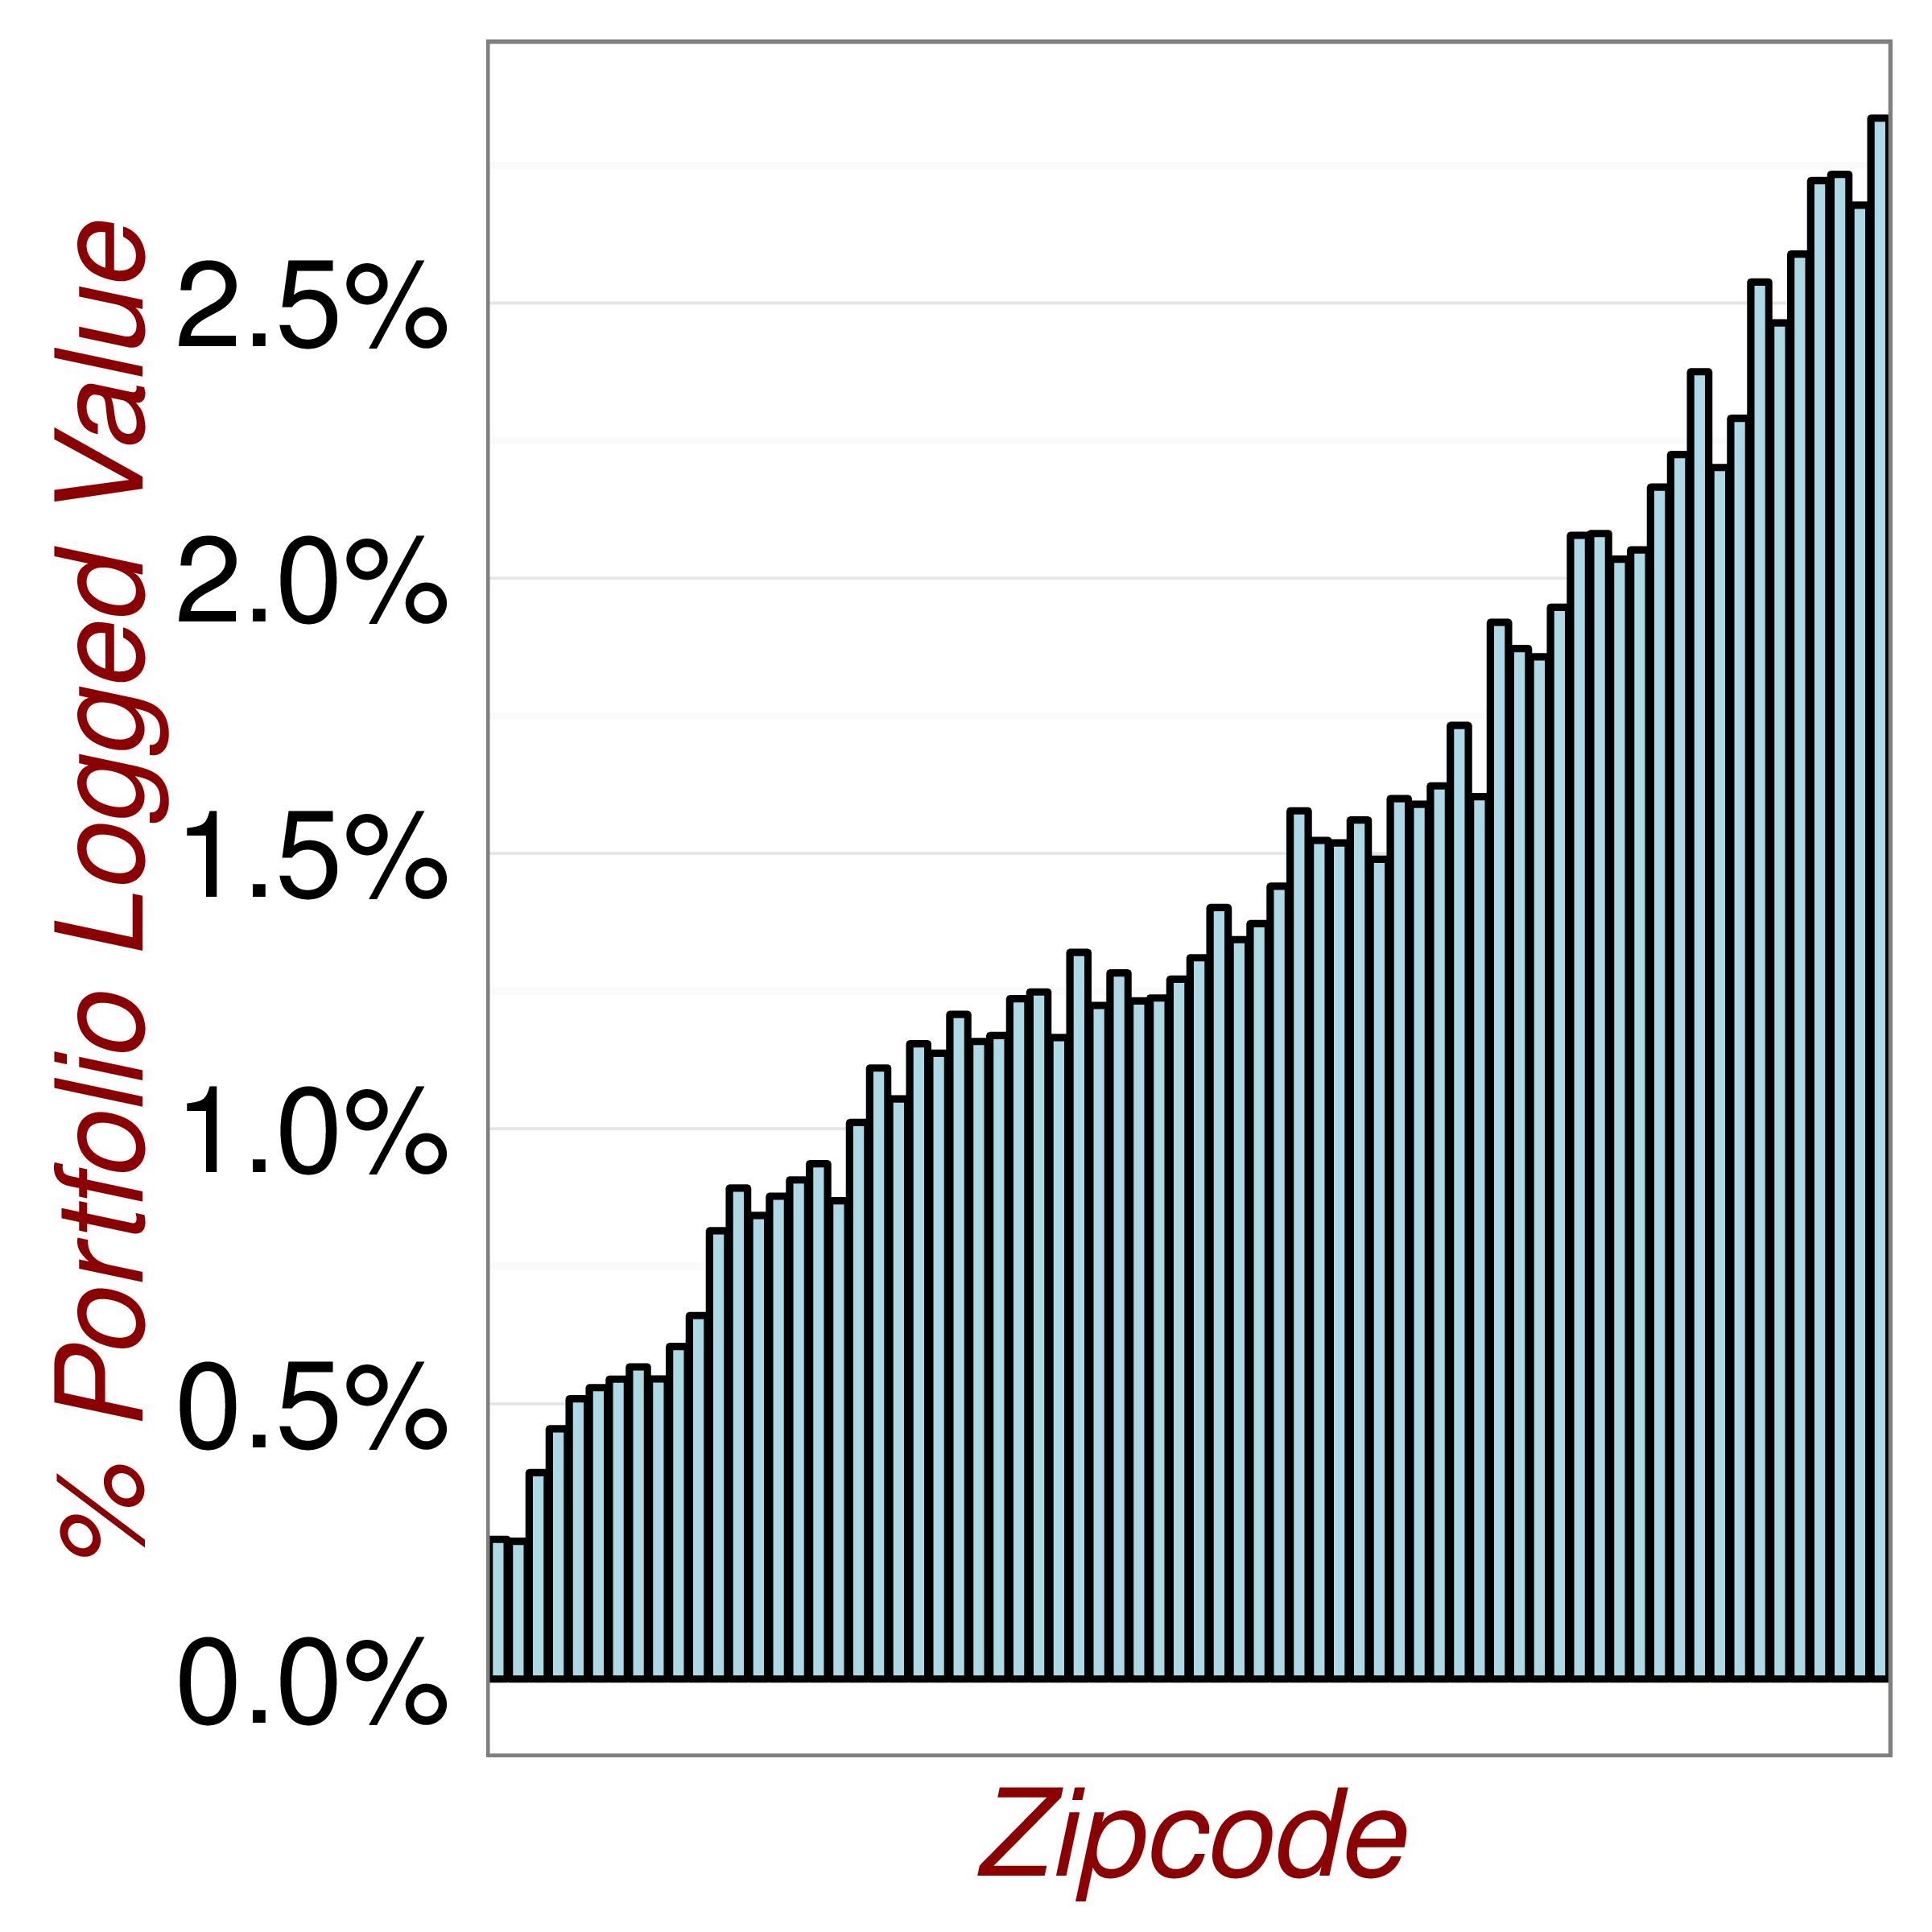
Figure 3.5: Revisiting the Data.
Statistics
Before fitting multivariate models it is important to understand the direction of univariate relationships between explanatory variable and response.
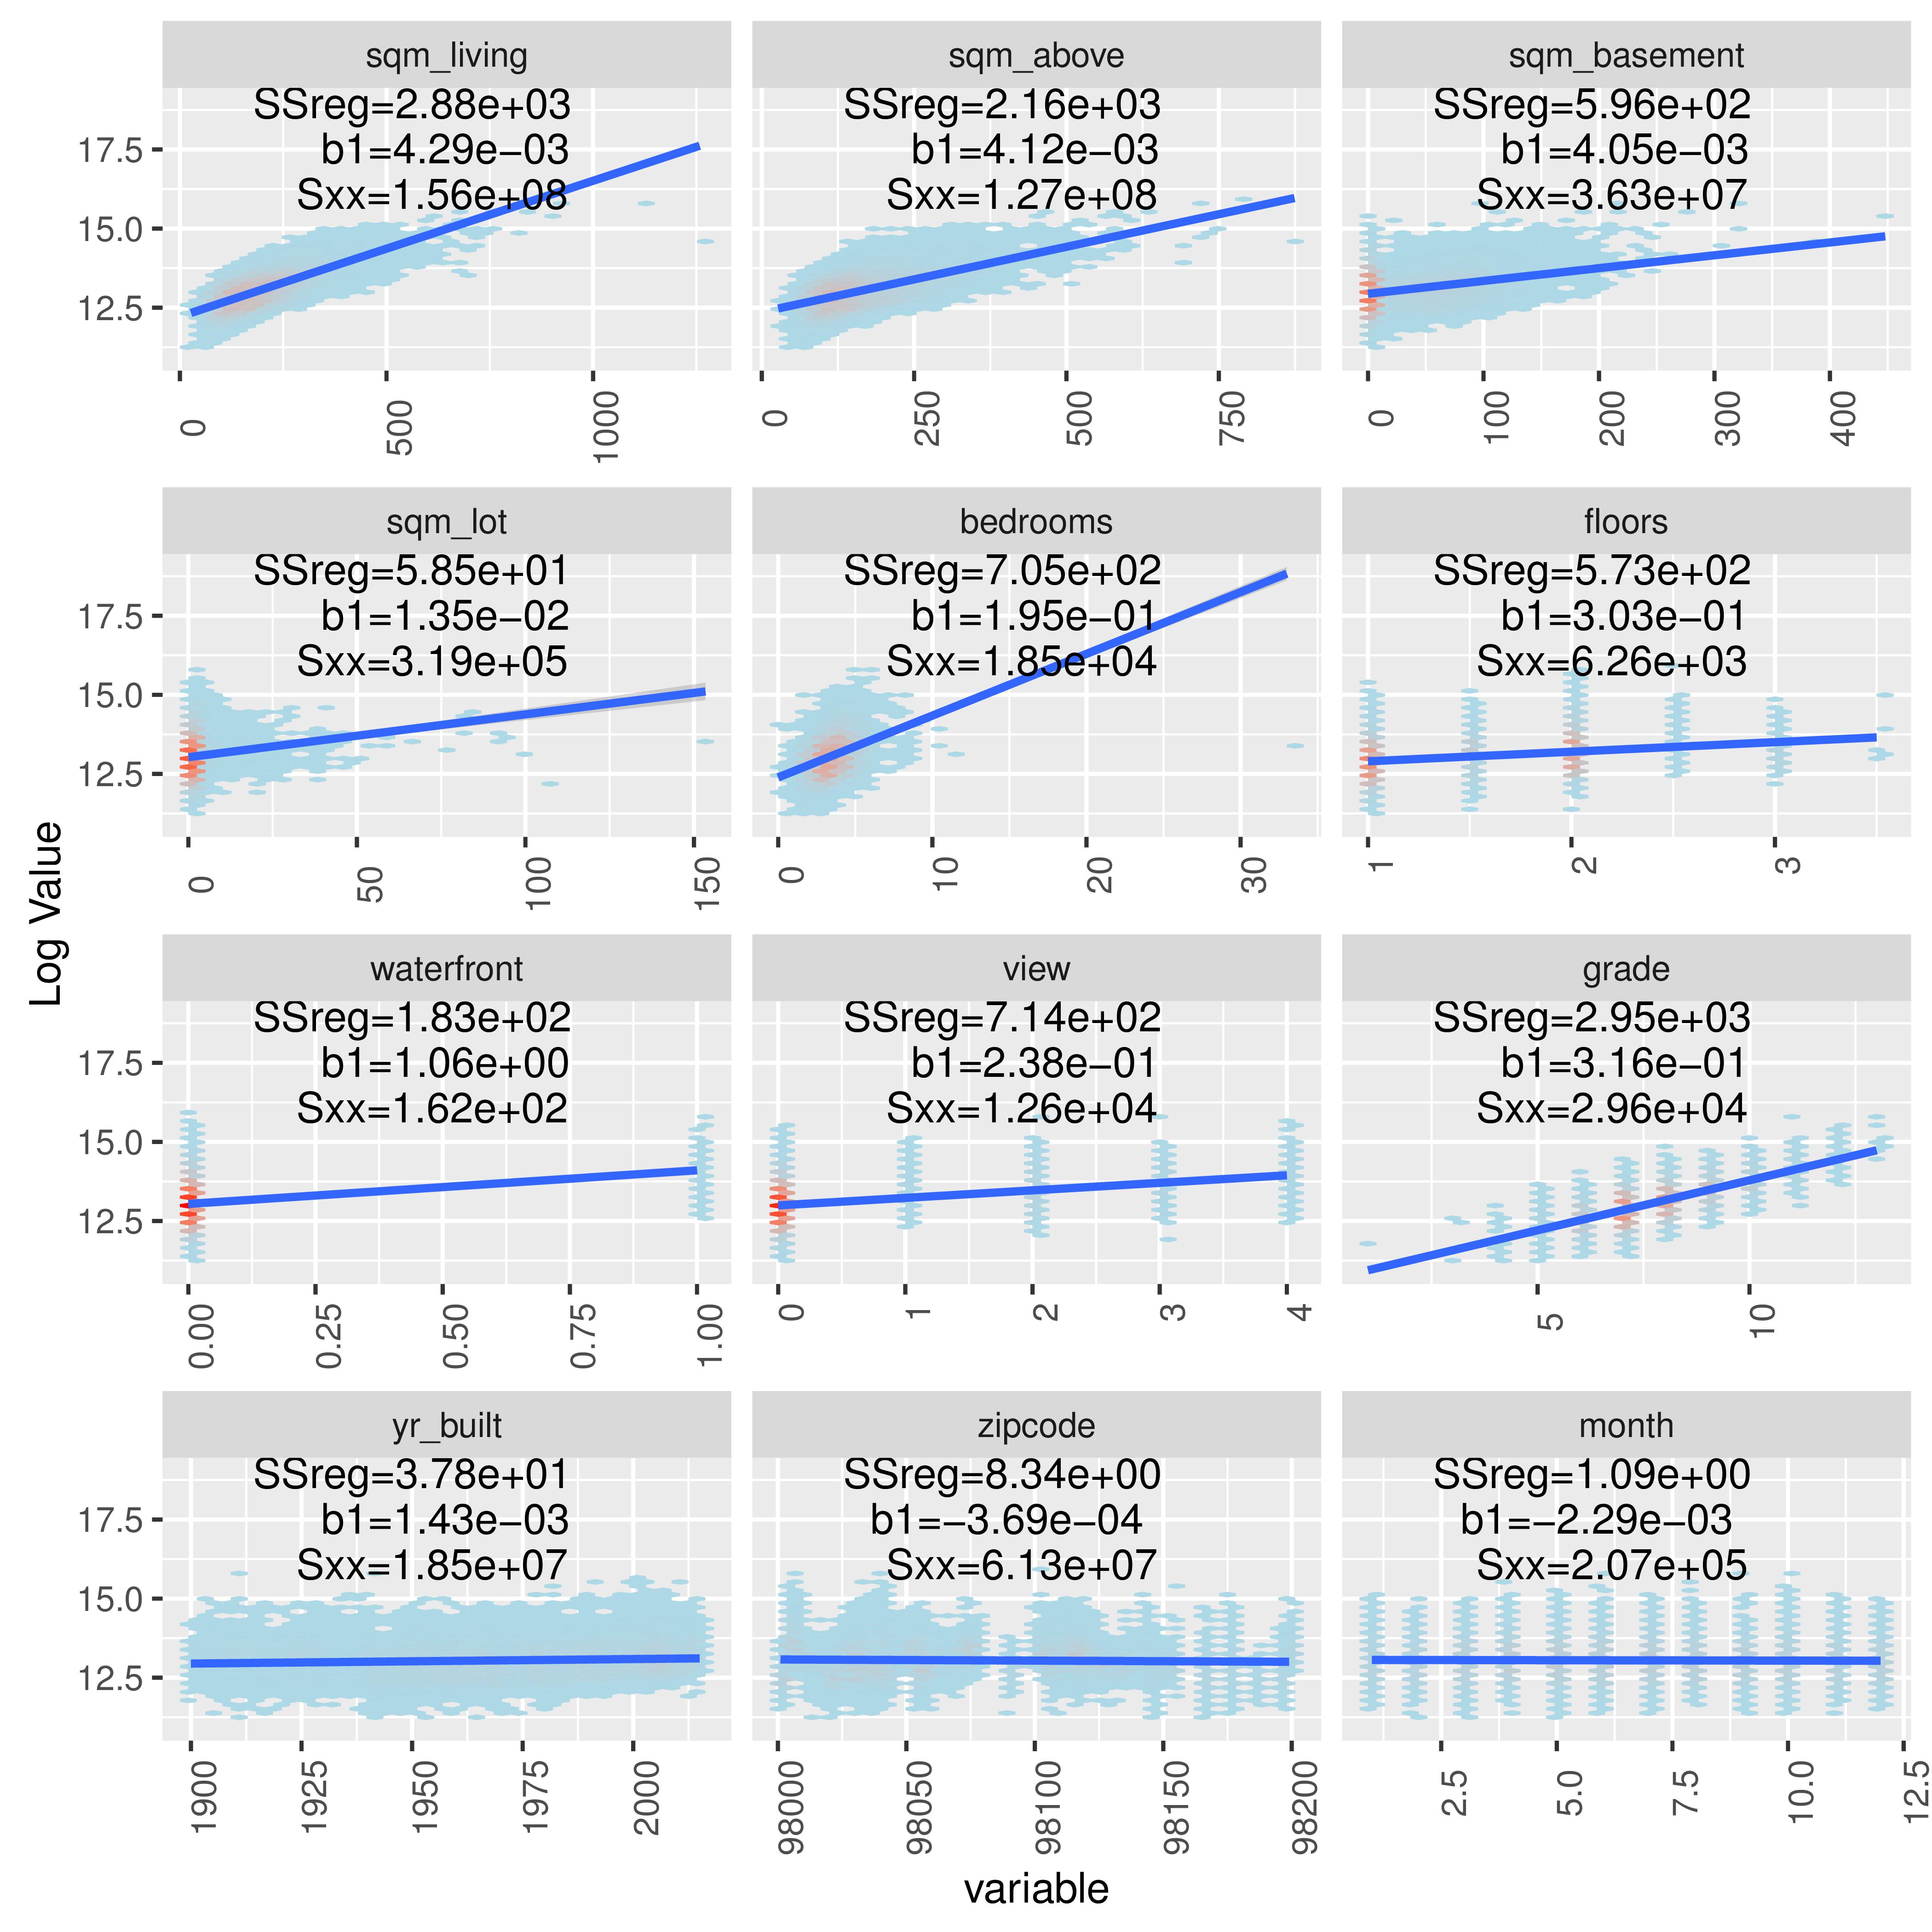
Figure 3.6: Understanding Relationships.
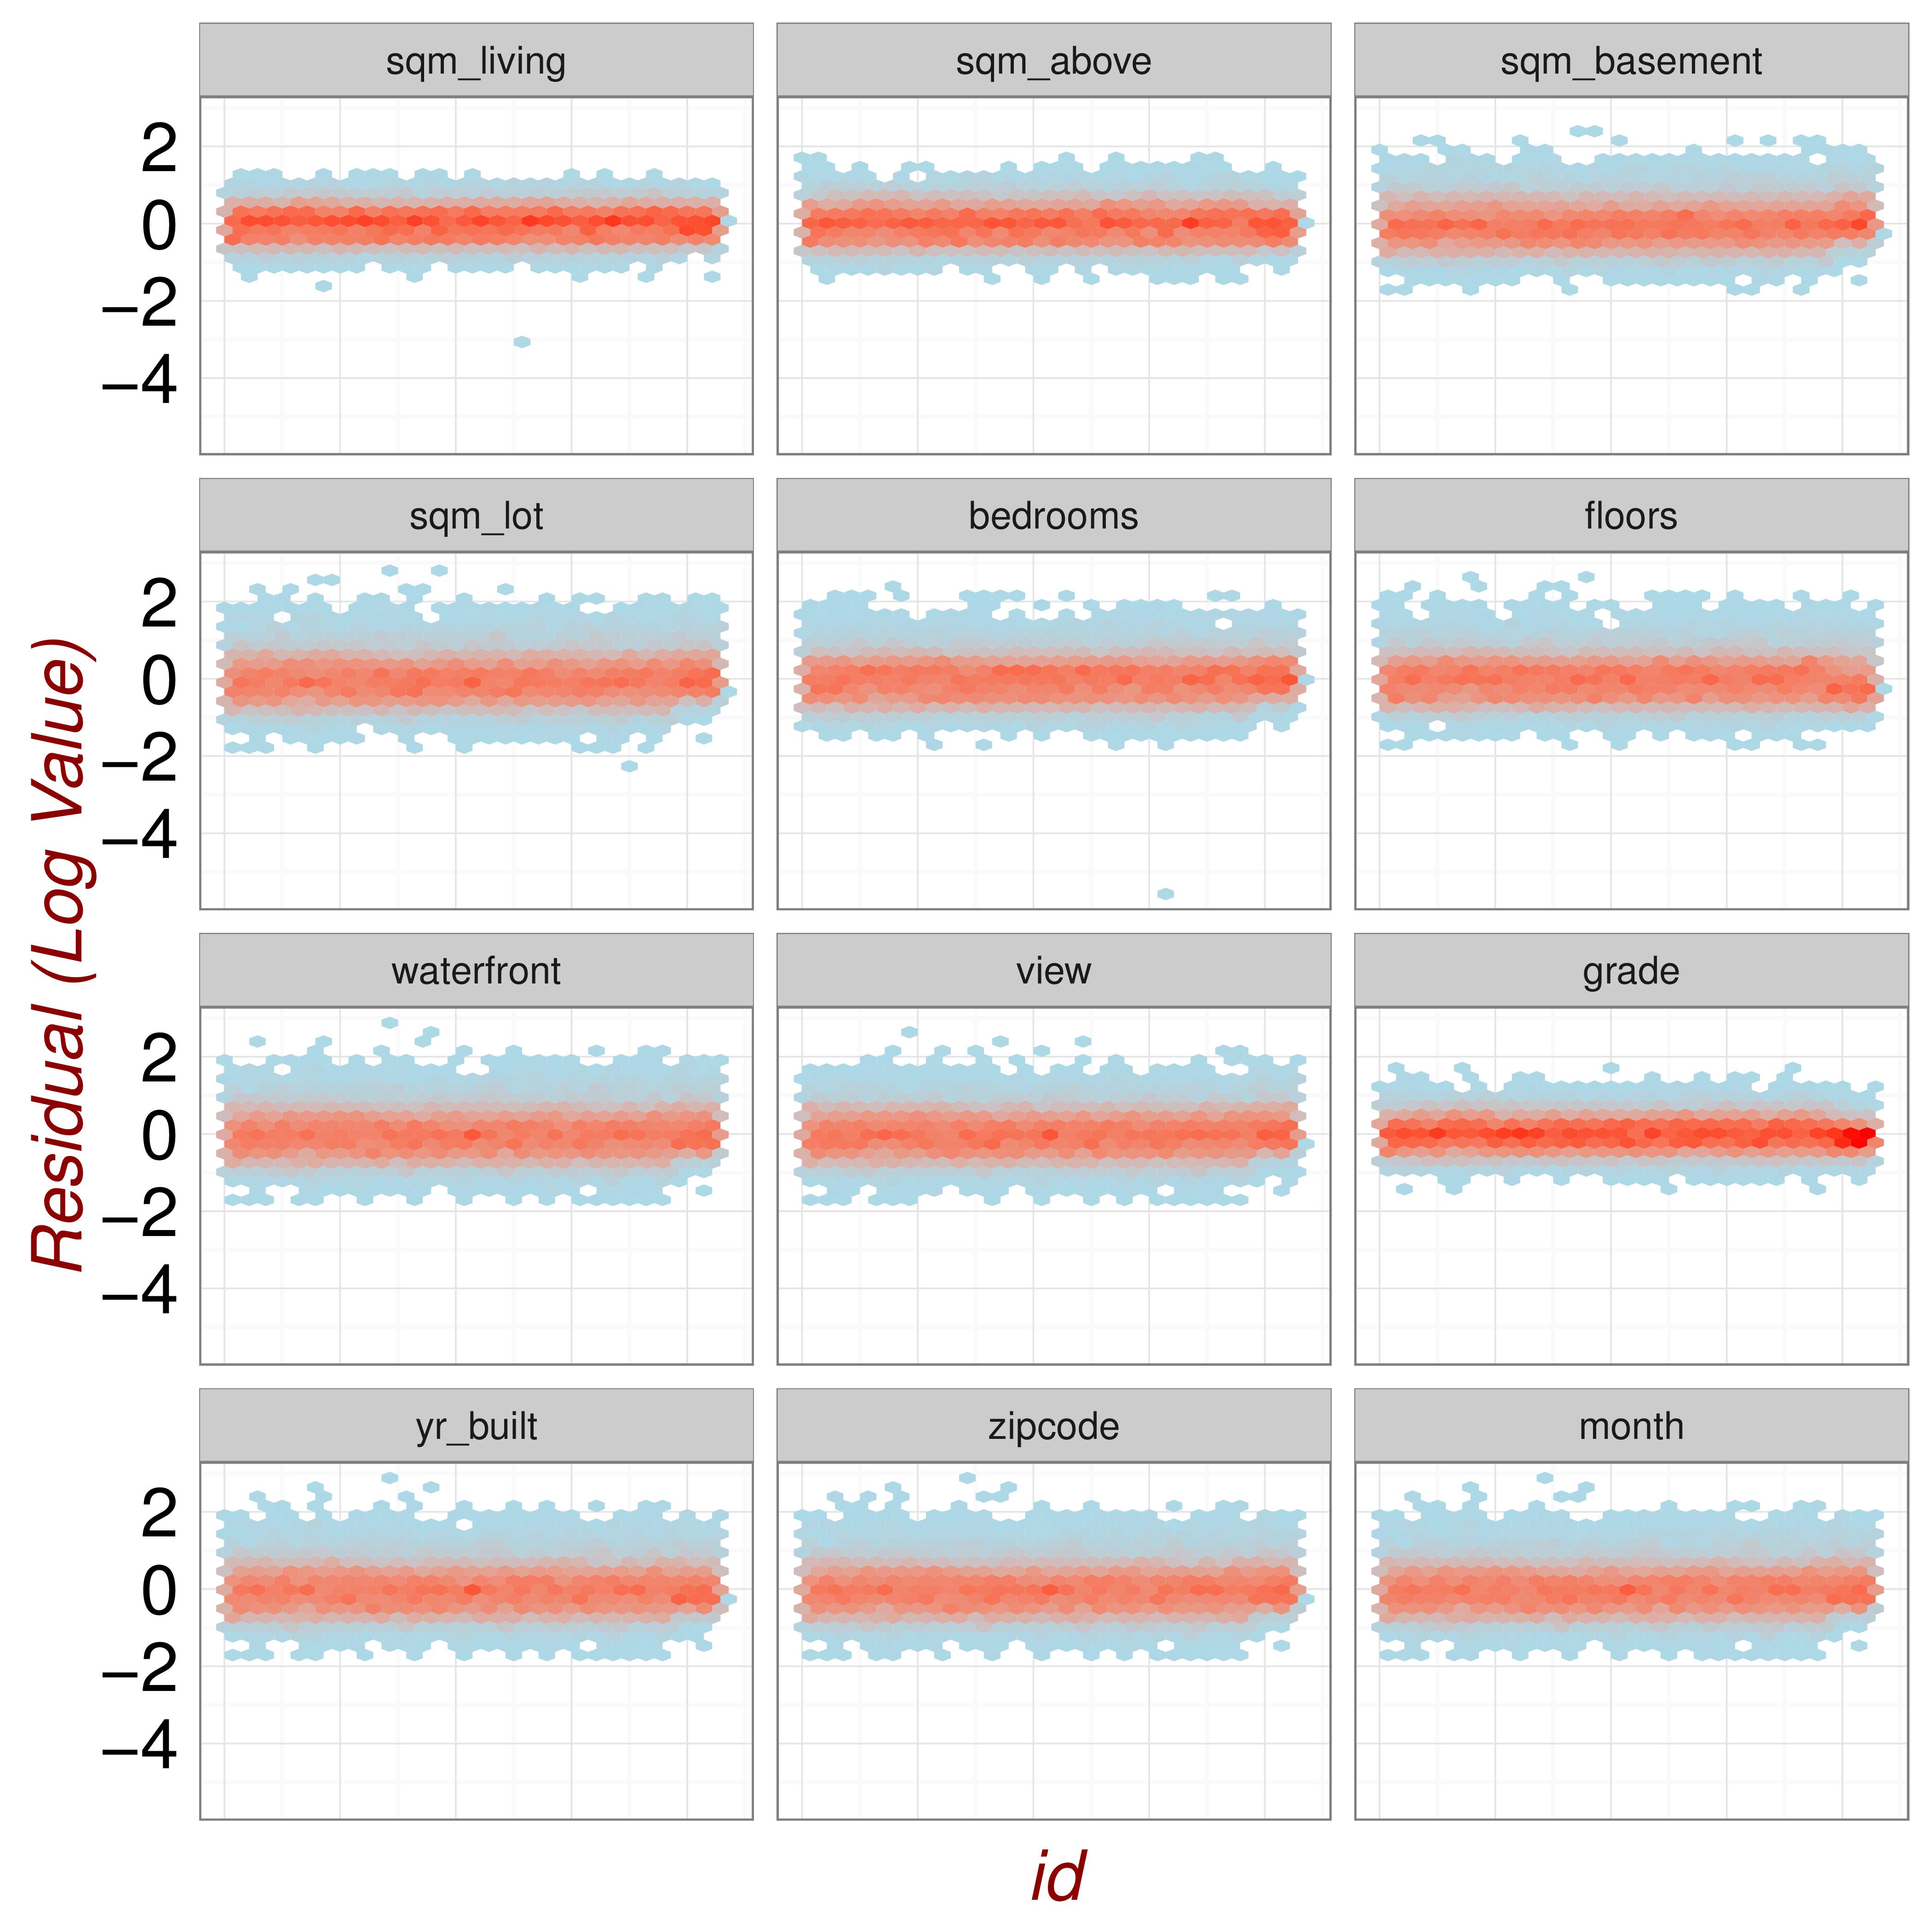
Figure 3.7: Looking for Poor Model Fit.