第 8 章 htmlwidgets (I): plotly
8.1 HTML and Graphs
8.1.1 靜態圖形引入html
8.1.1.1 非向量圖形
- 「非」向量格式:不是以幾何座標記載,而是整個圖面以raster矩陣去看待,且矩陣資料多有壓縮過。(.jpg, .png等)
<img src="圖檔來源">8.1.1.2 SVG向量圖形
- 向量格式: 圖形幾何以向量座標記載。(.svg,.shp等)
<object>外部引入
下載以下檔案: svg_example.html/plot_tree.svg
download.file("https://www.dropbox.com/s/2i3itbvvnamrtof/svg_example.html?dl=1",
              destfile="svg_example.html")
download.file("https://www.dropbox.com/s/w2qrri47hnury1t/plot_tree.svg?dl=1",
destfile="plot_tree.svg")- 同時在RStudio及Browser打開svg_example.html檔。
8.1.1.2.1 <svg>內部崁入
.svg檔也可以把圖檔內容之<svg>...</svg>區塊直接寫在html裡。
- 見svg_sample.html
8.1.2 Rmd引入svg
有兩種做法:
8.1.2.2 <object>外部引入
在文字區採用<object>引入方式。
8.1.3 ggplot與svg
8.1.3.1 ggsave
ggplot物件轉存SVG可用ggsave,用法如下:
8.1.3.2 gridSVG::grid.export
使用gridSVG::grid.export存成的svg有較豐富結構(如每個html element都有id),可較輕易後製讓SVG有interaction:
8.2 網頁互動
透過html裡放入的javascript(js)來進行所要變化:
html頁面的每個元素都屬於一個
<tag name> ...</tag name>區塊。js可以選出所要區塊並進行所要更動。
js也可以監視使用者是不在所要區塊做了什麼動作(如:點滑鼠右鍵,滑滾輪等)
8.2.1 htmlwidget
htmlwidget是指具有與使用者互動的網頁UI設計,在R裡有不少套件可以幫我們把R output生成htmlwidget,如plotly, leaflet等。
8.2.2 widget生成流程
從R到htmlwidget流程
因此我們需要一個可以完成R圖形物件轉htmlwidgets的工具,這裡我們介紹兩個工具:
plotly::ggplotly(): 直接將設計好的ggplot物件轉成htmlwidgets(但可能有些設計會失效,要進一步微調)。plotly::plotly(): 不使用ggplot繪圖,直接用plotly()畫,它會直接產生htmlwidgets。
8.2.3 htmlwidget的引用
有以下兩種:
直接在RMarkdown生成,沒有額外引入步驟,但生成的視覺設計會受RMarkdown css的影響。
另外存成html檔,在R Markdown裡以
<iframe>方式引入。多些步驟,但少了設計相衝的問題。
8.3 Plotly.R
所有細部設定說明要看Plotly JS版本的比較清楚:https://plot.ly/javascript/reference/
8.3.1 產生
8.3.2 修改
- Plot.ly chart studio tutorial: https://help.plot.ly/tutorials/
8.3.2.1 Chart studio設定
登入找到自己的plotly API key
在目前程式寫作的目錄創立一個檔名為.Rprofile的檔案:
- 裡面存以下兩行指令:
Sys.setenv("plotly_username"="各位的plotly平台使用者名稱")
Sys.setenv("plotly_api_key"="各位的API key的那一串英文與數字")- 以後打開你的project,那兩行會自動執行。
執行以下兩行確認:
若沒有,執行:
8.3.2.2 本機編修
- 直接修改list元素值。
8.3.2.3 上傳編修
- 使用
api_create()上傳plotly物件到plotly online editor.
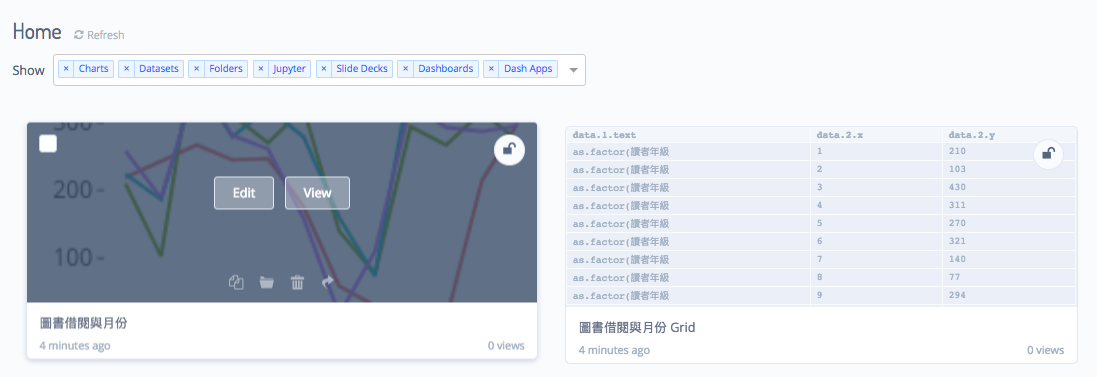
上傳成功進入plot.ly chart studio, 點選My Files,可以看到“pltly_hw5_004”。

點選圖形浮現的EDIT

JSON:
每個trace對應資料:
figure -> data ->-> meta -> columnNames trace geom使用查詢:https://plot.ly/python/reference/
輸入<type> > <mode>或<mode>
8.3.3 使用
8.3.3.1 修改ggplotly物件
先使用plotly_json()觀察plotly物件內容,再透過:
style()改traceslayout()改layoutconfig()改其他設定
8.4 Hover
滑鼠滑過稱為Hover。前小節我們學到怎麼用ggplot做好底圖的視覺美感,接下來我們通常會修正Hover information的呈現內容及格式。
8.4.1 Hover info
想顯示的訊息:
Any combination of “x”, “y”, “z”, “text”, “name” joined with a “+” OR “all” or “none” or “skip”.
text: 其他額外想顯示的訊息。
步驟1:找涉及圖層
使用plotly_json()檢視是哪個圖層(trace)的Hover要設定:
data: 定義不同圖層的geom, 外觀,hoverinfo等。
layout: 整個圖面的設計。
config: 其他
步驟2:更改info設定
用style()來更動trace內容。
不顯示:
pltly_p <-
pltly_p0 %>%
style(
traces=2:3,
hoverinfo = "none" ### 不顯示
)
pltly_p %>% layout(
title="hovertext='none' on traces 2-3"
)hoverinfo:
“none”: 不顯示,但hover event fired. (要在背景隱密觀測使用者時用)
- “skip”: 不顯示,也不會fire hover event.
8.4.2 Hover text
除了x,y座標也可以增加其他文字訊息:
pltly_p <-
pltly_p0 %>%
style(
traces=1,
hovertext=mtcars %>% rownames) ### hover text內容設定
pltly_p %>%
layout(title="hovertext=<指定字串> on traces 1")plotly的hovertext是由每個trace的text mapping值來決定,我們可以在ggplot繪圖時對想有hovertext的圖層使用aes(text=...)來增加text mapping,雖然geom可能不支援text mapping,但會pass on。
mtcars %>%
ggplot()+
geom_point(
aes(x=mpg, y=wt,
text=rownames(mtcars))
) -> ggplot_mtcars
ggplot_mtcars %>%
ggplotly()另外,也可以在ggplotly()裡使用tooltip=c("text")來設定以text aes mapping為hoverinfo的text內容。ggplotly() 也可以用來設定圖形width, height。
8.4.2.1 Hover box
- Hovertemplate: the information that appear on hover box. Note that this will override
hoverinfo. Variables are inserted using %{variable}, for example “y: %{y}”. Numbers are formatted using d3-format’s syntax %{variable:d3-format}, for example “Price: %{y:$.2f}”. https://github.com/d3/d3-3.x-api-reference/blob/master/Formatting.md#d3_format for details on the formatting syntax.
8.4.2.2 Hover label
font <- list(
family = "Roboto Condensed",
size = 15,
color = "white"
)
label <- list(
bgcolor = "#232F34",
bordercolor = "transparent",
font = font
)
plot_ly(x = iris$Petal.Length, hoverlabel = label)
qplot(x = Petal.Length, data = iris) %>%
ggplotly() %>%
style(hoverlabel = label, marker.color = "#232F34") %>%
layout(font = font)8.5 Plotly to htmlwidget
Dashboard是數個htmlwidgets組成,這節我們學習怎麼把plotly圖形存成htmlwidget,及之後如何引入dashboard使用。
範例:
8.5.0.1 步驟1:存下htmlwidget
- frameableWidget是用來確保htmlwidget在引入responsive designed html裡時,其responsive反應和主html檔一致。
8.5.0.2 步驟2:iframe embed
<iframe src="pltly_p0.html"
scrolling = "no"
seamless = "seamless" frameBorder = "0"
width= "100%" height="100%"></iframe>也可以使用以下source的save_frameableWidget()函數:
範例:
8.6 Plotly.js
基礎的用法是:
graphDiv: target<div>for the plot.data,layout,configare three JSON objectshttps://plot.ly/javascript/plotlyjs-function-reference/#plotlynewplot
ggplot -> plotly::ggplotly() -> plotly R調整動態效果 -> 另存htmlwidget -(1)-> R Makrdown iframe embed -> html
優點:快速產生基礎htmlwidget
缺點:許多動態調整不容易掌握
ggplot -> plotly::ggplotly() -> plotly_json() 取出JSON input -> 以html語法直接使用Plotly JS完成htmlwidget -(2)-> R Makrdown iframe embed -> html
優點:動態調整較容易掌握
缺點:產生基礎htmlwidget需要多些步驟
在iframe步驟前:
(1)使用
save_frameableWidget()(2)使用
to_frameableHTML()
8.6.1 Logics
一張plotly htmlwidget包含有:
JSON (JavaScript Object Notation):
定義trace, layout, config等Plotly.newPlot():接收JSON圖面定義
於指定
<div>區塊完成:SVG圖形繪製
event handler佈署
8.6.2 設定JSON資料
除了自己寫,也可透過ggplot-> ggplotly -> JSON.
p <- ggplot(mtcars, aes(x = wt, y = mpg)) +
   geom_point() + geom_smooth()
pltly_p0 <- ggplotly(p)
pltly_p0plotly物件轉JSON以文字檔儲存:
- 在html或Rmd文件裡設一個
若是在flexdashboard裡,則上述的<div>需改成:
- chrome browse html, 在console輸入:
滑鼠停在
=右邊,執行plotly物件轉JSON,再paste之前write_clip()的內容,按Enter。copy paste以下JS到console.
8.6.3 外部儲存JSON資料
比較好的作法是把plotly JSON另外存檔,等一下再採前一章JSON external include方式引入使用。
8.6.4 引入js
下載unzip以下檔案:
download.file("https://www.dropbox.com/s/b1ahww7qz5eckr6/pltlyP0_js.zip?dl=1",
              destfile="pltlyP0.zip")
unzip("pltlyP0.zip")準備作圖<div>區塊:
使用以下JSON引入js:
function fetchJSONFile(path, callback) {
    var httpRequest = new XMLHttpRequest();
    httpRequest.onreadystatechange = function() {
        if (httpRequest.readyState === 4) {
            if (httpRequest.status === 200) {
                var data = JSON.parse(httpRequest.responseText);
                if (callback) callback(data);
            }
        }
    };
    httpRequest.open('GET', path);
    httpRequest.send();
}
使用以下js進行plotly js作圖:
fetchJSONFile('pltly_p0.json',jdata=>{

  console.log(jdata); //Just to check what jdata is like

  //var myObj=JSON.parse(data.responseText)

  var graphDiv = document.getElementById('myPlot')
  var data=jdata["data"],
      layout=jdata["layout"],
      config=jdata["config"]

  Plotly.newPlot(graphDiv, data, layout, config);

})
8.7 流程圖:htmlwidgets生成與引入
以下流程圖說明如何形成獨立html檔之plotly htmlwidget,以便於下一章融入flexdashboard使用。