第 3 章 Aesthetic scales
每個geom有它可以使用的aes,geom裡的aes只是指定不同美學的決定資料變數,然而資料變數「值」如何映到「美學呈現」透過scale來更動。
ggplot2的所有aesthetic specifications: https://ggplot2.tidyverse.org/articles/ggplot2-specs.html
3.1 color/colour
3.1.1 常用套件
3.1.2 顏色模型
光的三原色為R(紅)G(綠)B(藍),三種光原色一起發光就會產生俗稱的白光。事實上光是沒有顏色的。而人類眼睛所看物體的顏色,是光線照在物體上所反射的波長被眼睛擷取到而決定人類所看到的顏色。白色就是所有的光都被反射所呈現的顏色,反之,黑色則是吸收了所有的光。
顏色常見有三種三維度的表現形式:
RGB
RGB(Red, Green, Blue):\((R,G,B)\in [0,1]^3\)
三原色以其最高顏色強度(255)的比例呈現。
[1] “#0000FF”
[1] “#8000B3”

HSV
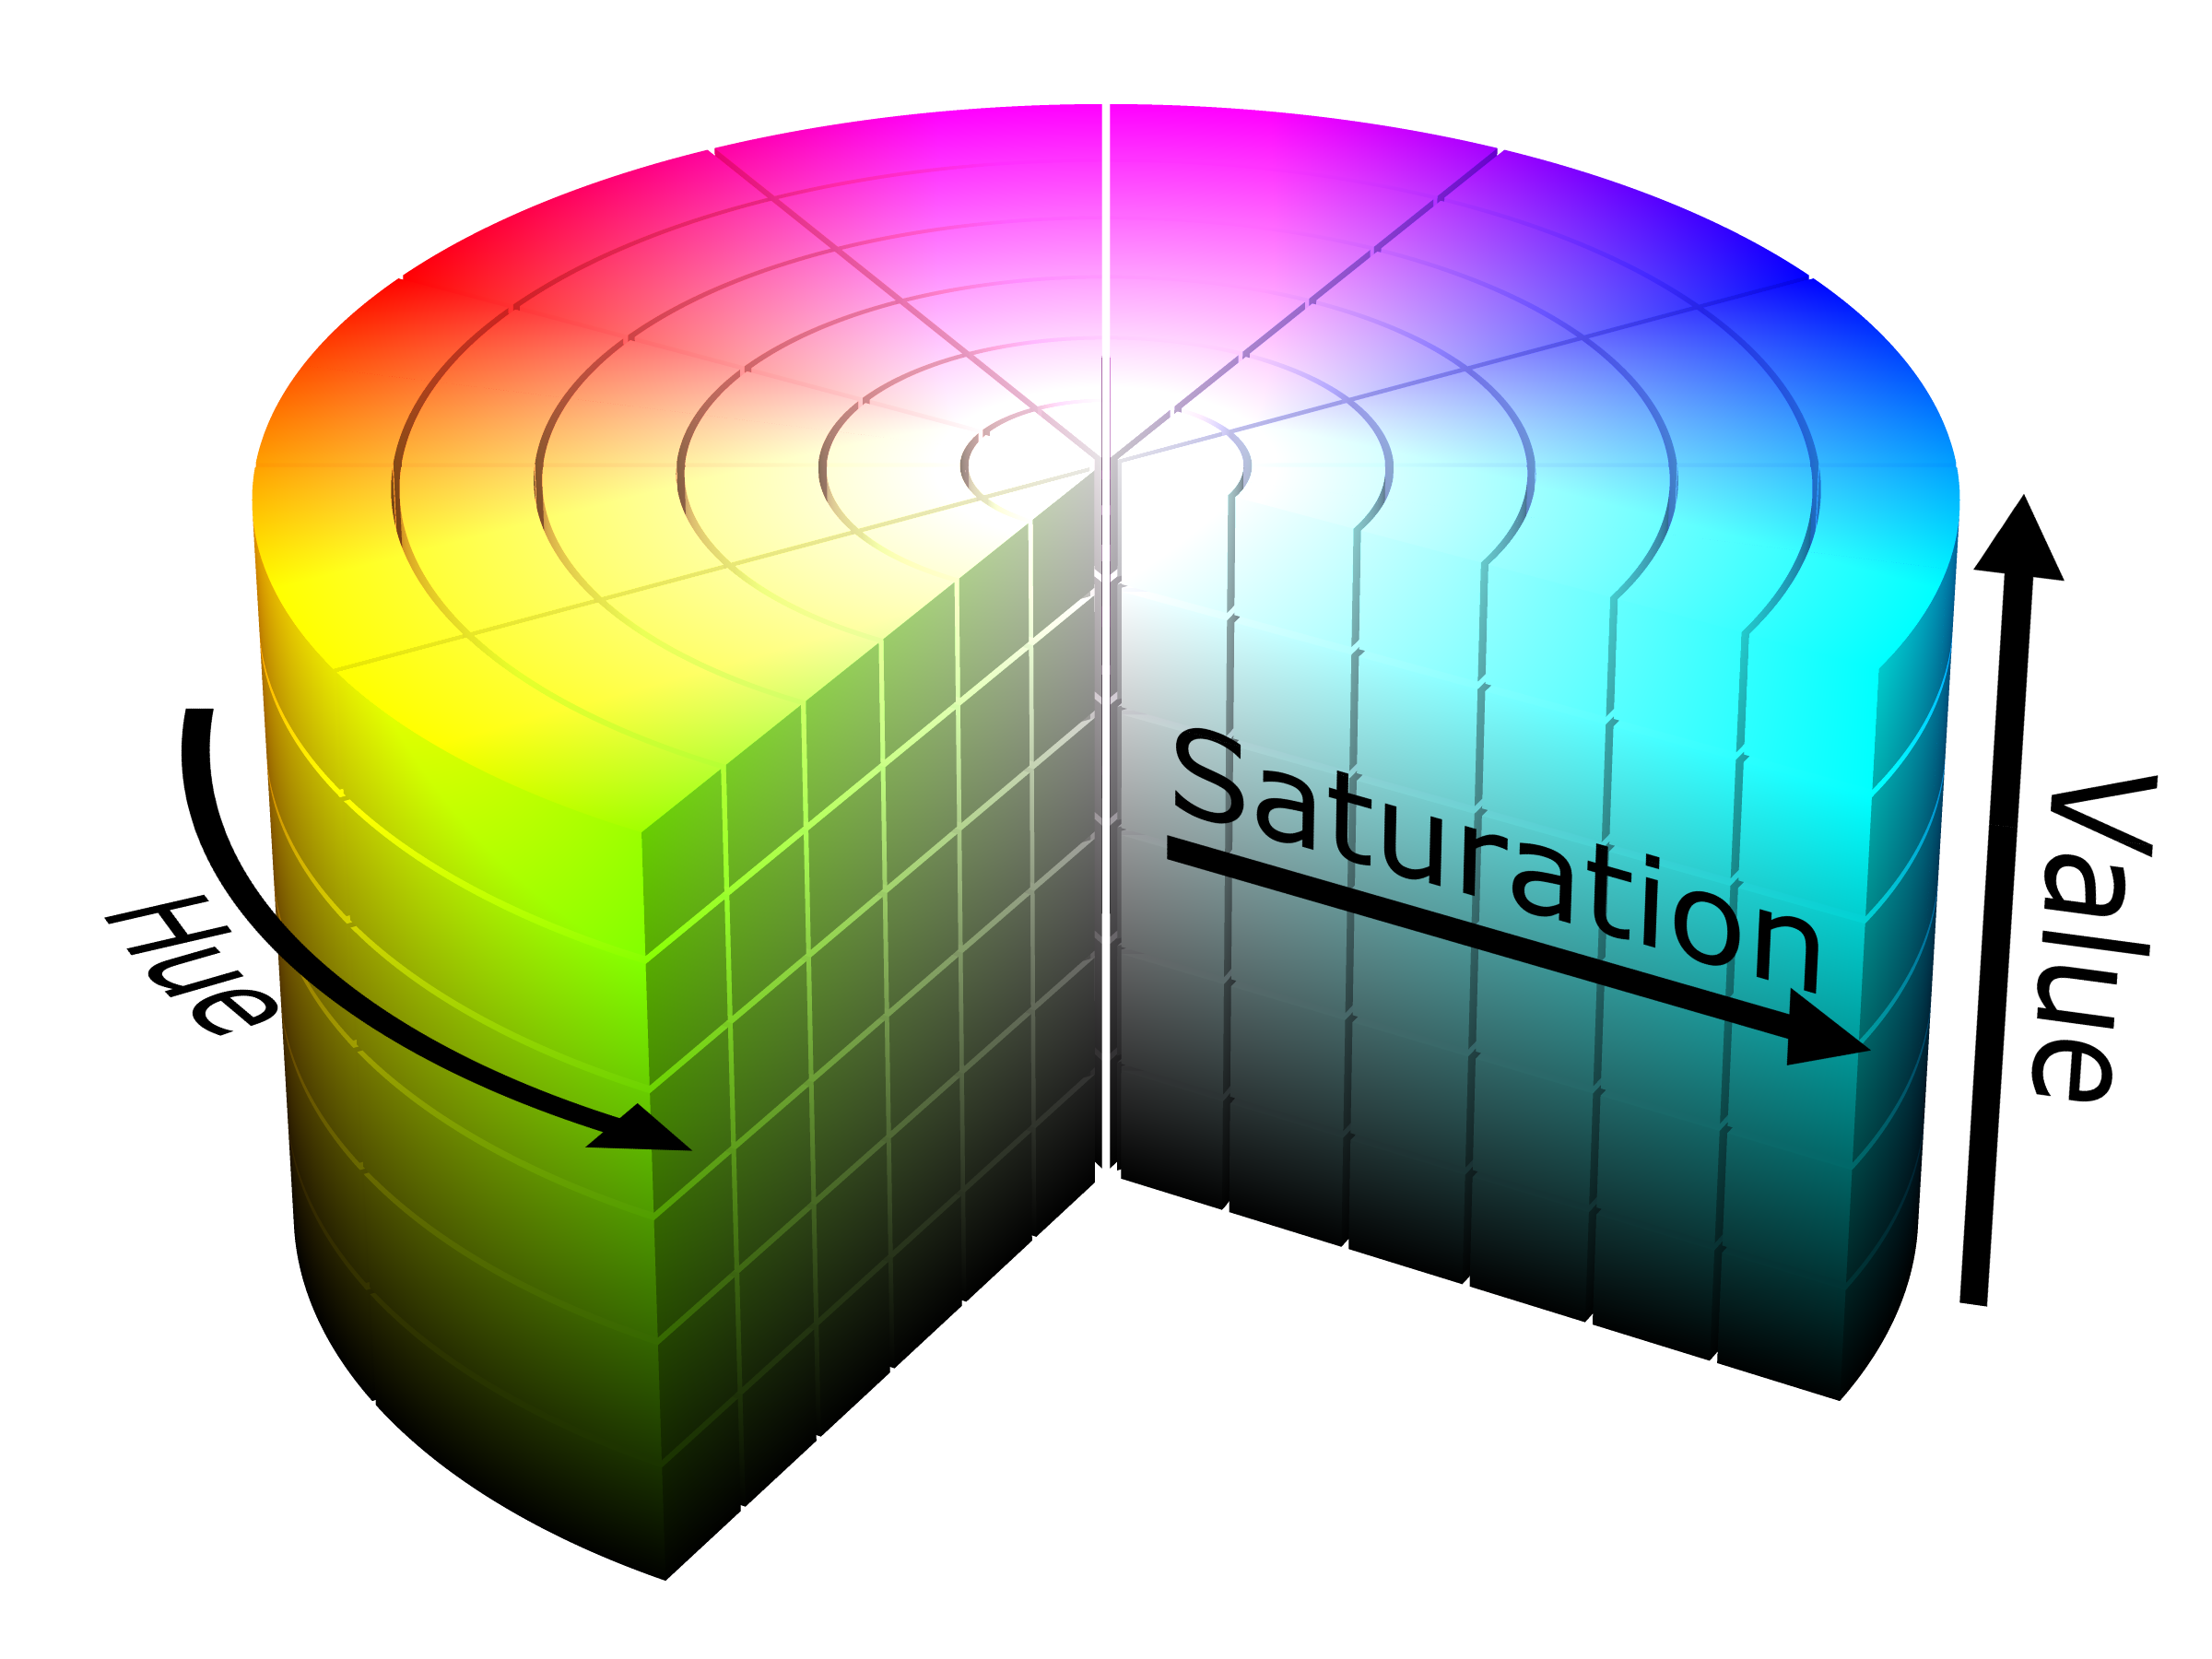
HSV(Hue, Saturation, Value):\((H,S,L)\in [0,1]^3\)
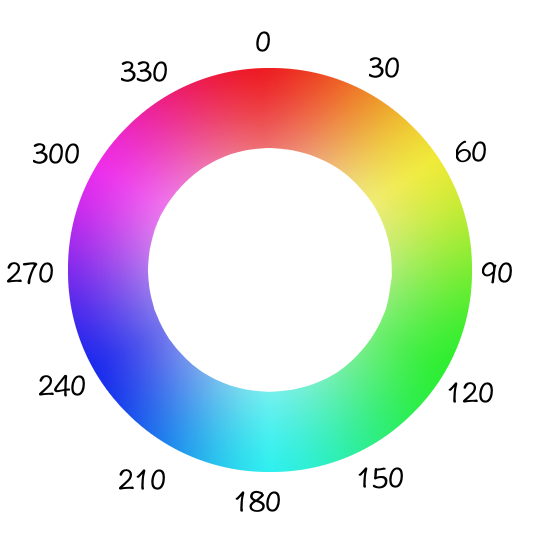
Hue(色像): 以360度色環所要「角度/360」選擇基本色。
Saturation(飽合度): 可以想成白色與所選擇基本色的混合比例,0=全白色,1=全基本色。 Value(lightness value照度): 可以想成要在多亮的環境下看,0=全暗,1=全亮。

圖 3.1: 360度色像Hue

圖 3.2: HSV意示圖
show_col(
  c(
    hsv(30/360,0,0),hsv(30/360,0.5,0),hsv(30/360,1,0), # (,,lightness=0) 全暗
    hsv(30/360,0,0.5),hsv(30/360,0.5,0.5),hsv(30/360,1,0.5), # (,,lightness=0.5)
    hsv(30/360,0,1),hsv(30/360,0.5,1),hsv(30/360,1,1) # (,,lightness=1) 全亮
  )
)
HCL
HCL是以人眼感受出發的色彩選擇,因此成品較能傳達作者所要的視覺感受。
- HCL(Hue, Chroma, Luminance): \((H,C,L)\in [0,360]\times[0,\bar{c}]\times[0,100]\) HSL是以感官出發點的顏色描繪系統。
Hue(色像): 以360度色環選擇基本色。
Chroma(彩度): 彩度越低顏色感受越有陰影感。
Luminance(流明度): 流明度越高代表在越亮的環境觀看。
由於HCL是以人眼感受出發,每一種色像會有眼睛感觀的上下限,它受到彩度及流明度的設定影響,故HCL在不同色像下它的眼睛可感受C-L空間大小及位置會不同,我們可以使用colorspace::choose_color()來協助參數選擇:
3.1.3 調色盤palette
- 使用
choose_palette(gui="shiny")選完palette可以copy下來對應的palette hcl函數並修改函數的register參數成為所要名稱。
調色盤(palette)是將N個顏色進行排序,排序原則依視覺化目的分成:
- Qualitative:只要突顯不同類別就好。
pal_qual <- colorspace::qualitative_hcl(
  n = 7,
  h = c(0, 360), c = 35, l = 85,
  register = "myQualitative"
  )
pal_qual %>% specplot(hcl=F)
圖 3.3: Qualitative:維持亮度、彩度,只改變色像
在hcl座標上,固定c=35,l=85,只改變色像由0角開始到360度結束。
- Sequential: 要突顯不同類同時有排序感。
pal_seq <- colorspace::sequential_hcl(
  n = 7,
  h = 135, c = c(45, NA, NA), l = c(35, 95),
  power = 1.3,
  register = "mySequential")
pal_seq %>% specplot(hcl=F)
圖 3.4: Sequential:維持色像,逐步調高亮度、降低彩度
hcl由(135,45,35)高彩度走到(135,0,95)低彩度,走法的由power參數控制。
- Diverging: 要突顯不同類且強調極端族群的資料。
pal_diverge <- colorspace::diverging_hcl(
  n = 7,
  h = c(260, 0), c = 80, l = c(30, 90),
  power = 1.5,
  register = "myDiverge")
pal_diverge %>% specplot(hcl=F)
圖 3.5: Diverging:兩段Sequential走法。
hcl由(260,80,30)高彩度走到(260,0,95)無彩度灰色(即sequential走法),再走到(0,80,30)。由於無彩度時hue不重要,下半段走法可以想成(0,0,95)走到(0,80,30)(而一次的sequential走法) ,走法的由power參數控制。
3.1.4 ggplot應用
基本概念
ggplot是透過+scale_colour/scale_fill...()來改變顏色與變數值的對應:
scale_color_...用來改變aes為color的顏色。scale_fill_...用來改變aes為fill的顏色。
data.frame(
  x1 = factor(sample(c(1L,2L,3L),100,replace=T)),
  x2 = runif(100),
  y = runif(100),
  z1 = rnorm(100),
  z2 = factor(sample(letters[1:4],100,replace=T))
) -> df_example

套用調色盤palette
colorspace套件額外增加了以下的scale_...()函數:
scale_<geom裡的色彩aes>_<aes變數類型>_<色彩使用目的>
basicBoxplot +
  scale_fill_discrete_qualitative(palette="myQualitative",nmax=5) # 由於色圈會由0度出發回到360度所以第1個及第5個會是同色,因此4類要創出5個顏色才不會有1,4類同色問題。


顏色變化率
有時用來對應顏色的資料太集中在某一類或某些數值範圍,這時圖面上反而區分不了資料差異,此時有必要改變調色盤的顏色變化率。
data.frame(
  x1 = factor(sample(c(1L,2L,3L),100,replace=T)),
  x2 = runif(100),
  y = runif(100),
  z1 = c(rnorm(30,-1,0.05),rnorm(70,1,2))
) -> df_example2
範例:使用顏色突顯
處理資料
選色
colorspace::sequential_hcl(n = 7, h = c(300, 200), c = c(60, NA, 0), l = c(25, 95), power = c(0.7, 1.3), register = "Custom-Palette") -> color7
color7 %>% scales::show_col()
[1] “#6B0077” “#724E95” “#7C7BB2” “#8DA3CA” “#A7C6DD” [6] “#C8E2EB” “#F1F1F1”
3.1.5 其他
色盲
deutan: green cones in the eye detect too much red light and not enough green light. As a result red, yellow, green, and brown can appear similar, especially in low light.
protan: the red cones do not detect enough red and are too sensitive to greens, yellows, and oranges. As a result, greens, yellows, oranges, reds, and browns may appear similar, especially in low light.
tritan: a loss of color discrimination for shades of blue and yellow but it is not typically a form of color blindness.
3.1.6 練習
下載台灣五等距家庭所得家庭可支配所得:
disposableIncome <- read_csv("https://www.dropbox.com/s/z80sbjw94cjex8x/disposableIncome.csv?dl=1",
locale = locale(encoding = "BIG5"), skip = 4)
計設一圖突顯不同家庭所得在2003年金融海嘯後的所得上升速度差異。
3.2 Linetype
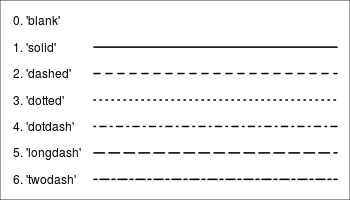
Two ways to specify it.
使用線形名稱

library(readr)
disposableIncome <- read_csv("https://www.dropbox.com/s/z80sbjw94cjex8x/disposableIncome.csv?dl=1")

disposableIncome_gather <- read_csv("https://www.dropbox.com/s/cdw1f10jow4frxb/disposableIncome_gather.csv?dl=1")
disposableIncome %>%
mutate(
年=as.integer(X1)
) -> disposableIncome
disposableIncome %>%
ggplot(aes(x=年,y=平均每戶可支配所得))+
geom_line(linetype="dashed")
使用hex碼
用數字來定義一個完整線段的形式。 “33”:3個點距的「線」,接3個點路的「空白」
連線數字分別代表:「線」「空白」「線」「空白」依此類推


3.2.1 scale_linetype套用
library(magrittr)
disposableIncome_gather$所得組距 %<>%
  factor(levels=c(
    "可支配所得按戶數五等分位組-最低所得組",
    "可支配所得按戶數五等分位組-次低所得組",
    "可支配所得按戶數五等分位組-中間所得組",
    "可支配所得按戶數五等分位組-次高所得組",
    "可支配所得按戶數五等分位組-最高所得組"
  ))

disposableIncome_gather %>%
  ggplot(aes(x=年,y=可支配所得))+
  geom_line(
    aes(linetype=所得組距,size=所得組距)
  ) +
  scale_linetype_manual(
    values=c("15","24","34","51","71")
  ) +
  scale_size_manual(
    values=c(0.1,0.3,0.3,0.5,0.7)*1.5
  ) -> p_linetype
p_linetype
3.3 Date/Time
若x/y軸為日期/時間,要更改x/y軸美感呈現,以x軸為例,可使用scale_x_*,其中*依日期/時間型態(以其class決定)分成:
- scale_x_date: class Date
- scale_x_datetime: class POSIXct
- scale_x_time: class hms
每一種詳細用法可參見Position scales for date/time data。
由於三種的使用原則大致相同,我們以常見的日期(Date)型態做說明。
範例:消費者物價指數
資料來源: 行政院主計總處
單位:民國105年=100
資料處理
dataCPI <- read_csv("https://www.dropbox.com/s/ov2bvef5o3apei0/PR0101A2Mc.csv?dl=1")

## 改變數名稱
dataCPI %>%
  dplyr::rename(
    年月=X1,
    CPI=原始值
  ) -> dataCPI

# 移除「有NA」的row
dataCPI %>% na.omit() -> dataCPI

## 調整class
dataCPI$年月 %>% str_c("/01") %>% #擴增為YMD表示
  ymd() -> dataCPI$年月

# 改成2003M1為基期,其指數為100
dataCPI %>% filter(年月==ymd("2003-01-01")) %>%
  select(CPI) -> CPI2003M1
dataCPI %>%
  mutate(CPI=CPI/CPI2003M1$CPI*100) -> dataCPI2
基本圖形

3.3.1 limits: scale變數呈現範圍
NA:表示沒設限

適用於任何scale
x scale呈現範圍:2003-01-01以後
y scale呈現範圍:80以上

- linetype scale只呈現“次低所得組”,“中間所得組”,“次高所得組”
disposableIncome_gather %>%
  ggplot(aes(x=年,y=可支配所得))+
  geom_line(
    aes(linetype=所得組距)
  ) +
  scale_linetype_manual(
    values=c("15","24","34","51","71"),
    limits=c(
    "可支配所得按戶數五等分位組-次低所得組",
    "可支配所得按戶數五等分位組-中間所得組",
    "可支配所得按戶數五等分位組-次高所得組")
  )
3.3.2 breaks: scale變數圖例說明範圍
breakDates <- c("2003-01-01",
                "2005-01-01","2010-01-01","2015-01-01",
                "2018-01-01")
breakDates %>% ymd() -> breakDates
basePlot2 +
  scale_x_date(limits=c(ymd("2003-01-01"),NA),
               breaks = breakDates)
3.3.2.1 適用於任何scale
- linetype scale的圖例只說明“次低所得組”,“中間所得組”,“次高所得組”
disposableIncome_gather %>%
  ggplot(aes(x=年,y=可支配所得))+
  geom_line(
    aes(linetype=所得組距)
  ) +
  scale_linetype_manual(
    values=c("15","24","34","51","71"),
    breaks=c(
    "可支配所得按戶數五等分位組-次低所得組",
    "可支配所得按戶數五等分位組-中間所得組",
    "可支配所得按戶數五等分位組-次高所得組")
  )
3.3.3 labels: scale變數圖例說明文字對應
手動設標示點名稱
breakDates <- c("2003-01-01",
                "2005-01-01","2010-01-01","2015-01-01",
                "2018-01-01")
breakDates %>% ymd() -> breakDates

breakLabels <- c("2003",
                 "2005","2010","2015",
                 "2018")
basePlot2 +
  scale_x_date(limits=c(ymd("2003-01-01"),NA),
               breaks = breakDates,
               labels = breakLabels)
函數設標示點名稱
函數必需能由breaks input產生字串output
basePlot2 +
  scale_x_date(limits=c(ymd("2003-01-01"),NA),
               breaks = breakDates,
               labels = function(x) year(x))
請將年月標示名稱改成民國年表示。
3.3.3.1 適用於任何scale
- linetype scale的圖例只說明“次低所得組”,“中間所得組”,“次高所得組”
disposableIncome_gather %>%
  ggplot(aes(x=年,y=可支配所得))+
  geom_line(
    aes(linetype=所得組距)
  ) +
  scale_linetype_manual(
    values=c("15","24","34","51","71"),
    breaks=c(
    "可支配所得按戶數五等分位組-次低所得組",
    "可支配所得按戶數五等分位組-中間所得組",
    "可支配所得按戶數五等分位組-次高所得組"),
    labels=c(
    "次低所得組",
    "中間所得組",
    "次高所得組"),
    )
3.4 geom_text
圖例(legends)有時並不是視覺化最佳變數說明方式,有時取消它改用geom_text()或annotate()反而較佳。
disposableIncome_gather %>%
  group_by(所得組距) %>%
  summarise(
    最後一年=last(年),
    可支配所得=last(可支配所得)
  ) %>%
  ungroup() %>%
  mutate(
    所得組=stringr::str_replace(
      as.character(所得組距),"可支配所得按戶數五等分位組-","")
    )-> disposableIncome_gather_legend

disposableIncome_gather %>%
  ggplot(aes(x=年,y=可支配所得))+
  geom_line(
    aes(linetype=所得組距)
  ) +
  scale_linetype_manual(
    values=c("15","24","34","51","71"),
    breaks=c(
    "可支配所得按戶數五等分位組-次低所得組",
    "可支配所得按戶數五等分位組-中間所得組",
    "可支配所得按戶數五等分位組-次高所得組")
    ) +
  theme(legend.position = "none") + # 取消legend
  geom_text(
    data=disposableIncome_gather_legend,
    aes(
      x=最後一年,
      y=可支配所得,
      label=所得組
    ),
    nudge_x= -3.8, size=3
  )
3.5 練習
作業2019-10-08,作品001以你認為合理的方式重新設計。
3.6 參考資料
https://www.r-graph-gallery.com/colors.html
https://www.nceas.ucsb.edu/~frazier/RSpatialGuides/colorPaletteCheatsheet.pdf
https://cran.r-project.org/web/packages/colorspace/vignettes/colorspace.html#usage_with_ggplot2
Thinking design by Adobe:
colorspace website: http://colorspace.r-forge.r-project.org/articles/colorspace.html
