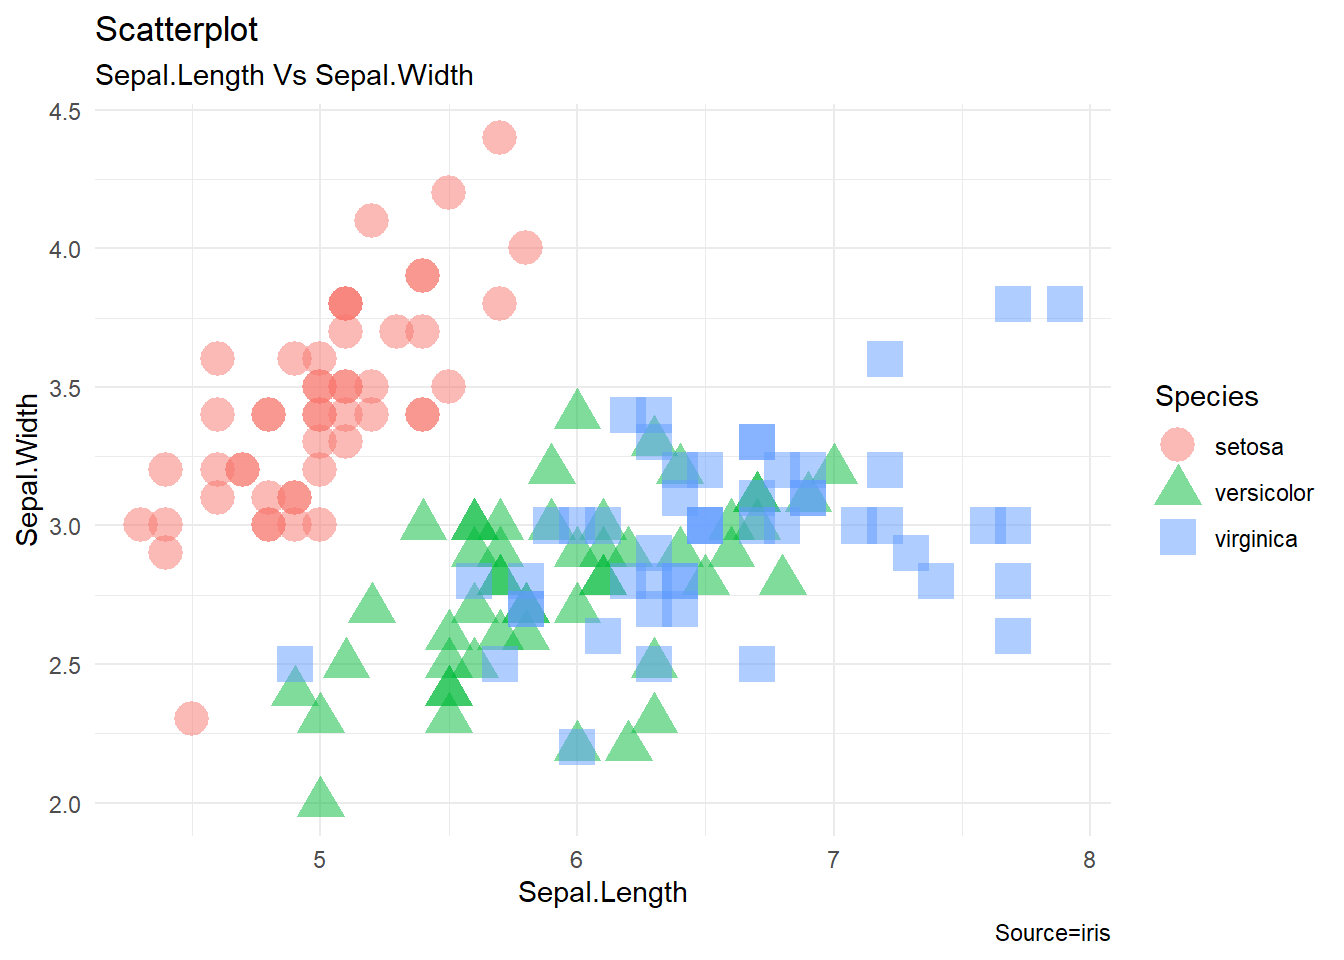
ggplot(iris, aes(Sepal.Length, Sepal.Width, shape=Species, color=Species))+
  geom_point(alpha=0.5, size=6)+
  theme_minimal()+
  labs(title="Scatterplot", subtitle = "Sepal.Length Vs Sepal.Width", caption ="Source=iris")