Chapter 3 problem 3
options(scipen = 999)
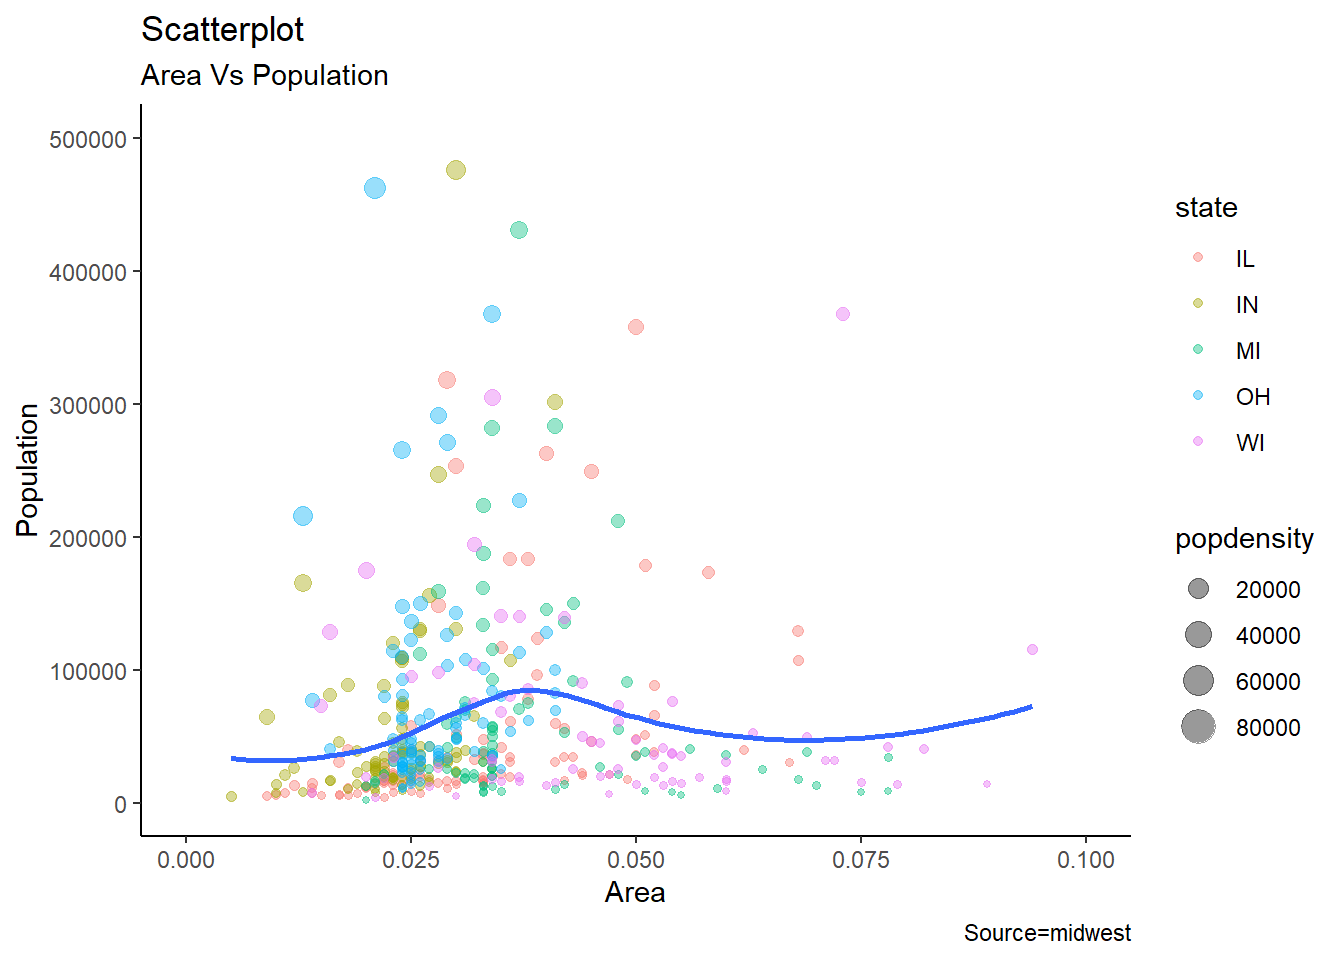
ggplot(data=midwest)+
geom_point(aes(area, poptotal, color=state, size=popdensity), alpha=0.4)+
geom_smooth(aes(area, poptotal),se=FALSE)+
xlim(0,0.1)+
ylim(0,500000)+
theme_classic()+
labs(title="Scatterplot", subtitle = "Area Vs Population", x="Area" , y="Population", caption ="Source=midwest")## `geom_smooth()` using method = 'loess' and formula 'y ~ x'## Warning: Removed 15 rows containing non-finite values (stat_smooth).## Warning: Removed 15 rows containing missing values (geom_point).