Chapter 2 Probelm 2
ggplot(mpg, aes(x=hwy, fill=drv))+
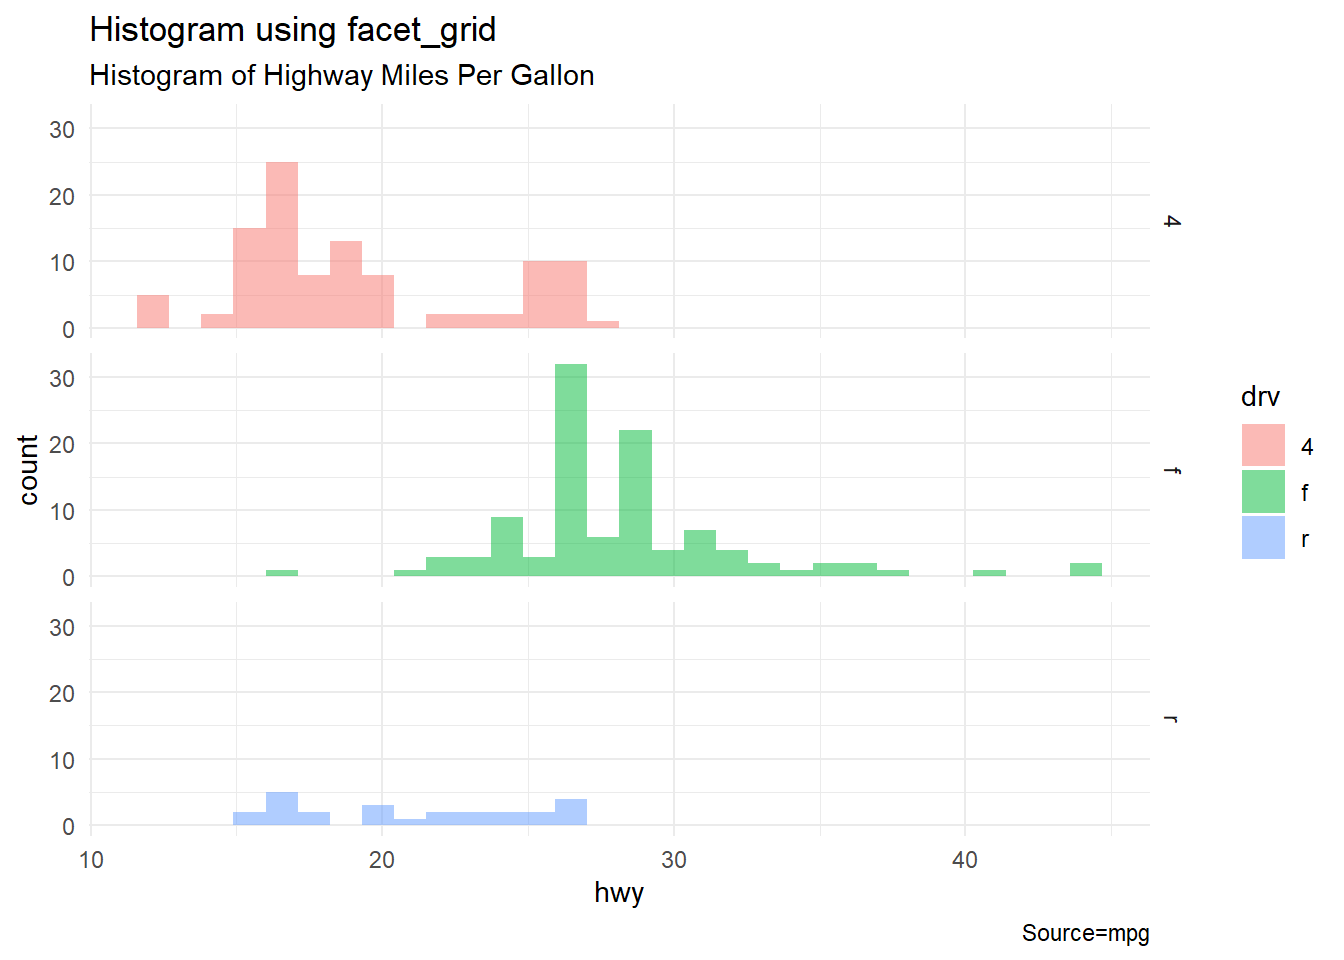
geom_histogram(alpha=0.5)+
facet_grid(drv~.)+
theme_minimal()+
labs(title = "Histogram using facet_grid", subtitle = "Histogram of Highway Miles Per Gallon", x="hwy", y="count",caption ="Source=mpg")## `stat_bin()` using `bins = 30`. Pick better value with `binwidth`.