교육용 프로그램의 이해(1) : HW1
2020-9-26
Chapter 1 Problem 1
library(ggplot2)
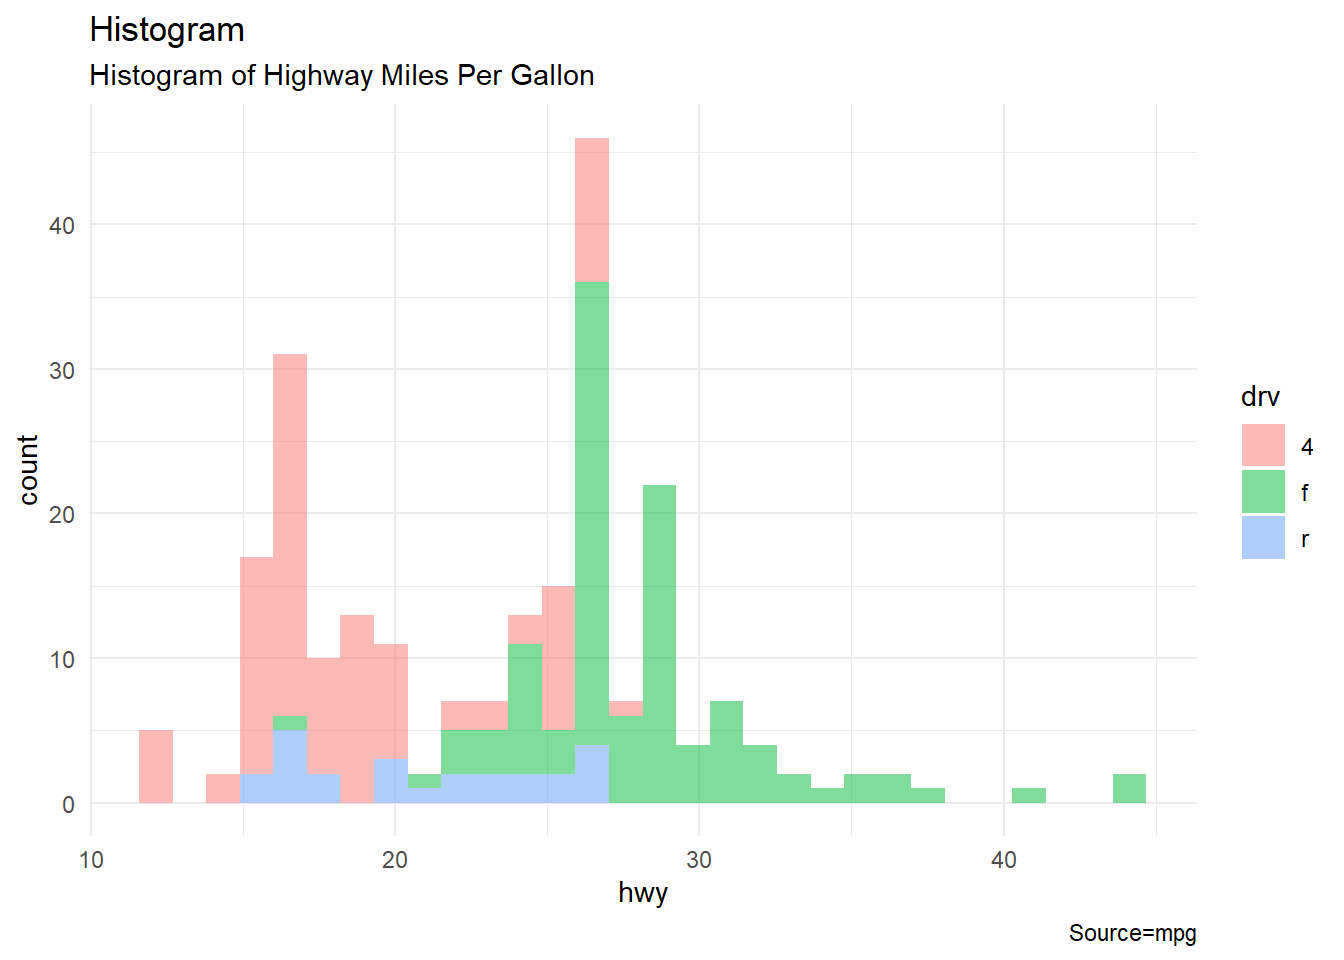
ggplot(mpg, aes(x=hwy, fill=drv))+
geom_histogram(alpha=0.5)+
theme_minimal()+
labs(title = "Histogram", subtitle = "Histogram of Highway Miles Per Gallon", x="hwy", y="count", caption ="Source=mpg")## `stat_bin()` using `bins = 30`. Pick better value with `binwidth`.