Chapter 3 Understanding R’s User Interface
Now that R-Studio is successfully installed, it is time to understand it’s interface. This chapter will walk the reader through R Studio’s user interface. When you first open R-Studio, it has three panes and a tool bar with different functions at the top. It is useful for the reader to click on each to get an understanding of R-Studio’s functionality before getting into an overview of the three different panes.
The toolbar at the top shows tabs for “file,” “edit,” “code,” etc. Although we will not get into each and every one of the tabs in detail, it helps to have a general understanding of the most commonly used tabs for a beginner. Under the “file” tab, there are the usual options for creating and saving files. In addition, the file tab also has the option to open and save “projects.” R-Studio always starts with a project file with extension .proj. This project folder or file loads everything that is connected to the project which include the code used, data, other files such as script and images used when running the project. It also allows for you to keep everything that is related to the project you are working on in that directory, in addition to setting it as the working directory.
The other two tabs that are useful to a beginner are the session tab with options such as allowing you to start a new session of R and a tab for “Tools” that allows for installation of new packages. The rest of the tabs may be ignored by the beginner at this stage.
3.1 Description of Three Panels in User Interface
There are three main panels in R-Studio’s interface as follows as shown in Figure 3.1
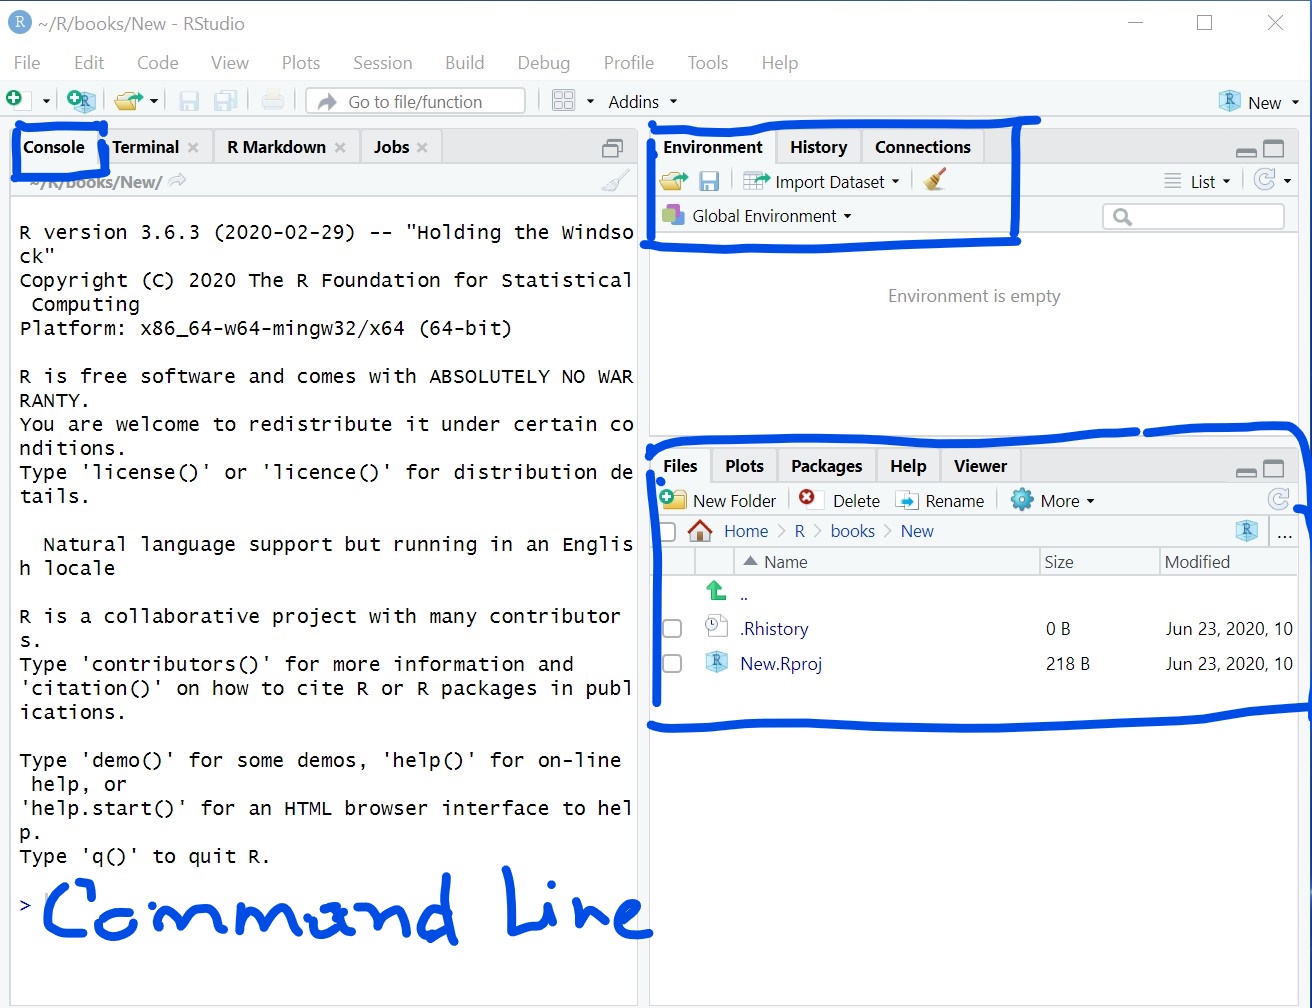
Figure 3.1: Interface for R with Panels
- Console: This is the place to write any code that needs to be run
- Environment: This lists what variables and objects (as referred to in R) are currently available in your working environment. Within the environment window,there are also other tabs such as ‘history’ which shows a history of all code typed in the past. It also has a tab called ‘connection’ which is meant for connecting to specific databases. This tab is not useful to a beginner.
- Viewer: For lack of a better way to refer to the third pane, it is referred to here as ‘viewer.’ However, the third pane has several tabs nested within it. The “files” tab shows all the files and folders in your current directory which the program points to right next to the home icon below the header for the pane. The “plots” tab shows and allows for saving of any plot output. The “packages” tab shows all the packages that are currently installed. As you start using R-Studio, you will find the need to install many packages and R-Studio makes it easy to do so.
Right under the “viewer” tab, the icon for “setting” allows for changing the working directory or to copy and move files. The tab for “packages,” shows all the packages that are installed and available. Clicking on the checkbox next to the name of the package loads the package for use using the following command which will appear in the console pane of the interface.
Library(Package name)
Clicking on the name of the package (under the package tab on the lower right pane) itself brings up the description for what the package does. This is one of the benefits of using R-Studio as opposed to R which makes it easy to look up all the packages available and what each does. Although the description and examples for packages are at times not explicit enough, it is nevertheless a useful starting point for many tasks. The viewer pane tab also makes it easy to install and update packages right from the lower right panel of the user interface.
3.2 Installation and Use of Packages: An Example
As an exercise, click on the package dplyr(Wickham et al. 2020). If it is not available under packages, you may click on install and type in dplyr in to the packages as shown in the Figure 3.2 below.
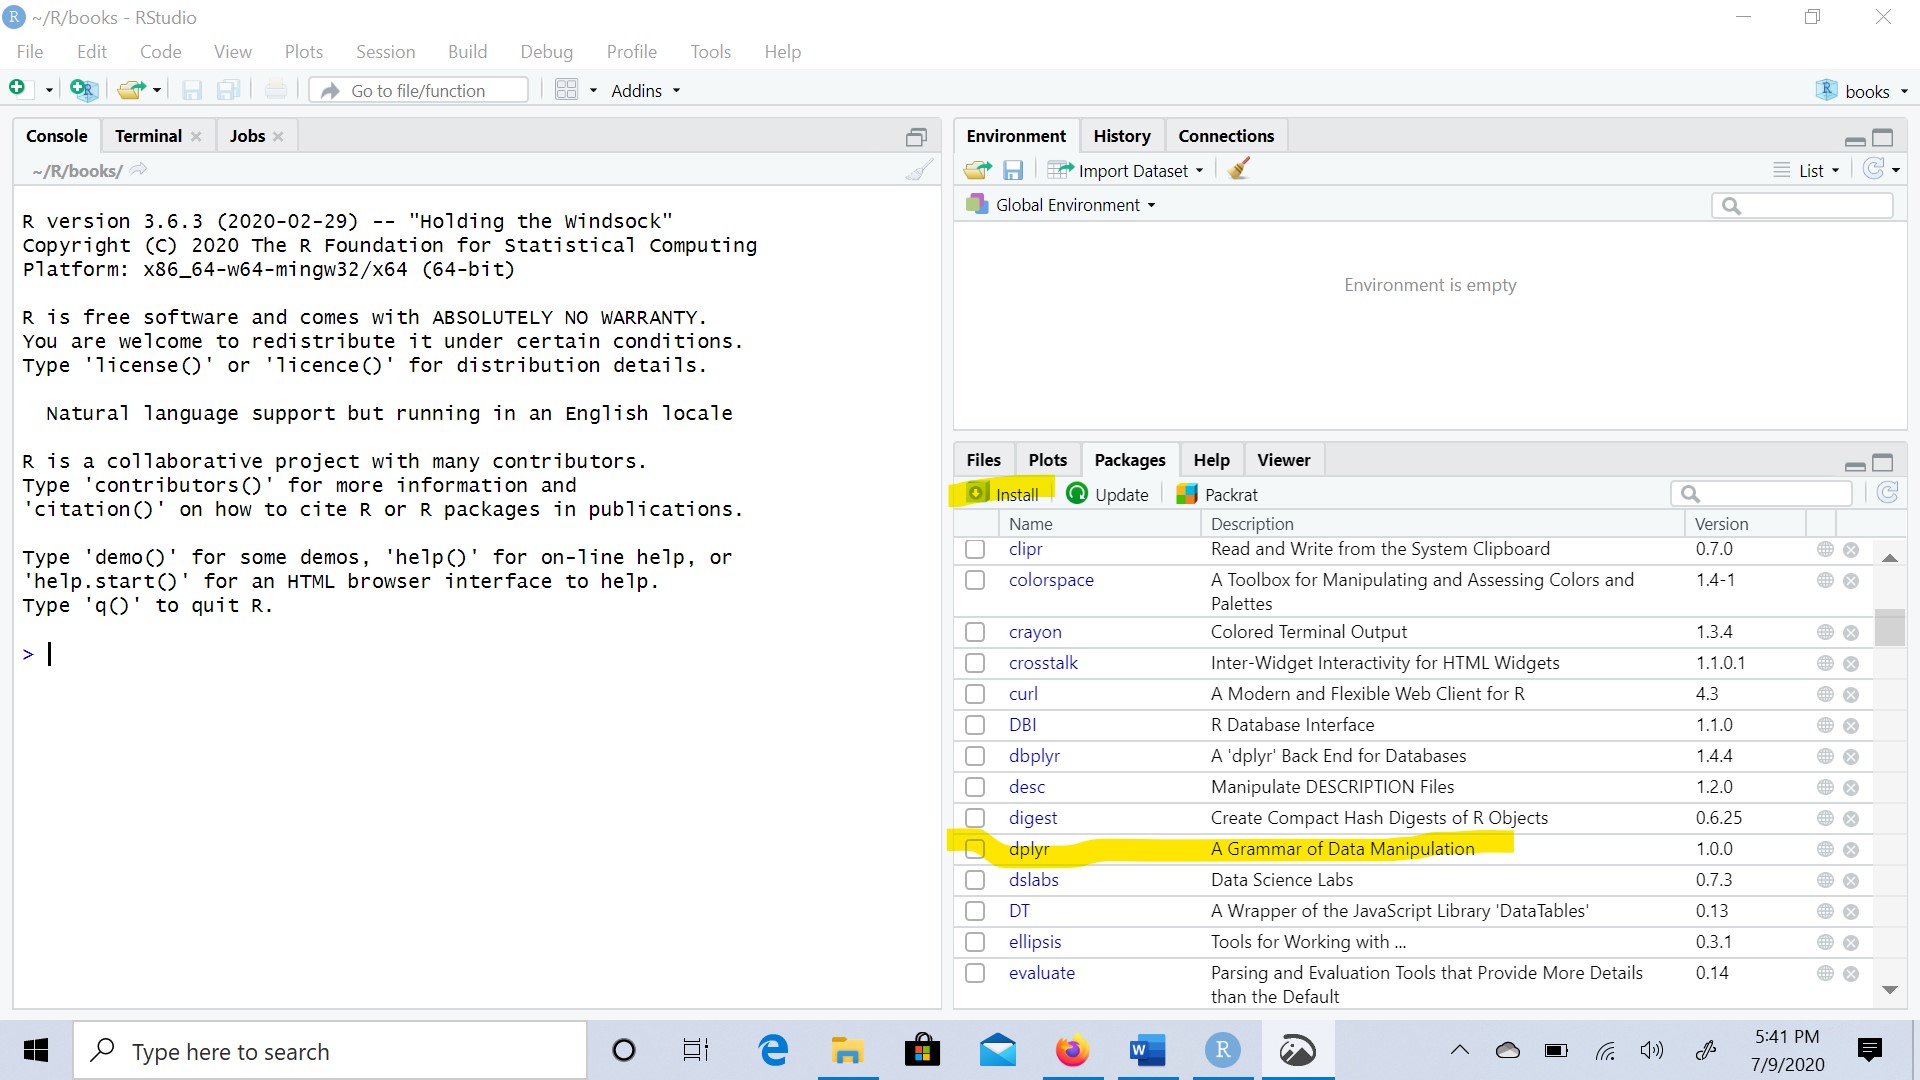
Figure 3.2: Dplyr Package Installation Example
By clicking on the link to the package name from within the “packages” tab in the viewer pane provides an overview of what the package does. Here it is useful to spend some time understanding how to use a package. Clicking on the link provides details on its documentation. Next to the package is the title of the package which states "A Grammar of Data Manipulation." Thus, dplyr is a package that makes data manipulation easier. Clicking on the package link provides an alphabetized list of all that the package does such as a function called "arrange," that allows for data to be arranged in different ways. Another function called "bind," helps to combine multiple data frames (explained in more detail in next chapter - which is data sets arranged in rows and columns) together.
Clicking on the link "bind" provides an explanation for what the function does and the way (syntax) it is used. Understanding the structure of this description is helpful in understanding how to use packages. The description of the function within the package has several parts to it as follows:
Description: The description explains what the function does. The function bind{dplyr} which is in the package dplyr is described as “efficiently bind multiple data frames by row and column.” Thus, this function is useful for combining different datasets in different ways. In addition, it also provides a description of the command used to make this happen such as
do.call(rbind,dfs)
Usage: The second aspect in the description of the function refers to its usage which could be to bind rows or to bind columns of two different data frames.
Arguments: The third part of the structure of a function is referred to as arguments. This describes the objects or variables that this function will operate on such as the data frames to combine (referred to as dfs in the syntax under the section on description above).
Example: Typically any description of what a function does is accompanied by an example of how to use it. For example, the bind function shows an example of combining two data frames called “one” and “two” each of which has 4 rows of numbers and one column each. Thus, combining the two by rows yields a dataframe with 8 rows and one column.
Thus, understanding how to install a package, the functions it is capable of, along with the examples its description provides makes R very versatile for the user. In the next chapter, we will learn how to use R and its basic functions.
References
Wickham, Hadley, Romain François, Lionel Henry, and Kirill Müller. 2020. Dplyr: A Grammar of Data Manipulation. https://CRAN.R-project.org/package=dplyr.