Chapter 3 Precipitation
We will now analyze the relationship between precipitation and wildfires. We believe years with low precipitation may have an increased risk of wildfire. To analyze this, we will use the previously seen data on the number of wildfires and the area of land burned annually in the U.S. along with data on the annual precipitation in the U.S.. The plot below shows the annual precipitation from 1983 to 2020. The white line shows the average precipitation from this period. The years with high precipitation (more than 2 inches above average) are shown with blue points and the years with low precipitation (more than 2 inches below average) are shown with pink points.
# Libraries needed

library(dplyr)
library(ggplot2)
library(readr)
library(tidytext)
library(magrittr)
## reading csv
rf_data <- read_csv("rainfall_data.csv")
## get some more data
avg_rf<-mean(rf_data$`Precipitation (Inches)`)
high_rf<-filter(rf_data,`Precipitation (Inches)`>32.1)
low_rf<-filter(rf_data,`Precipitation (Inches)`<28.1)
## plot it
ggplot(rf_data,aes(Year,`Precipitation (Inches)`))+
geom_ribbon(aes(ymin=22,ymax=`Precipitation (Inches)`),fill="lightblue3",alpha=0.3)+
geom_line(size=0.8)+
geom_hline(yintercept=avg_rf,size=0.8,color="white")+
annotate("text",x=2012,y=30.7,label="Average Precipitation (31.1)",color="white",size=5)+
geom_point(data=high_rf,color="darkblue",size=3)+
geom_point(data=low_rf,color="maroon4",size=3)+
theme_dark()+
lims(x=c(1983,2020))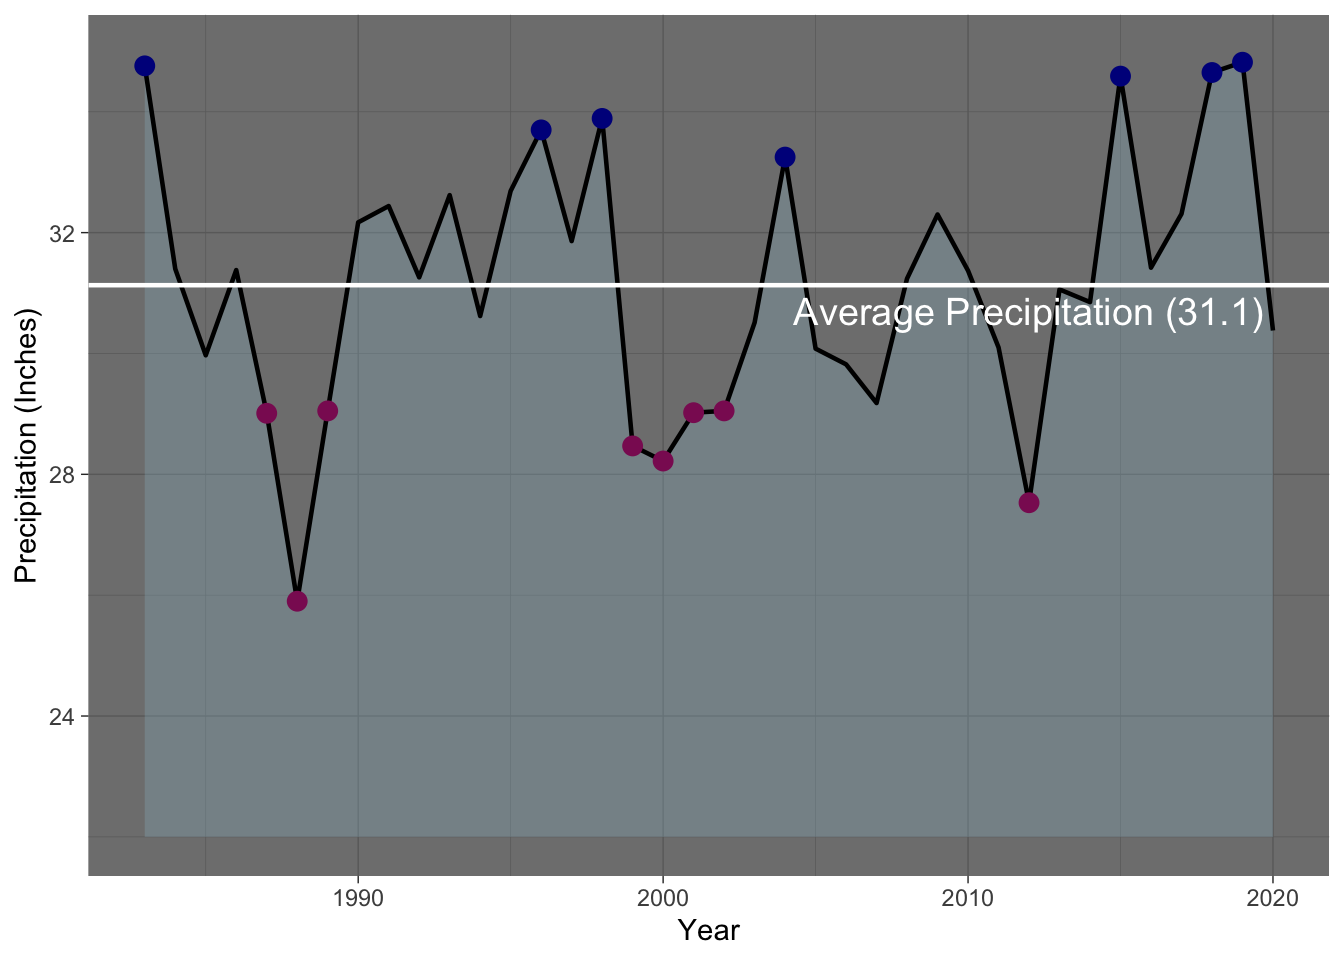
The plot shows relatively consistent data with a few years with particularly high or low precipitation. The year with the lowest precipitation was 1988. This year also had a high number of acres burned when compared to years shortly before and after. This also happens in 2012, so this may show a correlation between years with low rainfall and acres burned. To further analyze this, I have plotted the relationship between the annual precipitation and wildfires. The first plot shows the number of acres burned by fires each year. The second plot shows the number of fires annually.
## wf data
rf_wf_df<-read_excel("rf_wf_df.xlsx")
rf_wf_df%<>%as.data.frame()

## plot it
ggplot(rf_wf_df,aes(`Precipitation(Inches)`,`Acres Burned`))+
  geom_point(color="lightgreen",size=2)+
  theme_dark()
ggplot(rf_wf_df,aes(`Precipitation(Inches)`,Fires))+
  geom_point(color="gold",size=2)+
  theme_dark()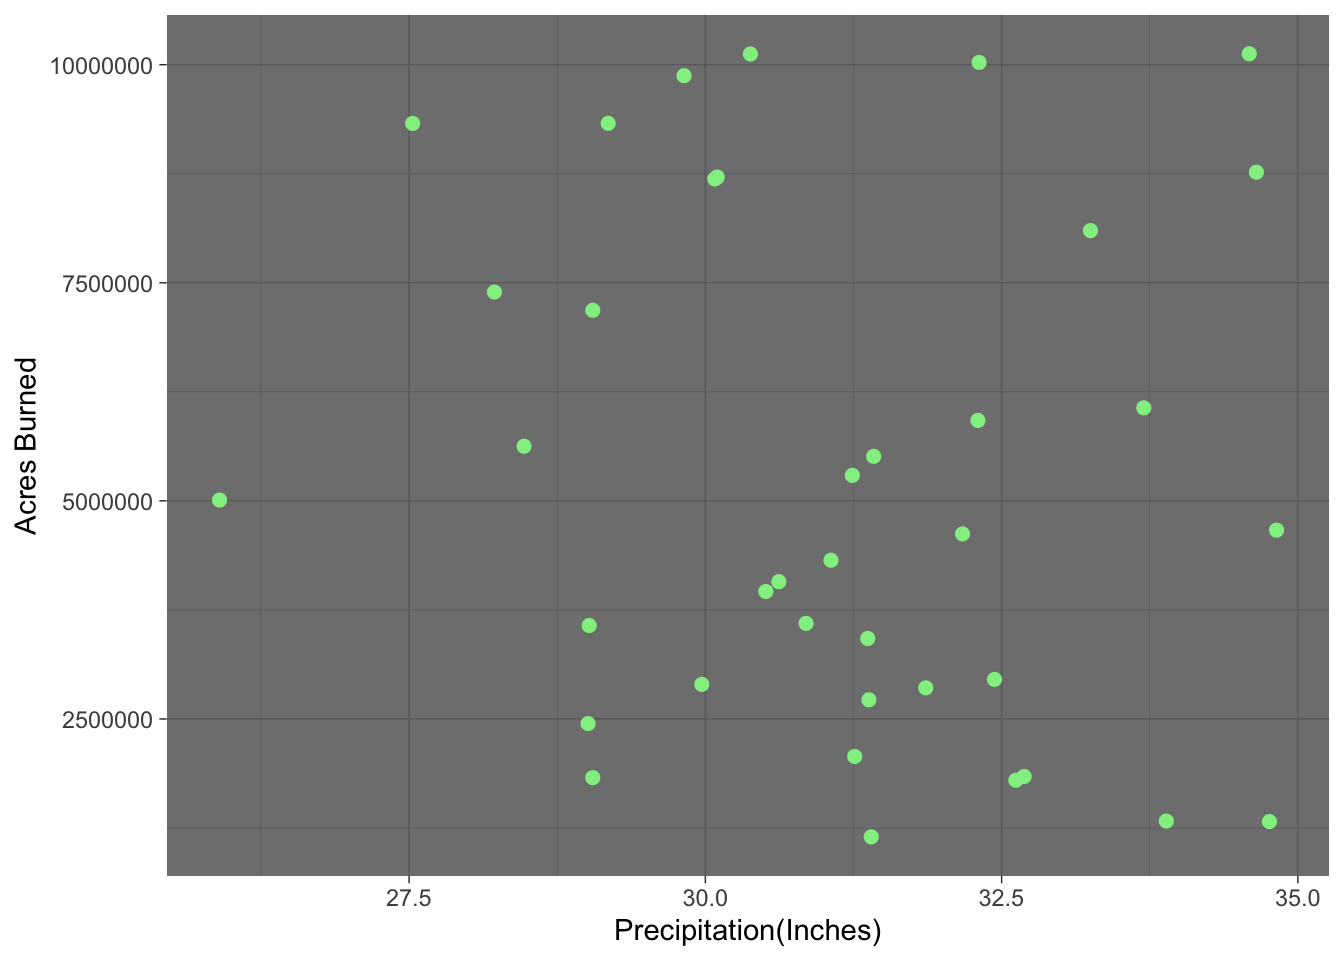
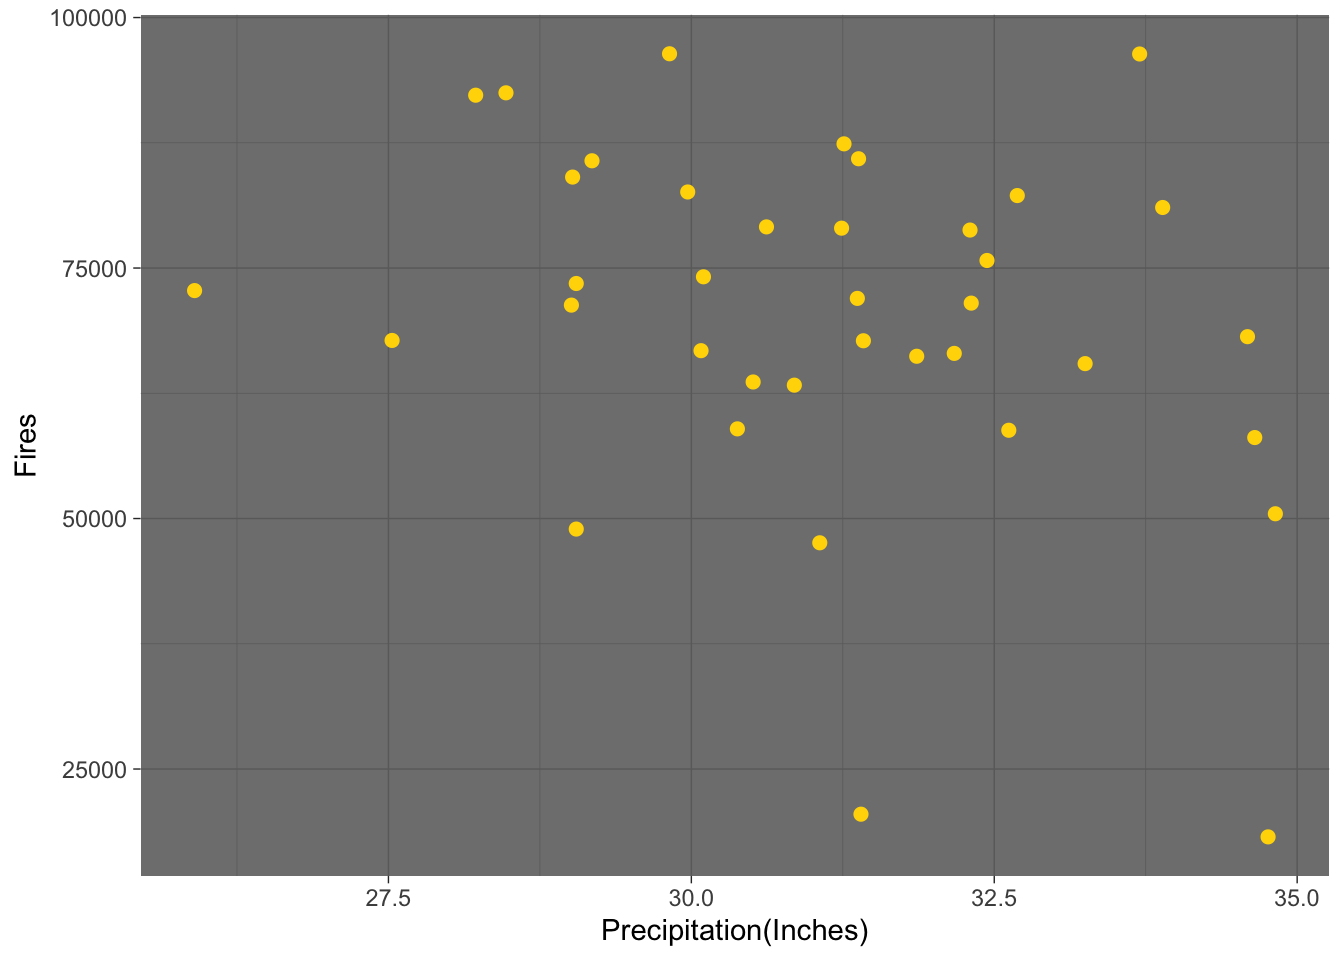
We expected years with low rainfall to have a higher number of fires or a higher amount of land burned. However, the plots show no clear relationship between precipitation and wildfires. The area burned and number of fires seems to be independent from the amount of precipitation.