A Minimal Book Example
2023-08-15
Chapter 1 Wildfires
1.0.1 What are Wildfires?
Wildfires are uncontrolled fires that burn off vegetation. They are a natural part of the ecosystem, but in recent years, have become extremely destructive, causing damage to habitats, homes, and humans.
1.0.2 Why are Wildfires Important?
Wildfires currently have a bad reputation, but it is not their fault. In a ideal natural environment, wildfires are key for nutrient cycling, forest regeneration, and ecological balance.
1.0.3 Wildfires in Recent Years:
In recent years, wildfires have changed from an essential part of our ecosystems to unnatural and destructive disasters. Increasingly, the causes of wildfires are from humans, whether its from a gender reveal party gone wrong, or a cigarette thrown away to early. Due to exacerbated conditions from climate change, these mundane causes lead to humongous fires that burn down entire forests and cities. The rate of wildfires are also increasing, and wildfire season is becoming a common term. I am writing this here
1.0.4 How do Wildfires Relate to Climate Change?
Climate change is increasing the frequency and severity of wildfires. Rising temperatures and prolonged droughts create drier conditions, making it easier for wildfires to start and spread. This contributes to larger, more intense fires that pose greater risks to communities and ecosystems. Climate change exacerbates wildfires, making them more frequent and harder to control.
1.1 This Project:
This project aims to explore the different factors that influence wildfires. After a Literature Review and exploring the different data available to us, we decided to investigate these four factors:
Temperature XXX data set: A little about temp and the data set
Rainfall XXX data set: A little about rainfall and the data set
Lightning XXX data set: A little about lightning and the data set
Tourism/Visitation XXX data set: A little about tourism and the data set
To investigate these factors, their data sets will be combined with our wildfire data set. XXX These combined data sets will be explored and analyzed to produce data-driven conclusions
This wildfire data set has data from 1983 to 2020. For every year, it has the amount of wildfires that occurred in America that year, the amount of acres that were burnt from the fires that year, and the amount of money the Forest Service and the Department of Interior paid to combat and mitigate fires.
1.2 Preliminary Data Analysis
##
## Attaching package: 'dplyr'
## The following objects are masked from 'package:stats':
##
## filter, lag## The following objects are masked from 'package:base':
##
## intersect, setdiff, setequal, union## Rows: 36 Columns: 6
## ── Column specification ────────────────────────────────────────────────────────
## Delimiter: ","
## chr (3): ForestService, DOIAgencies, Total
## dbl (1): Year
## num (2): Fires, Acres
##
## ℹ Use `spec()` to retrieve the full column specification for this data.
## ℹ Specify the column types or set `show_col_types = FALSE` to quiet this message.## # A tibble: 6 × 6
## Year Fires Acres ForestService DOIAgencies Total
## <dbl> <dbl> <dbl> <chr> <chr> <chr>
## 1 1985 82591 2896147 $161,505,000 $78,438,000 $239,943,000
## 2 1986 85907 2719162 $111,625,000 $91,153,000 $202,778,000
## 3 1987 71300 2447296 $253,657,000 $81,452,000 $335,109,000
## 4 1988 72750 5009290 $429,609,000 $149,317,000 $578,926,000
## 5 1989 48949 1827310 $331,672,000 $168,115,000 $499,787,000
## 6 1990 66481 4621621 $253,700,000 $144,252,000 $397,952,000#Setting up easier column names
colnames(wf)[4] ="ForestService"
colnames(wf)[5] ="DOI"
colnames(wf)[6] ="Total"## # A tibble: 6 × 6
## Year Fires Acres ForestService DOI Total
## <dbl> <dbl> <dbl> <chr> <chr> <chr>
## 1 1985 82591 2896147 $161,505,000 $78,438,000 $239,943,000
## 2 1986 85907 2719162 $111,625,000 $91,153,000 $202,778,000
## 3 1987 71300 2447296 $253,657,000 $81,452,000 $335,109,000
## 4 1988 72750 5009290 $429,609,000 $149,317,000 $578,926,000
## 5 1989 48949 1827310 $331,672,000 $168,115,000 $499,787,000
## 6 1990 66481 4621621 $253,700,000 $144,252,000 $397,952,000# Converting data with commas and dollar signs to numerical values
wf <- wf %>%
mutate(ForestService = as.numeric(gsub("[^0-9.]", "", ForestService)))
wf <- wf %>%
mutate(DOI = as.numeric(gsub("[^0-9.]", "", DOI)))
wf <- wf %>%
mutate(Total = as.numeric(gsub("[^0-9.]", "", Total)))## # A tibble: 6 × 6
## Year Fires Acres ForestService DOI Total
## <dbl> <dbl> <dbl> <dbl> <dbl> <dbl>
## 1 1985 82591 2896147 161505000 78438000 239943000
## 2 1986 85907 2719162 111625000 91153000 202778000
## 3 1987 71300 2447296 253657000 81452000 335109000
## 4 1988 72750 5009290 429609000 149317000 578926000
## 5 1989 48949 1827310 331672000 168115000 499787000
## 6 1990 66481 4621621 253700000 144252000 397952000# Plotting the amount of money spent on Wildfires in America from 1983 to 2020
ggplot(wf, aes(x = Year, y = Total)) + geom_point(col = 'red') +
geom_smooth(formula = y ~ x, method = lm, col = 'orange') +
xlab("Year") + ylab('Total Money Spent on Wildfires') +
scale_y_continuous(labels = scales::comma)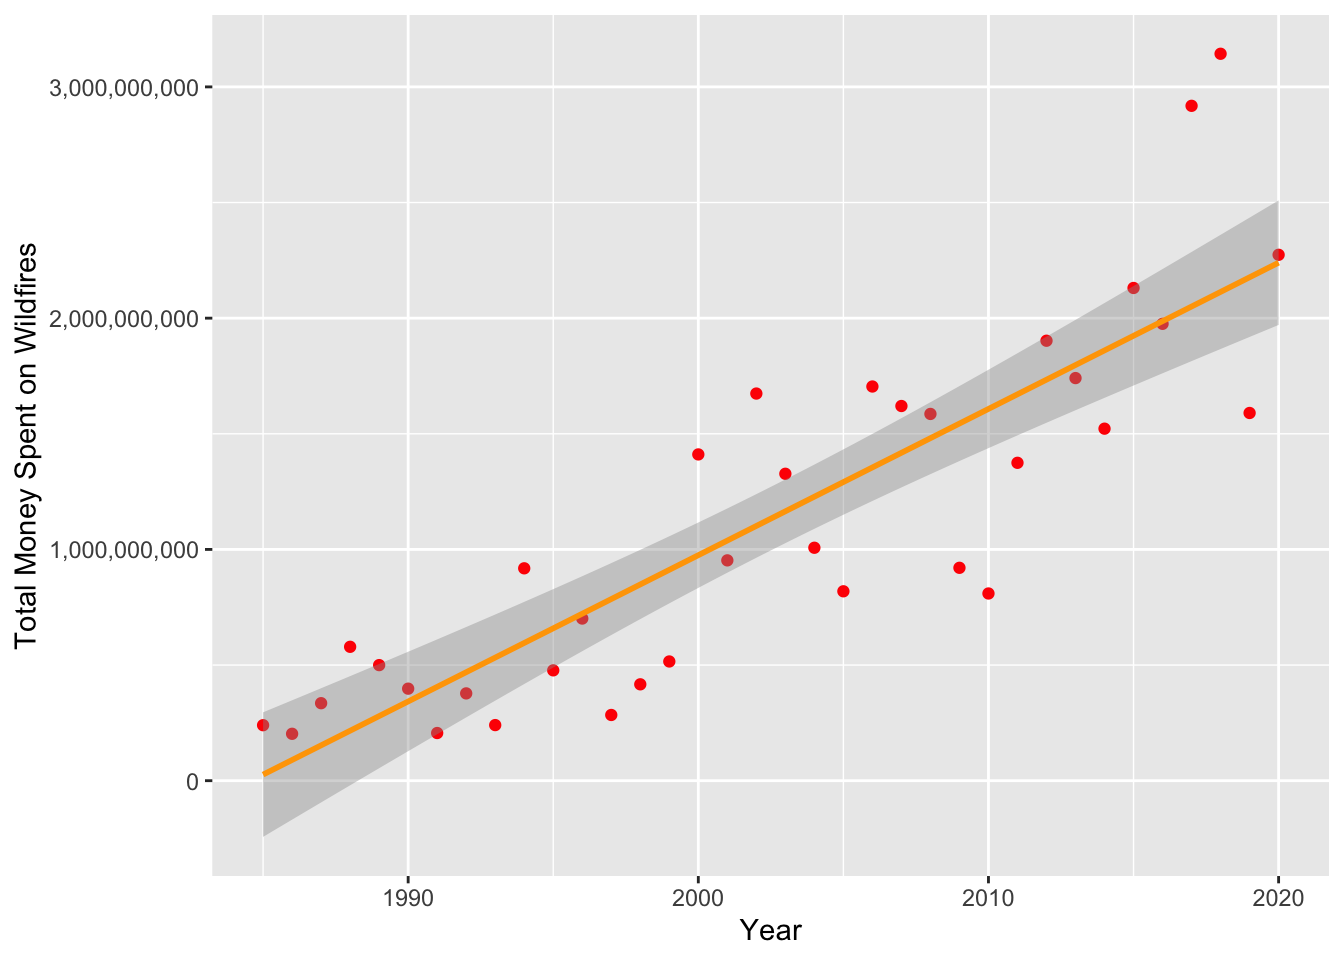 The amount of money spent on Wildfires every year has dramatically increased.
# Plotting the amount of fires that occurred every year in America from 1983 to 2020

ggplot(wf, aes(x = Year, y = Total)) + geom_point(col = 'red') +
  geom_smooth(formula = y ~ x, method = lm, col = 'orange') +
  xlab("Year") + ylab('Total Money Spent on Wildfires') +
  scale_y_continuous(labels = scales::comma)
The amount of fires occuring every year has slightly decreased recently.
# Plotting the amount of acres burned from Wildfires every year in America from 1983 to 2020
ggplot(wf, aes(x = Year, y = Acres)) + geom_point(col = 'red') +
geom_smooth(formula = y ~ x, method = lm, col = 'orange') +
xlab("Year") + ylab('Total Acres Burned from Wildfires') +
scale_y_continuous(labels = scales::comma)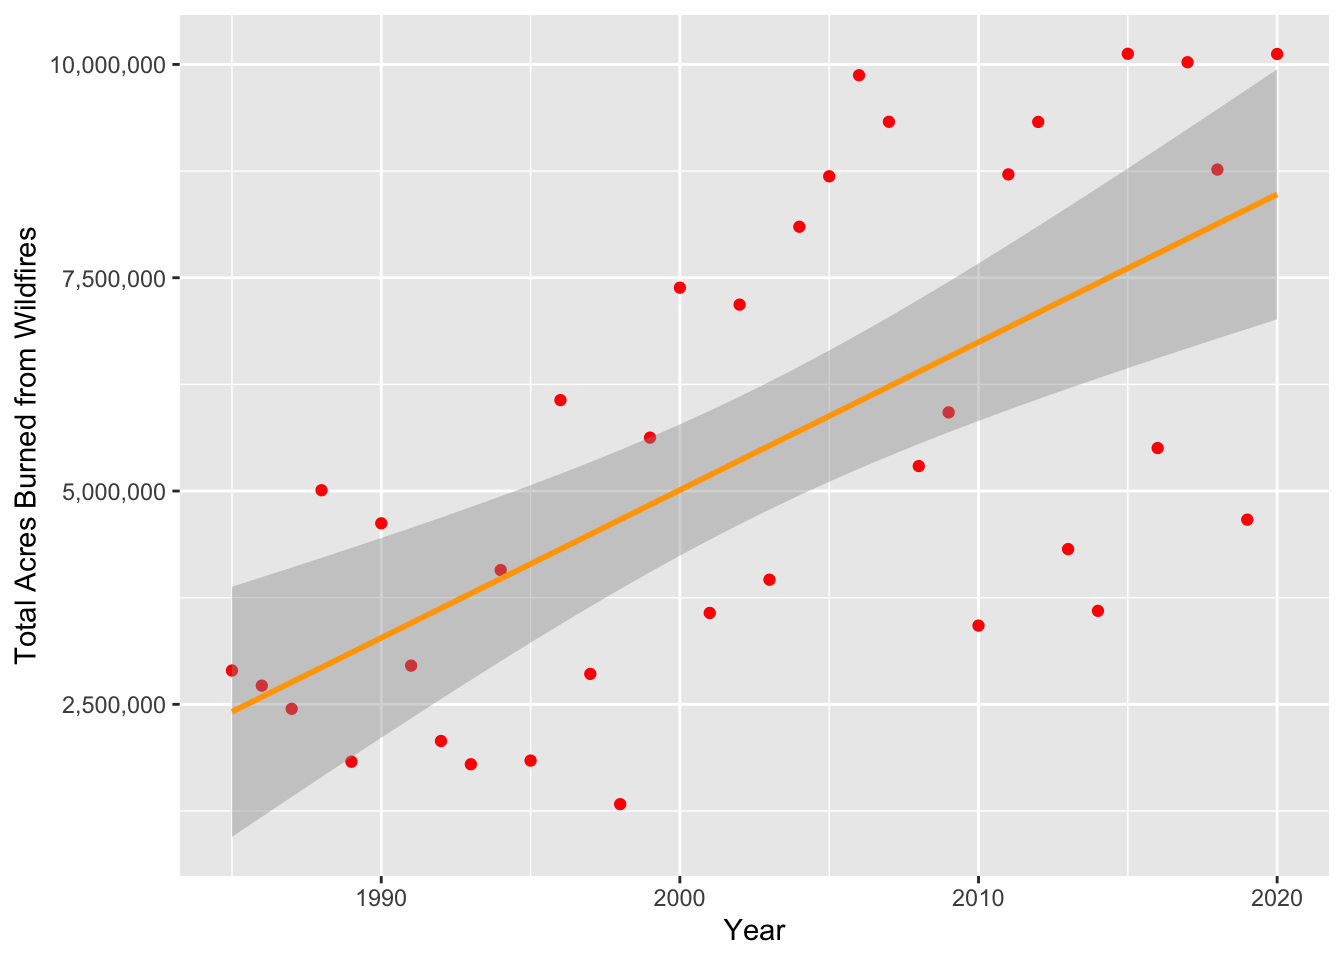 The amount of acres burned every year due to Wildfires has increased dramatically.
From an analysis of just our wildfire dataset, we conclude that:
Wildfire costs are at an all time high, and although the number of wildfires occurring every year might be slightly declining, the number of acres that these fires burn every year is increasing.