Campers
# Libraries needed
library(dplyr)
library(ggplot2)
library(readr)
library(tidytext)
library(magrittr)
# Importing dataset
setwd('~/workspace/bookdown-demo-main')
camp = read_csv('camp.csv')
## New names:
## Rows: 395 Columns: 122
## ── Column specification
## ──────────────────────────────────────────────────────── Delimiter: "," chr
## (2): Park Name, Park Type dbl (119): 2022, 2021, 2020, 2019, 2018, 2017, 2016,
## 2015, 2014, 2013, 2012,... lgl (1): ...5
## ℹ Use `spec()` to retrieve the full column specification for this data. ℹ
## Specify the column types or set `show_col_types = FALSE` to quiet this message.
## • `` -> `...5`
wf_for_camp = read_csv('wf.csv')
## Rows: 36 Columns: 6
## ── Column specification ────────────────────────────────────────────────────────
## Delimiter: ","
## dbl (6): Year, Fires, Acres, ForestService, DOI, Total
##
## ℹ Use `spec()` to retrieve the full column specification for this data.
## ℹ Specify the column types or set `show_col_types = FALSE` to quiet this message.
# Filter years from 2019 to 1999
years_camp <- camp %>% select(`Park Name`, `2019`:`1999`)

filtered_camp <- na.omit(years_camp)

df <- data.frame(colSums(Filter(is.numeric, filtered_camp)))

df$Year = c(2019:1999)

colnames(df)[1] ="Visitation"
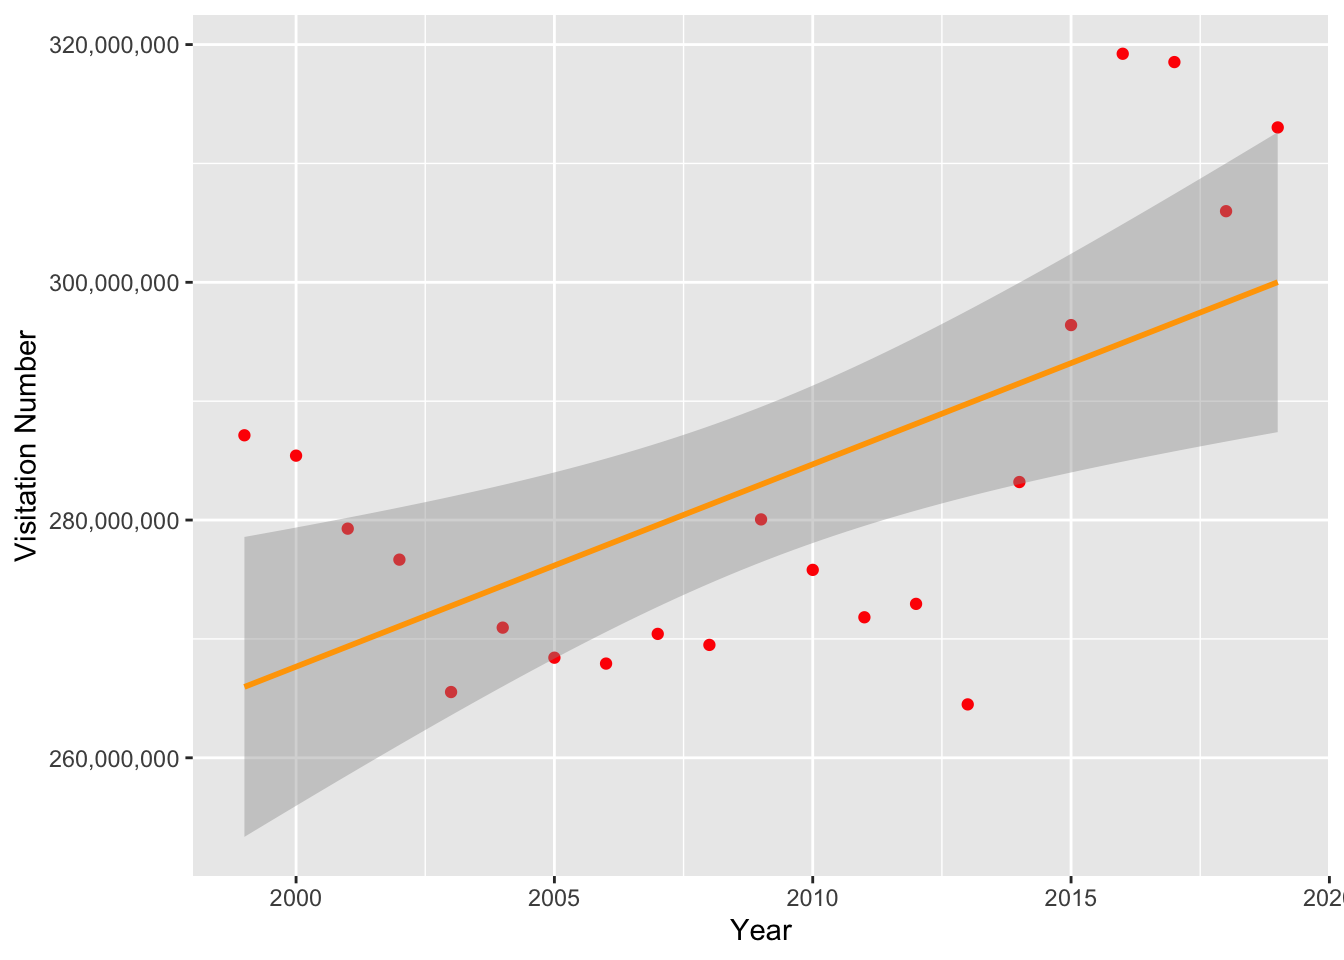
ggplot(df, aes(x = Year, y = Visitation)) + geom_point(col = 'red') +
  geom_smooth(formula = y ~ x, method = lm, col = 'orange') +
  xlab("Year") + ylab('Visitation Number') +
  scale_y_continuous(labels = scales::comma)
wf2 <- wf_for_camp %>%  filter(Year >= 1999 & Year < 2020)

df_final <- merge(wf2, df, by = 'Year')
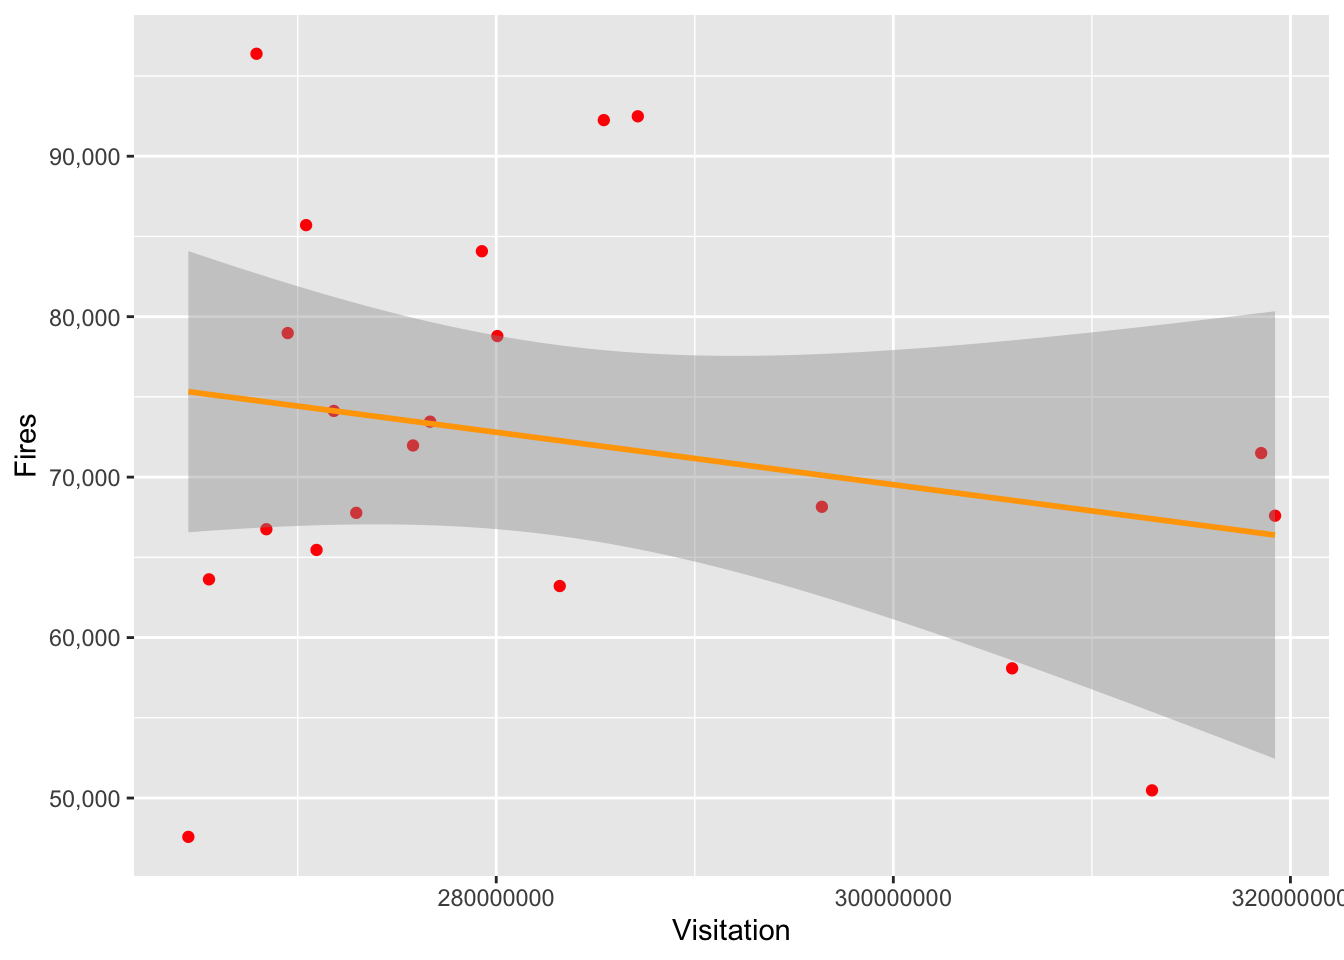
ggplot(df_final, aes(x = Visitation, y = Fires)) + geom_point(col = 'red') +
  geom_smooth(formula = y ~ x, method = lm, col = 'orange') +
  xlab("Visitation") + ylab('Fires') +
  scale_y_continuous(labels = scales::comma)
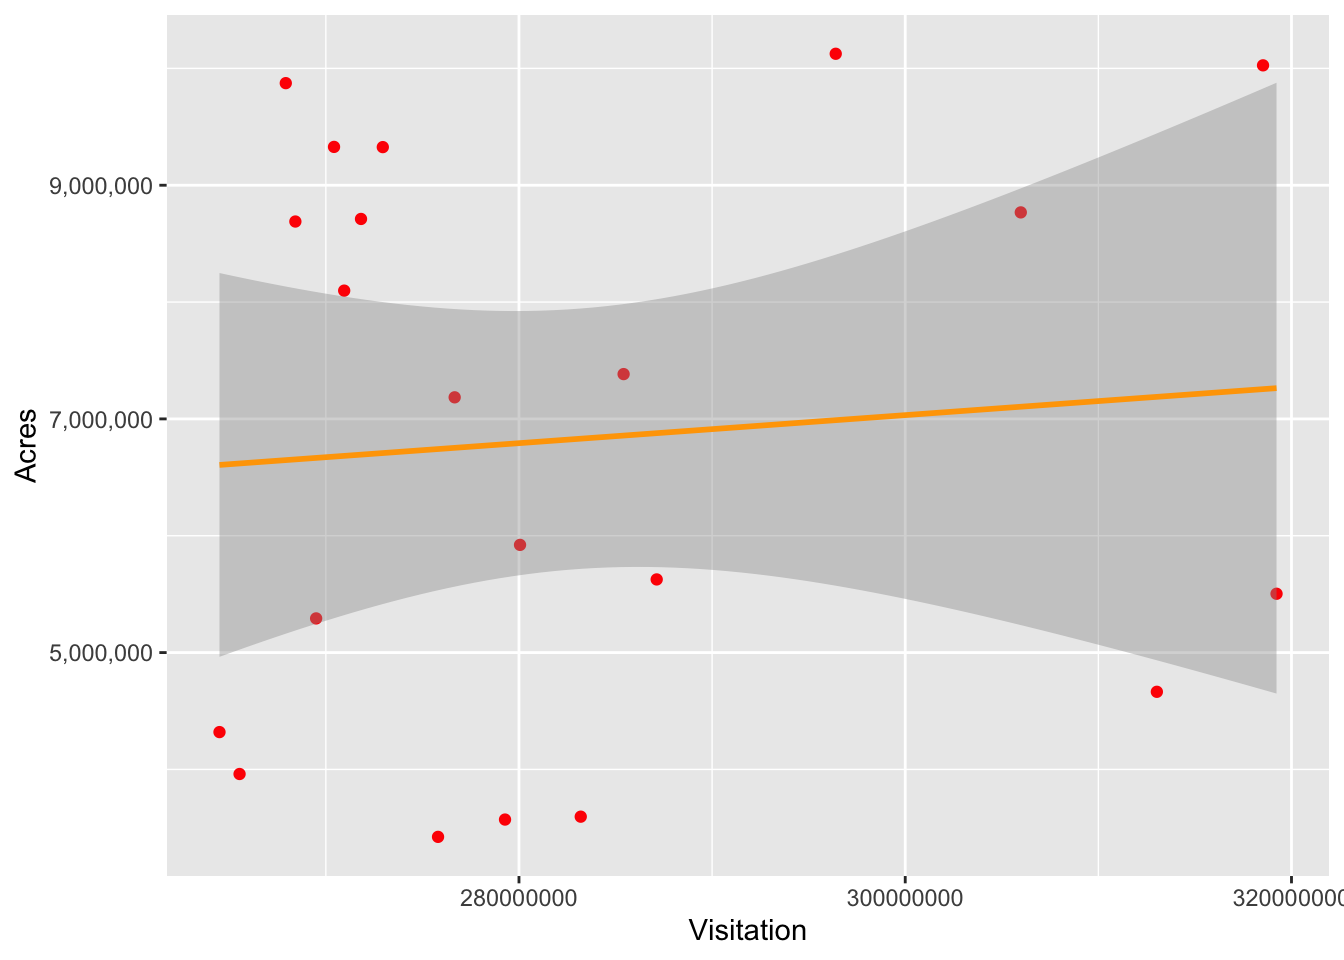
ggplot(df_final, aes(x = Visitation, y = Acres)) + geom_point(col = 'red') +
  geom_smooth(formula = y ~ x, method = lm, col = 'orange') +
  xlab("Visitation") + ylab('Acres') +
  scale_y_continuous(labels = scales::comma)
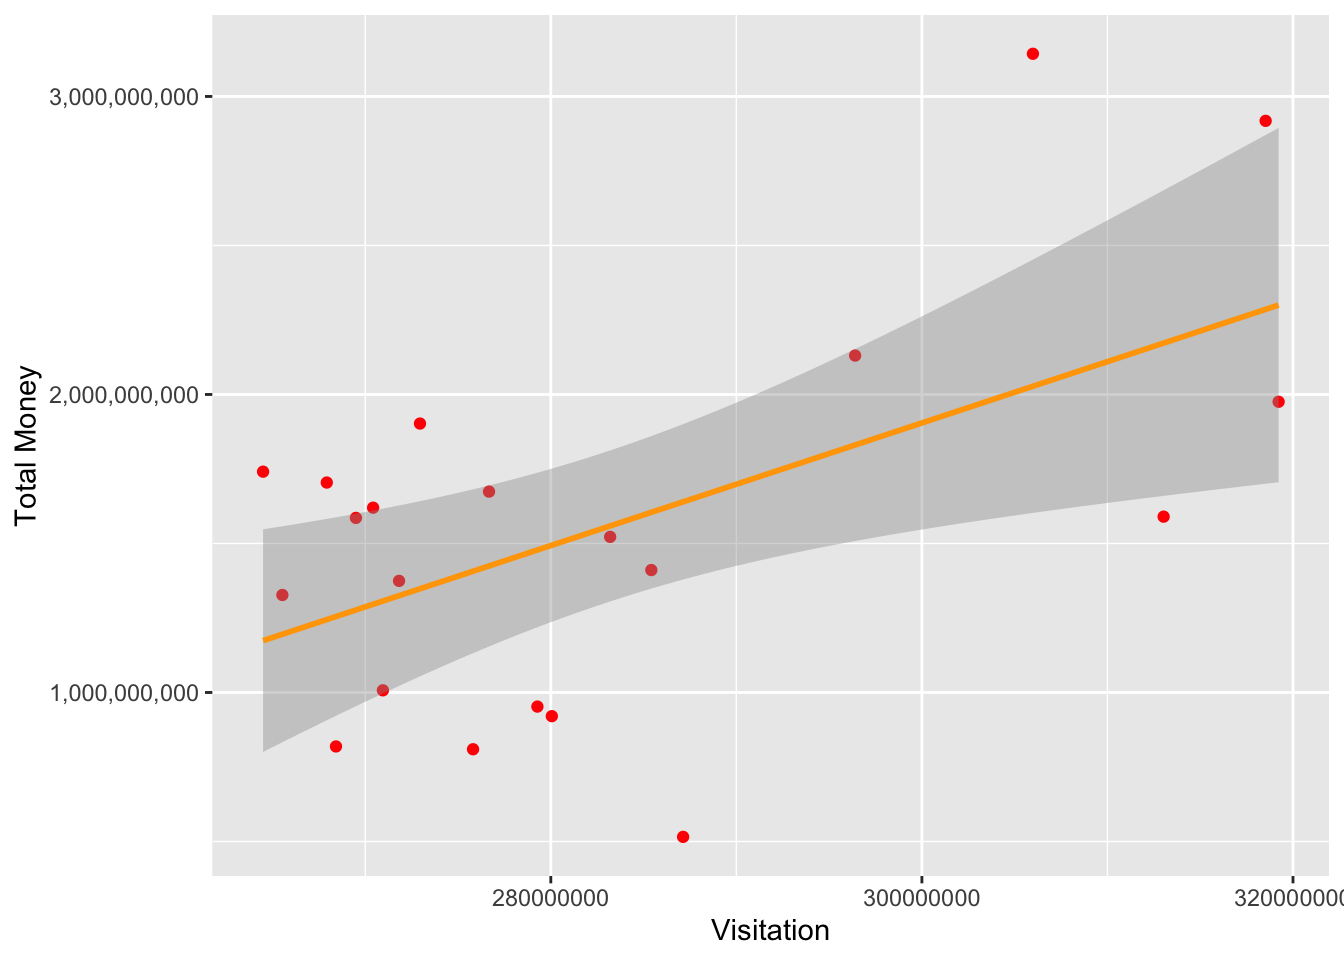
ggplot(df_final, aes(x = Visitation, y = Total)) + geom_point(col = 'red') +
  geom_smooth(formula = y ~ x, method = lm, col = 'orange') +
  xlab("Visitation") + ylab('Total Money') +
  scale_y_continuous(labels = scales::comma)