2 The Data
“In God we trust. All others must bring data.” – W. Edwards Deming, statistician, professor and author.
I gathered the data used in this project from the open data website of the Town Hall of Gijón https://transparencia.gijon.es/. The data can be downloaded from here:
I downloaded 18 csv files with air pollution and weather data of Gijón from years 2000 to 2017. I saved them in the “data” project folder. I downloaded two more files from this web, a csv file with the description of the variables and another csv file with information about the measurement stations.
There are more csv files, with new variables, created ad hoc for the visualizations on my Tableau Public site. They are described in the ‘Visualizations’ section of this document.
All the data files are in the Github repository project, except the final dataset in csv format “air_data_2.csv”, because the Github file size limits (but there is a rds version of this file in the project folder “data_rds”). Nevertheless I uploaded this file to Kaggle..
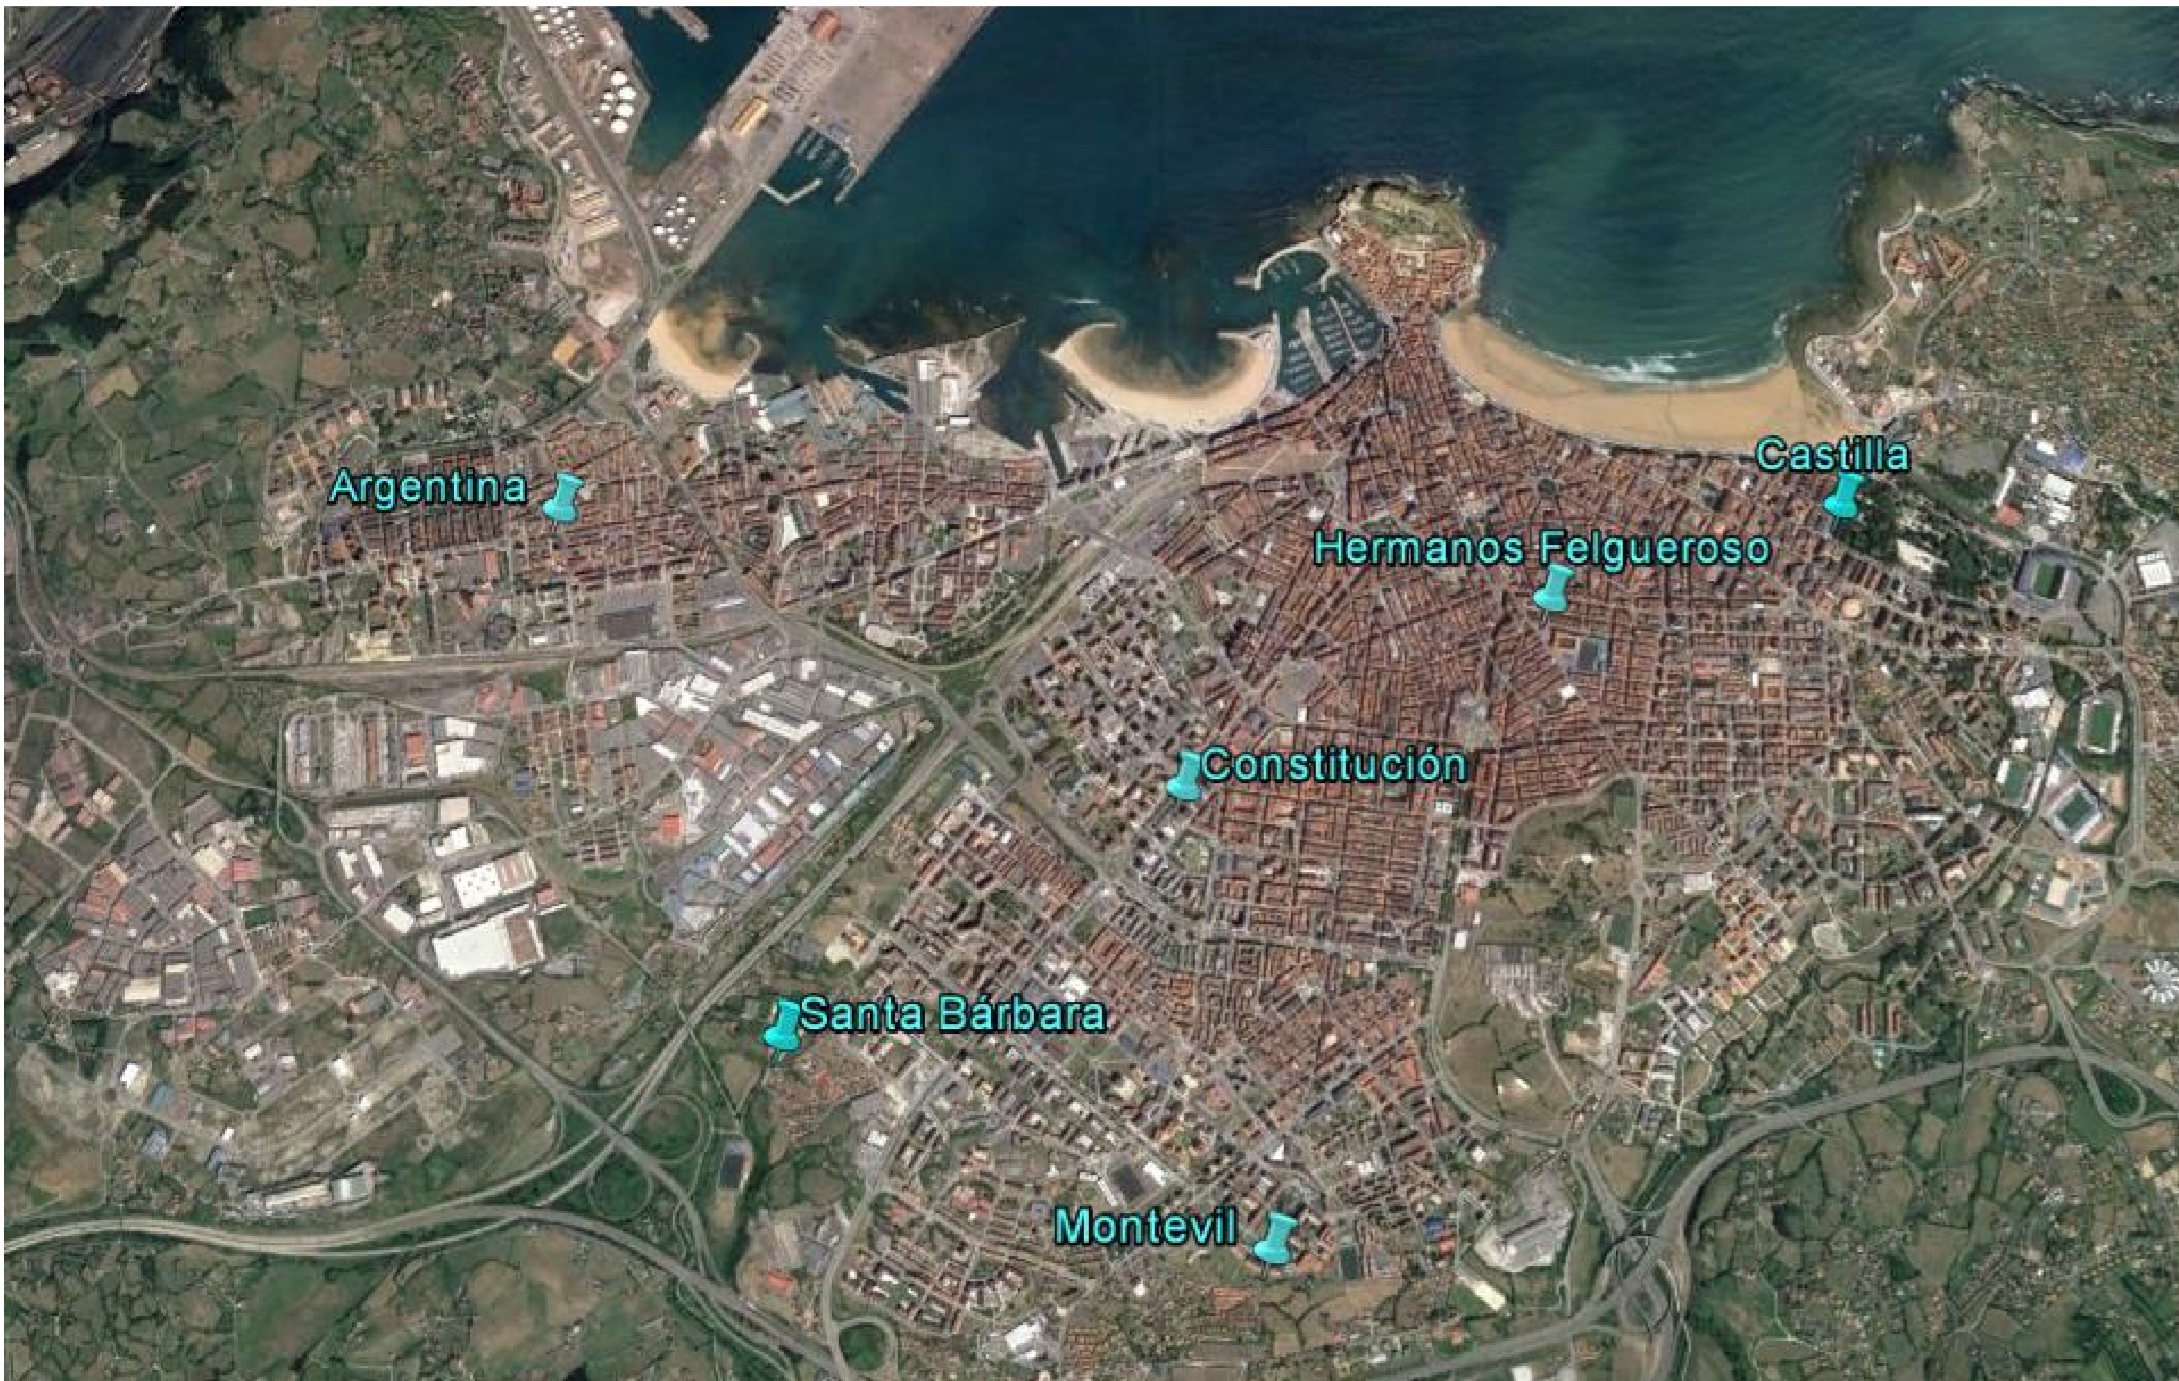
Image source: “Informe de calidad del aire del Principado de Asturias (2016)”.
These are the original fields from the 18 csv files downloaded:
- Estación: Station id.
- Título: Station name.
- latitud: Latitude.
- longitud: Longitude.
- date_time_utc: Date Time UTC.
- date_time_utc: Date Time UTC.
- SO2: SO2 concentration (µg/m³).
- NO: NO concentration (µg/m³).
- NO2: NO2 concentration (µg/m³).
- CO: NO2 concentration (mg/m³).
- PM10: Particulate Matter (<10 µg/m³).
- O3: Ozone concentration (µg/m³).
- dd: Wind direction (degrees).
- vv: Wind speed (m/s).
- TMP: Dry temperature (ºC).
- HR: Relative humidity (%rh).
- PRB: Atmospheric pressure (mb).
- RS: Solar radiation (W/m²).
- LL: Rainfall (l/m²).
- BEN: Benzene concentration (µg/m³).
- TOL: Toluene concentration (µg/m³).
- MXIL: M-Xylene (µg/m³).
- PM25: Particulate Matter (<2.5 µg/m³).
And these are the fields of the final file ‘air_data_2.csv’ (or ‘air_data_2.rds’):
- station: Station id.
- station_name: Station name.
- latitude: Latitude.
- longitude: Longitude.
- date_time_utc: Date Time UTC.
- SO2: SO2 concentration (µg/m³).
- NO: NO concentration (µg/m³).
- NO2: NO2 concentration (µg/m³).
- CO: NO2 concentration (mg/m³).
- PM10: Particulate Matter (<10 µg/m³).
- O3: Ozone concentration (µg/m³).
- dd: Wind direction (degrees).
- vv: Wind speed (m/s).
- TMP: Dry temperature (ºC).
- HR: Relative humidity (%rh).
- PRB: Atmospheric pressure (mb).
- RS: Solar radiation (W/m²).
- LL: Rainfall (l/m²).
- BEN: Benzene concentration (µg/m³).
- TOL: Toluene concentration (µg/m³).
- MXIL: M-Xylene (µg/m³).
- PM25: Particulate Matter (<2.5 µg/m³).
- station_alias: Station alias (new variable).
- year: Year (new variable).
- month: Month (new variable).
- week_day: Week day (new variable).
- hour: Hour of the day (new variable).
- date: Date YYYY-MM-DD (new variable).
- lab: lab = working day / no_lab = no working day.
- wd: Wind direction in factor format.