# Parameters
I <- 20 # Number of individuals
K <- 5 # Number of topics
D <- 50 # Number of diseases
T <- 100 # Number of time points
theta_em=readRDS("thetaEM.rds")
true_theta=melt(Theta_individual)
colnames(true_theta)=c("Individual","Topic","Time","Theta")
est_theta=melt(theta_em)
colnames(est_theta)=c("Individual","Topic","Time","Theta")
ptid=sample(I,1)
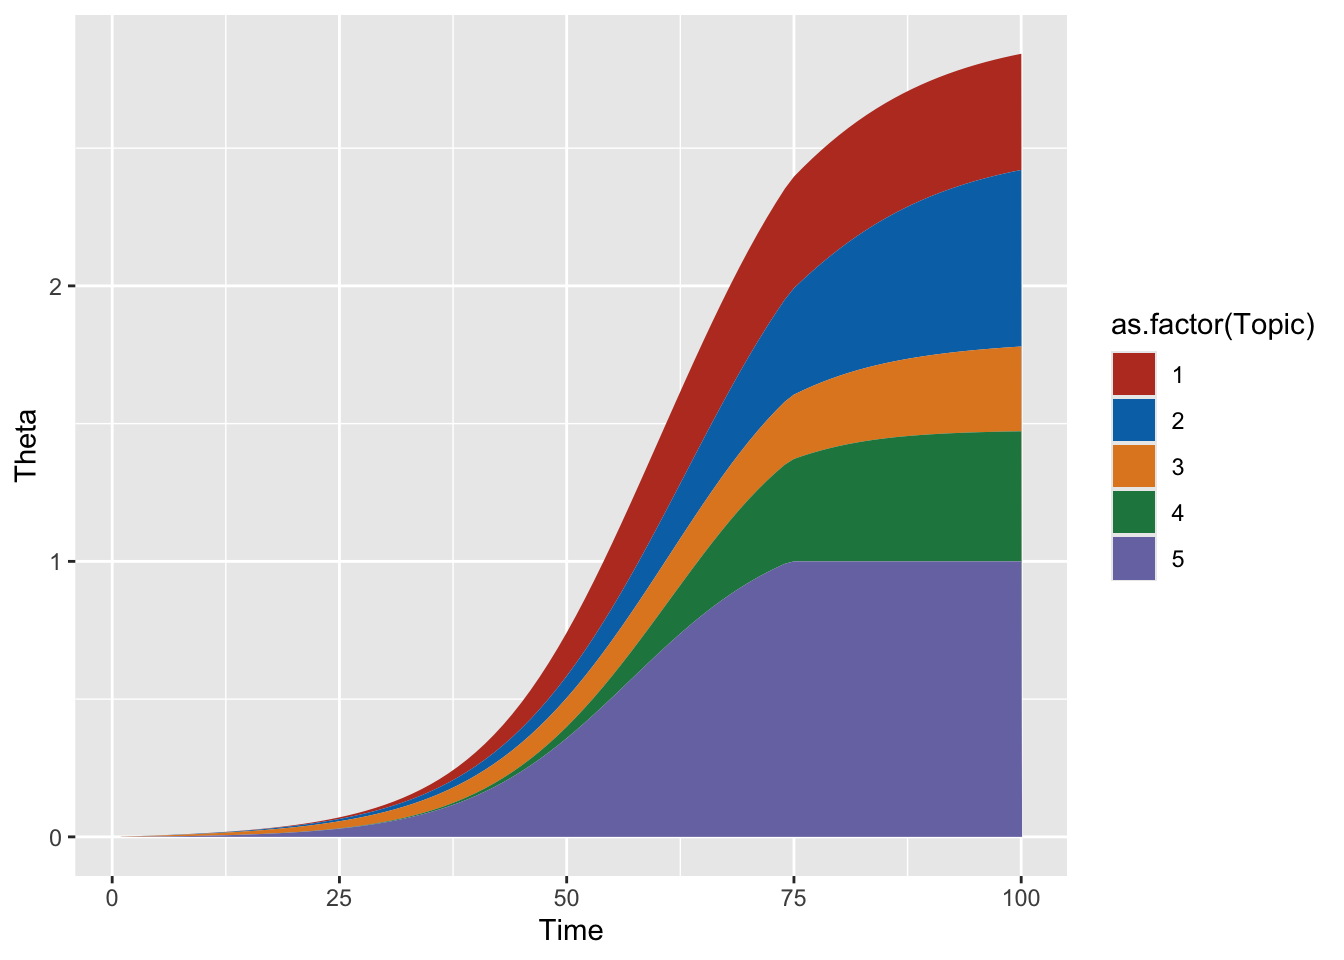
ggplot(true_theta[true_theta$Individual%in%ptid,],aes(x=Time,y=Theta,fill=as.factor(Topic),group=as.factor(Topic)))+geom_area()+scale_fill_nejm()
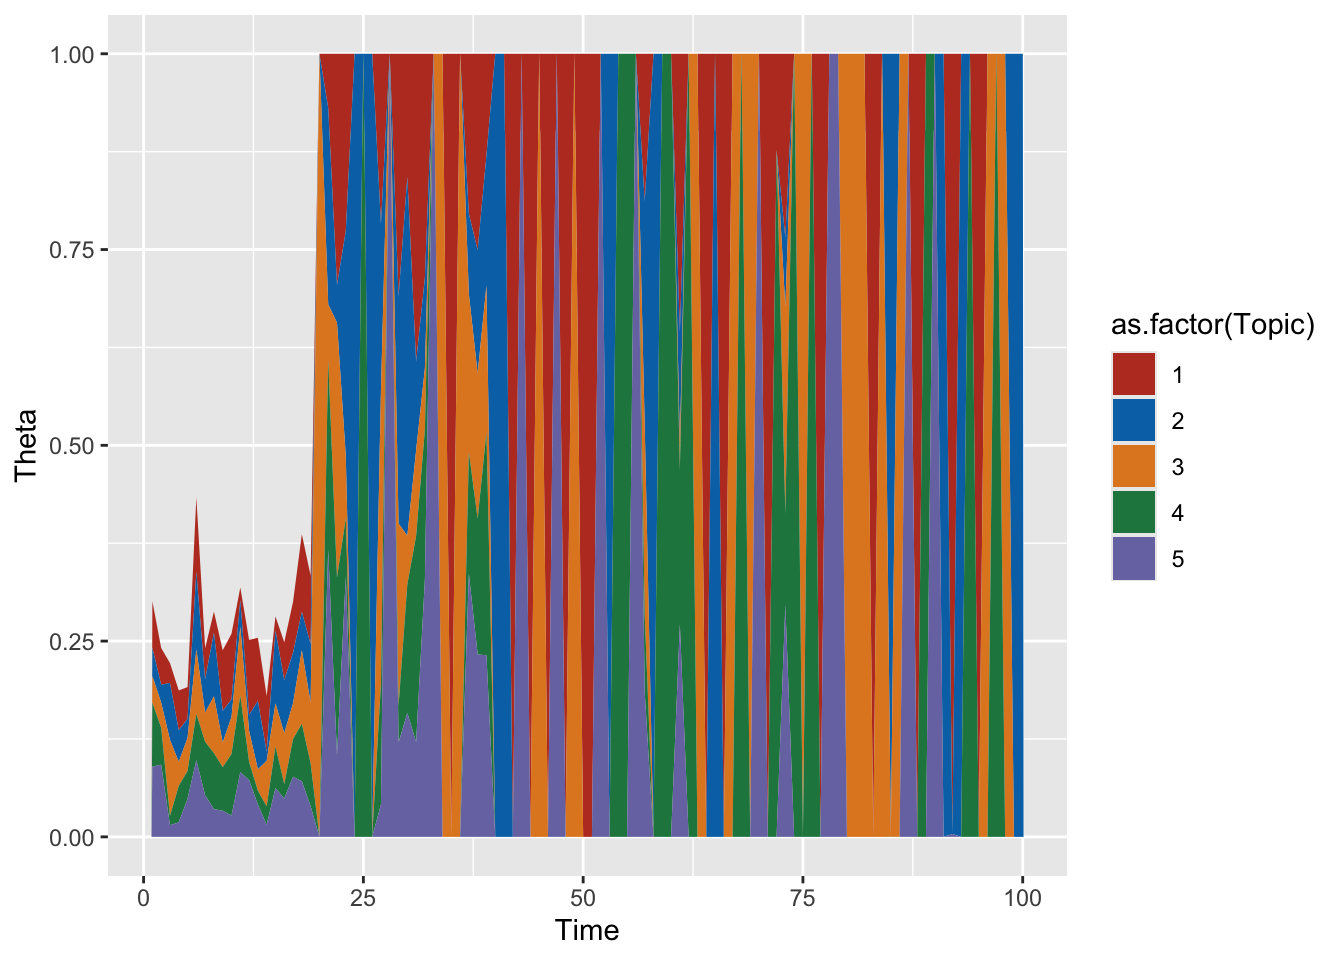
ggplot(est_theta[est_theta$Individual%in%ptid,],aes(x=Time,y=Theta,fill=as.factor(Topic),group=as.factor(Topic)))+geom_area()+scale_fill_nejm()