Meta-analysis of Ecological Data in R
2020-12-18
Preface
Motivation for this book
We created this book as a guide to conducting meta-analysis using ecological data in R. Ecologists are increasingly turning to evidence synthesis (i.e., systematic review and meta-analysis) as a way of describing and summarizing the published evidence base within sub-disciplines. There are helpful books that provide the theory behind meta-research in ecology (Koricheva, Gurevitch, and Mengersen 2013). There are also more technical guides that provide the R code for conducting meta-analyses, but these are typically built around datasets and methodology in medical (Schwarzer, Carpenter, and Rücker 2015) or social sciences (Harrer et al. 2019). We are excited to provide a guide for those conducting a meta-analysis in R using ecological data. We present methods that we have used in our own research, and of course indicate where we have built upon the work of other meta-researchers regardless of their primary field of investigation.
Intro to the data
The data we use in this book come from a meta-analysis by one of the co-authors (RCO) and his PhD advisor Dr. Julie Lockwood (Crystal-Ornelas and Lockwood 2020a). The data are the result of a systematic search for articles that investigate how invasive species native species richness. Language is particularly important to the field of invasion ecology (Mattingly et al. 2020), and so we start by describing what we mean when we say invasive species. The dataset contains information from ??Articles on ?? species of invasive trees. These trees have been intentionally or unintentionally moved to a new location from their native location. The invasive trees have established local populations, spread from this location and are now affecting their surrounding ecosystems in the new sites.
For more information about invasive species, we provide couple of references the authors find helpful.
- Invasion Ecology (Lockwood, Hoopes, and Marchetti 2013)
- Encyclopedia of Biological Invasions (Simberloff and Rejmánek 2011)
The data
Here, we import the data from google drive, and we can see from the output the classes of data (i.e., character or double) that R thinks our .csv file contains.
## Loading required package: tidyverse## ── Attaching packages ─────────────────────────────────────────────── tidyverse 1.3.0 ──## ✓ ggplot2 3.3.2 ✓ purrr 0.3.4
## ✓ tibble 3.0.4 ✓ dplyr 1.0.2
## ✓ tidyr 1.1.2 ✓ stringr 1.4.0
## ✓ readr 1.4.0 ✓ forcats 0.5.0## ── Conflicts ────────────────────────────────────────────────── tidyverse_conflicts() ──
## x dplyr::filter() masks stats::filter()
## x dplyr::lag() masks stats::lag()## Loading required package: cowplot##
## ── Column specification ────────────────────────────────────────────────────────────────
## cols(
## unique_article_identifier = col_character(),
## lastname = col_character(),
## publication_year = col_double(),
## invasive_species_common_name = col_character(),
## invasive_species_latin_name = col_character(),
## invasive_species_taxonomic_group = col_character(),
## invasive_species_trophic_position = col_character(),
## island_or_continent = col_character(),
## study_design = col_character(),
## SCImago_journal_rank = col_double(),
## time_since_invasion = col_double(),
## country = col_character(),
## mean_control = col_double(),
## SD_control = col_double(),
## sample_size_control = col_double(),
## mean_invaded = col_double(),
## SD_invaded = col_double(),
## sample_size_invaded = col_double()
## )Next, let’s inspect the data a bit, before we dive into the meta-analysis. As you can see from the code above, and the CSV file if you open it up, there are 17 different variables, or columns, in our newly imported dataframe. Some of the varaibles are the categorical pieces of data that we extracted from the articles that describe the article itself or the study’s focial invasive species.
For example, we can see the most frequently studied invasive tree species in our database.

The data that we’ll be analyzing in this book include publications on the impacts of invasive trees from 1999-2016. Here’s a visualization of how the published evidence base on invasive tree impacts has grown over the past two decades.
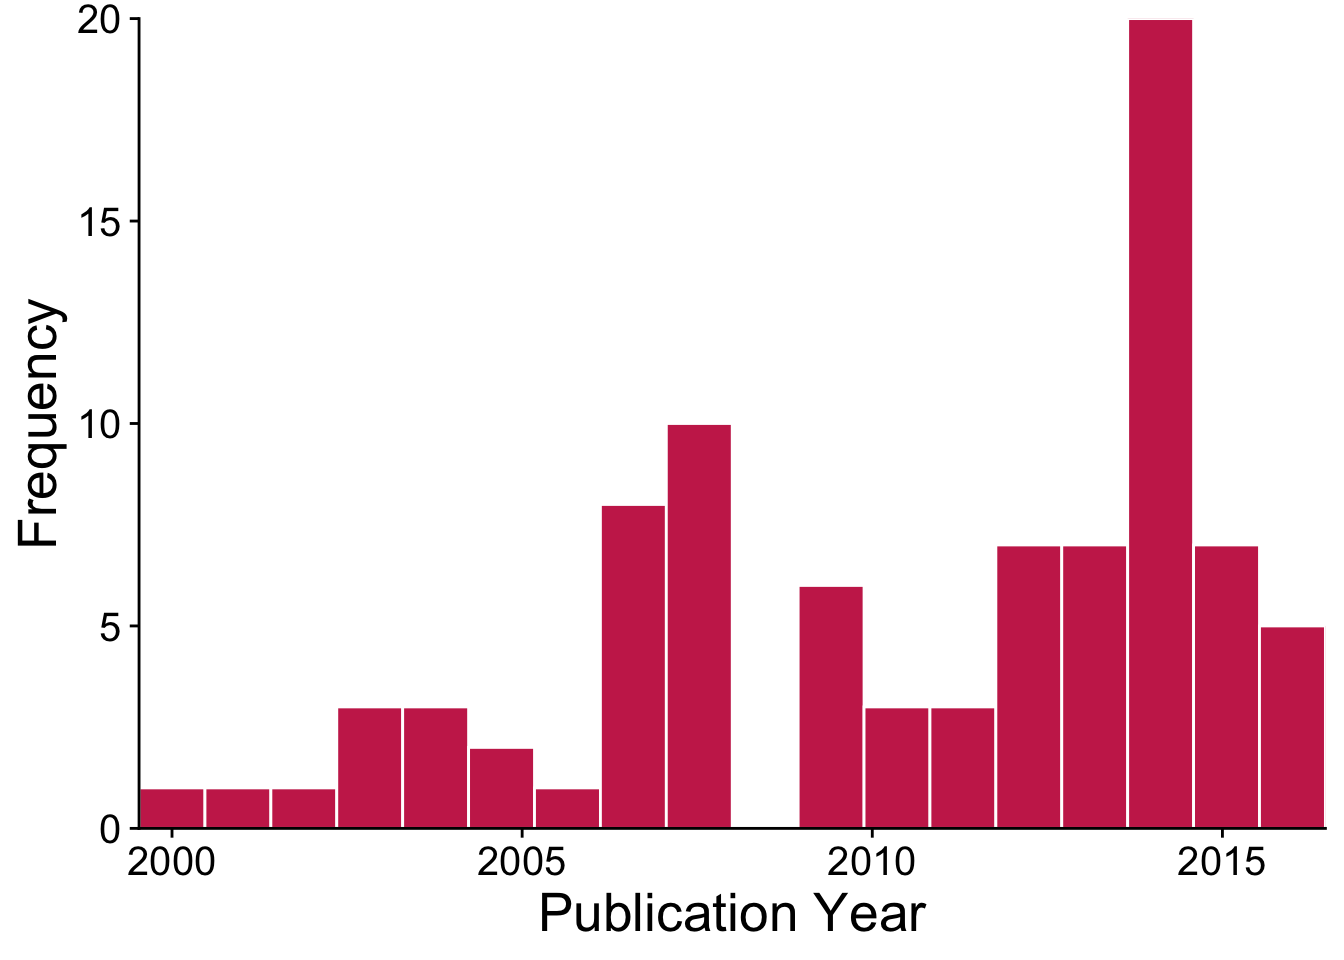
There are many more ways to display and summarize the data included in this CSV file. Meta-analysis statistics will most often use the numerical variables that are the key ingredients for meta-analysis (mean, standard deviation, and sample size). Our next chapters will focus on how to use these values to create meta-analytic models.
Contact information
This project is a work in progress and I’m always open to chatting with collaborators or hearing your suggestions for potential topics to include. There are a couple of ways to reach out:
- Visit the associated GitHub page for this project, follow the repository and submit an issue with your suggestion.
- Send me a message on twitter
- Visit my website for other up-to-date contact information.
output: pdf_document: default html_document: default — # Starting a meta-analysis
0.1 Systematic search
Every meta-analysis begins with a systematic process by which the person conducting the meta-analysis attempts to locate all articles related to the topic they are investigating.
Below, I outline the the general steps of the systematic search process in bold, and then provide how one might approach a systematic search to locate the example data we use in this book. One of my favorite figures that shows all of the steps in meta-analysis and systematic review can be found in the first chapter of (Koricheva, Gurevitch, and Mengersen 2013). In their figure, the authors stress that much of the effort that goes into meta-analysis happens in the planning and article locating phase. In other words, while it’s relatively easy to write some lines of code to get a meta-analysis to run, the steps leading up to writing some R code is both important for a high-quality meta-analysis–and it can take a substantial effort.
It is essential to outline as much of the meta-analytic process as you can before conducting the analysis. Developing these methods a priori rather than after you have tried to extract data from a pile of papers helps to avoid bias in the articles, analyses, and conclusions we make during the investigation
Figure 0.1: A helpful reminder
1. Pick a topic you want to investigate
Your first step as a meta-analyst is the pick the topic you want to investigate. What is the question you want to ask in your research? In my experience, there are so many unasked questions when we think of them through a meta-analytic framework. Of course, when conducting a meta-analysis we need enough published or un-published articles to synthesize data in order to conduct the analysis. But for now, let your imagination run wild! Following the steps below will help you to determine whether there is enough research available on the topic to do a meta-analysis.
To generate some ideas for meta-research projects you might start with these sources:
- Reading or re-reading some meta-research in your discipline and identifying what the authors see as avenues for new meta-research.
- One of my favorite ways of generating new research questions is by reading meta-analyses in the social or medical sciences to see what questions they ask, and then considering applying them to ecological data. A search of google scholar, and then filtering by the most recent year can help locate current meta-research.
- Data repositories like figshare or dryad to see what data have researchers kindly made publicly available.
- Another option is to check out pre-print servers medicine or biology and search for meta-analyses or systematic reviews. BioRxiv has a subsection specific to ecology that may spark some ideas for research project.
Applying this step to our example data
During my PhD, I became fascinated with invasive species and their impacts on the natural environment. Meta-research in ecology, and specifically invasion ecology has grown over the past two decades, yet I noticed that few meta-analyses provided a comprehensive evaluation of the magnitude of impact that many different species from a variety of invasive taxa can have on biodiversity. Impacts on diversity are frequently studied in invasion ecology (Crystal-Ornelas and Lockwood 2020b), so I had a suspicion that I would find plenty of data to conduct a meta-analysis on this topic.
Because this book will use a slice of the larger database RCO compiled, we provide a slightly narrower research question than RCO outlined in his article that this work is based on. For the purposes of this book, we ask:
How do invasive trees impact the species richness (aka alpha diversity) of native species.
2. pick a search engine and search terms
The next step is to decide on the search engines and databases you will use (Google Scholar, the CABI database, Web of Science) to locate articles relevant to your research topic.
| Database | Pros | Cons |
|---|---|---|
| Google Scholar | Free to search and access to large number of scientific articles | Overwhelming number of search hits |
| Web of Science | Ability to filter articles by subject matter | Institutional access required |
| CAB Direct | Good article filtering and contains many relevant articles for ecology | Institutional access required and search can large number of hits |
Applying this to our example data
For this meta-analysis, we used the Web of Science database to locate articles on invasive species impacts. Due to time constraints, we couldn’t include all three of the databases above. The number of articles Web of Science alone returned took about a couple of years to sift through. That being said, we did our best to capture as many invasion impact articles as possible by developing broad search terms.
If you are going to use Google Scholar or CAB Direct, you may want to implement methods used by (Crystal-Ornelas et al., n.d.; Wang Wei, Lee, and Bing Wen 2016) which select only the first 700 or 1000 articles returned from Google Scholar.
3. Search terms
After deciding on the search engine(s) you will use, you need to develop the search terms you’ll use to locate articles within each database. You should aim to design a search that is completely repeatable by anyone who reads your manuscript. This means not only specifying the terms you search, but also any ways that you filter the search results (e.g., date, language, topic).
When deciding on search terms you should attempt to capture every or, nearly every, published/unpublished article that is relevant to your research question. By making a search comprehensive, we avoid introducing bias into our meta-analysis (Gough, Oliver, and Thomas 2012). Sometimes I like to think of this part of the process in terms of balancing sensitivity vs. specificity. We can leave the specificity (i.e., identifying the exactly right article we want in our meta-analysis until later). In the systematic search phase of our meta-analysis, we want to cast a wide net and capture every article, and search through every database we deem relevant as long as time permits.
In many of the databases you will use, Boolean searches will be the most effective way to locate relevant articles. Harvard’s library put together a quick guide to Boolean searches here. The most common Boolean “operators” are the words AND as well as OR. So, here’s how to use them. If we wanted to locate articles about a smiling axolotl and we wanted to make sure that the articles contained both the words “smiling” and “axolotl” we would link up those two words in our search with the word AND.
axolotl AND smiling
But then we realize that there are lots of synonyms for smiling, and we don’t want to miss those in our search. This is where OR comes in. In this case, the articles would have to contain the word axolotl and they also must contain the word smiling OR grinning. That Boolean phrase looks like this
axolotl AND smiling OR grinning

Figure 0.2: Requisite photo of smiling axolotl
Applying this to our example data
As a reminder, we used Web of Science to search for articles about invasive species impacts. We use the topic search function that Web of Science provides. When you search topics you are actually searching for your terms in all article titles, abstracts and keywords. For our systematic search, we used the following search terms.
TOPIC = invasive AND impact
*; introduced species AND impact*; non-native AND impact*; exotic AND impact*; alien AND impact*; naturalized AND impact*; non-indigenous AND impact*
Rather than using the OR operator, we divided up our searches, but we easily could have linked up the synonyms for invasive with the OR operator. Note that we also included asterisks at the end of the work impact. The asterisk at the end of any word let’s the search know you want the word as you’ve type it, and any other words that have different ending letters. So our search above captured articles that used the word impact as well as impacts, impacted, and impacting.
This systematic search of Web of Science yielded over 23,000 potential articles!
0.2 Article screening
After you identify the set of candidate articles for your meta-analysis it’s time to sort through all of the articles and determine which will included in your meta-analysis. Your first step should be to delineate your inclusion criteria. These are a set of criteria that each of the articles must meet prior to inclusion into your meta-analysis.
In order to help shape the inclusion criteria, we recommend adhering to the Population, Treatment, Control, Outcome (PTRO, or sometimes called the PICO) framework (Huang, Lin, and Demner-Fushman 2006). First, make a rule about the population that an article must focus on for you to include it in the meta-analysis. For example, will you include only studies that investigate invasive crayfish? Can these studies come from populations all over the world or only in the US? Next, identify the treatment you will focus on in your meta-analysis. This criteria is called treatment because the framework was developed for medical sciences. But we can thin of the treatment group as the experimental sites. For example, the treatment sites may receive extra nutrient input or an increased amount of deer herbivory. Then you should develop a rule about the design of the control sites. For example, they may lack a certain nutrient input or experience lower levels of deer herbivory. Lastly, a rule about the focal outcome will help define the quantitative metrics you will eventually extract from each article. Following the examples from above, we may want to include only articles that measure dissolved Soil Organic Carbon or abundance of a certain flowering plant species.
After deciding on your inclusion criteria, it’s time to sort article and then determine whether you’ll include the articles or exclude them based on you PTRO criteria (see above). We recommend using a Preferred reporting Items for Systematic review and Meta-Analysis flowchart (PRISMA). This flowchart allows for easy visualization of the major steps involved in sorting through articles. We recommend sorting through articles in 4 distinct steps. First, identify and remove any duplicate articles that you picked up during your systematic search. Duplicate articles are common if you searched in multiple databases. If you use a reference manager like Zotero finding duplicates will be a breeze and really all steps of sorting will be more organized.
Then move through articles always checking for consistency with your pre-defined inclusion criteria. First first by title, then abstract, then read the full text of the article and make a decision on whether to include or exclude the article. We recommend keeping track of the articles you exclude at each step using a reference manager like zotero (mentioned above and free) or endnote (great interface, but expensive). We also recommend using a Preferred Reporting Items for Systematic Review and Meta-Analysis (PRISMA) diagram for easily conveying your screening process to readers (Moher et al. 2009). Below is an example of a PRISMA flowchart that provides boxes in green that show the number of articles retained in each screening step and red boxes that show the number of articles excluded in each step. If you want to make your own PRISMA flowchart, we recommend either powerpoint or the R package DiagrammeR (Iannone 2018).
## Loading required package: DiagrammeRFigure 0.3: Example of a PRISMA flowchart with 3 screening steps
Applying this to our example data
In order to create the inclusion criteria for our example meta-analysis, we used on the PTCO framework described above. In the table below, I provide a shorthand name for each criteria in one column and then a more detailed rationale for the criteria in the next column. As in all steps of the meta-analysis, the goal is to provide enough detail so that someone could repeat all the steps of the analysis if they want to.
| Criteria | Rationale |
|---|---|
| Original research (Population) | Include only primary published research |
| Invaded sites (Treatment) | Articles must include sites with invasive species. If studies measure impacts of multiple invasive species, we count each species separately in our database |
| Sites without invasive species (Control) | Experiments must have control sites without invasive species or with species at very low densities |
| Measurements of species richness (Outcome) | Articles must provide mean measurement of richness at invaded and control sites (\(\bar{X}\)) as well as sample size (N) and measure of variation (s, \(s^2\), or SE) |
Should you decide to use the PRISMA flowchart to organize your article screening process, here’s an template of what the flowchart can include using example data from this book. At each screening step (green box) we indicate the number of articles screened. We also use red boxes to highlight the number of articles that we exclude at each screening step, and we also provide the most common reasons for exclusion.
Figure 0.4: Example PRISMA flowchart for invasive tree database
Note that you can modify any of the boxes to suite the needs of your screening protocol. We excluded 30 articles because they lacked any measurements of species richness. If your meta-analysis doesn’t focus on species richness then you will likely have a different box to represent the outcome you need to conduct your meta-analysis.
0.3 Data extraction
Extracting data for a meta-analysis is one of the most challenging parts of any of the steps outlined in this book. Planning your data extraction spreadsheet out in advance, and then keeping it organized will eventually pay dividends (in :) not $) as your work becomes more complex.
In the data extraction phase, you will have already identified the set of candidate articles that match all of the inclusion criteria for your meta-analysis Now it’s time to sift through all of the papers in your database and pull relevant information from each article into your data extraction spreadsheet. To do this, you of course need a data extraction spreadsheet.
Setting up your data extraction spreadsheet
In my experience, data extraction spreadsheets are typically created in either Microsoft Excel or in Google Sheets. With Google Sheets, the benefit is that you can easily share and collaborate on this document more seamlessly than in Excel.
Below, you see a typical example of how I setup my data extraction spreadsheet. Just like with establishing search terms ahead of time to minimize injecting your own biases into the articles that are included in the review, it’s typical to try to outline as much of the data extraction spreadsheet as possible before actually extracting the data. In the header row, you see I am collecting some data about each article (e.g., lastname, publicationyear, impactfactor) as well as some data that is specific to the research that is the focus of the article (invasivespecies and latinname). I also assigned a unique ID to each article with format of randomnumber-firstauthor-publicationyear and I correspondingly re-name each PDF with its assigned unique code. This helps me create a type of relational database where I’m always able to quickly search through my reference manager to find the article in question. You’ll notice that we haven’t even gotten to the data needed for a meta-analysis yet, and there is already a decent amount of information we are pulling from each article.

Figure 0.5: Example of a data extraction spreadsheet
The data extraction spreadsheet shown above has a total of 43 columns each characterizing a different element or piece of data from the manuscript. Without delving too much into what all of those columns are, you may, especially for ecological meta-analyses, be interested in whether other variables may moderate the main effect you are investigating. For example, we could collect data on variables like:
- ecological impact of invasive species
- country where impact occurred
- tropic position
- sampling frequency
- study length (in days)
The list goes on, but these are a few examples of variables that, while not the main focus of our meta-analysis, can be incorproated into models to try and account for some of the variation we see in the data.
Now it’s time to extract the data that you need for a meta-analysis. I am focusing on some common metrics to extract (mean, standard deviation [SD], and sample size[N]), but there are many others which I will not address here (e.g., pearson’s r). The data we extract here, will be useful for calculating two commonly used meta-analytic effect sizes in Ecology, Headge’s g and the response ration.
So in order to collect these data, we create separate columns for the mean, SD, and N as you can see below. You can certainly deviate from the naming conventions in the image below, but make sure they are descriptive enough so that you know which data are from your control sites and which are from your treatment (or experimental) sites.
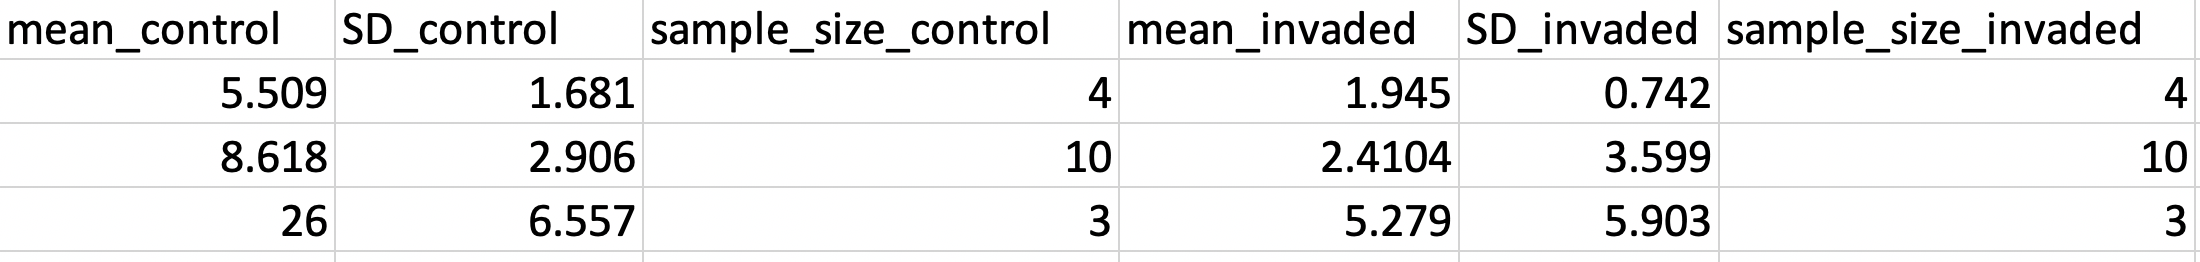
Figure 0.6: Example of a data extraction spreadsheet
Best case scenario is that when you go into extract data from an article you find mean
** What happens if I can’t find the data within an article? 1. Download supplemental information. This includes repository 2. Extract data from figure 3. Contact author
Applying this to our example data
References
Crystal-Ornelas, Robert, Jeffrey A. Brown, Rafael E. Valentin, Caroline Beardsley, and Julie L Lockwood. n.d. “Meta-Analysis Shows That Overabundant Deer (Cervidae) Populations Consistently Decrease Average Species Abundance and Richness of Forest Birds.”
Crystal-Ornelas, Robert, and Julie L. Lockwood. 2020a. “Cumulative Meta-Analysis Identifies When Invasive Species Impacts on Richness Stabilize.” Ecology.
Crystal-Ornelas, Robert, and Julie L. 2020b. “The ‘Known Unknowns’ of Invasive Species Impact Measurement.” Biological Invasions 22 (4): 1513–25. https://doi.org/10.1007/s10530-020-02200-0.
Gough, David, Sandy Oliver, and James Thomas, eds. 2012. An Introduction to Systematic Reviews. London ; Thousand Oaks, Calif: SAGE.
Harrer, Mathias, P Cuijpers, T. A. Furukawa, and D. D. Ebert. 2019. Doing Meta-Analysis in R. https://bookdown.org/MathiasHarrer/Doing_Meta_Analysis_in_R/.
Huang, Xiaoli, Jimmy Lin, and Dina Demner-Fushman. 2006. “Evaluation of PICO as a Knowledge Representation for Clinical Questions.” AMIA Annual Symposium Proceedings 2006: 359–63. https://www.ncbi.nlm.nih.gov/pmc/articles/PMC1839740/.
Iannone, R. 2018. “DiagrammeR: Graph/Network Visualization.” R Package 1 (0).
Koricheva, Julia, Jessica Gurevitch, and Kerrie Mengersen. 2013. Handbook of Meta-Analysis in Ecology and Evolution. Princeton University Press.
Lockwood, Julie L., Martha F. Hoopes, and Michael P. Marchetti. 2013. Invasion Ecology. John Wiley & Sons.
Mattingly, Kali Z, Tara A Pelletier, Jessie Lanterman, Danielle Frevola, Benjamin Stucke, Kaitlin Kinney, Ross Schwartz, Drew Spacht, Graham Dixon, and Stephen M Hovick. 2020. “Disconnects Between Communicated Impact and Ecological Impact of Biological Invasions.” BioScience 70 (3): 252–63. https://doi.org/10/ggpcz2.
Moher, David, Alessandro Liberati, Jennifer Tetzlaff, Douglas G. Altman, and Prisma Group. 2009. “Preferred Reporting Items for Systematic Reviews and Meta-Analyses: The PRISMA Statement.” PLoS Medicine 6 (7): e1000097. https://doi.org/10/bq3jpc.
Schwarzer, Guido, James R. Carpenter, and Gerta Rücker. 2015. Meta-Analysis with R. Springer.
Simberloff, Daniel, and Marcel Rejmánek. 2011. Encyclopedia of Biological Invasions. Univ of California Press.
Wang Wei, J., B. P. Lee, and L. Bing Wen. 2016. “Citizen Science and the Urban Ecology of Birds and Butterflies - A Systematic Review.” PLoS ONE 11 (6): e0156425. https://doi.org/10/gbnb34.