6 Publication bias
6.1 A brief introduction to publication bias
Regardless of the discipline that you research, publication bias is something you will have to confront when conducting your meta-analysis and justifying your results. One definition of publication bias is:
the degree of divergence between the relative actual merit of a given publciation and its relative perceived merit (Lortie et al. 2007)
In their review, Lortie et al. also summarize other definitions of publication bias they located throughout the meta-analysis literature. For those wanting a deeper dive into publication bias that we are able to present here, there is an excellent book chapter in the Handbook of Meta-analysis in Ecology and Evolution (Jennions et al. 2013). The chapter in The Handbook gives a high-level summary of the various types of publication biases in Ecology and Evolution.
For now, we’ll also consider a second definition of publication bias from (Jennions et al. 2013) define publication bias as:
occur[ing] when the published literature reports results that systemtatically differ from those of all studies and statistical tests conducted; the result is that false conclusions are drawn (based on (Rothstein, Sutton, and Borenstein 2006))
Just from these two related, but slightly divergent definitions of publication bias, you can see that publication bias arises through many different mechanisms, some of which we’ll discuss below. No matter how we get there, publication bias results in a misrepresentation of the actual underlying effect. As meta-analysts, we want to limit publication bias as much as we can, while also recognizing the publication biases that can potentially remain within our datasets.
6.2 Where does publication bias come from?
Publication bias is often used as a catch-all term for the many “sub-biases” that can contribute to an overall difference between a mean effect presented in a meta-analysis and the true underlying effect of the study system. In the table below is a summary of several types of biases found in meta-analyses, a brief description, and a citation for where the type of bias was defined.
| Type of bias | Description | More information |
|---|---|---|
| Reporting bias | Occurs when effect sizes go unpublished (or take much longer to get published) because they were “weeded out” when putting a manuscript together or during the review process. For example, because results were non-significant. | (Jennions et al. 2013; Song et al. 2010) |
| Dissemination bias | Text | (Jennions et al. 2013) |
| Narrow sense publication bias | Text | (Jennions et al. 2013) |
| Time-lag bias | High magnitude results are published faster than lower magnitude results. | (Trikalinos and Ioannidis 2005; Crystal-Ornelas and Lockwood 2020a) |
6.3 The power of publication bias
We can take a look one example from a meta-analysis that shows just how publication bias can influence the results of a meta-analysis (Sanchez-Tojar et al. 2018). The collected as many effect sizes as they could related to status signalling of male house sparrows.
Figure 6.1: Photo of a male house sparrow. Photo credit: allaboutbirds.com
They test publication bias in several ways:
- First, the authors created what are called funnel plots (Sterne and Egger 2001) (see section on funnel plots below) to identify whether plotted residuals of their meta-analytic models are symmetrical when they are plotted against “the inverse of their precision.” Data sets without much publication bias will have a relatively symmetrical funnel or cone shape when plotted, whereas funnel plots with publication bias will have an asymmetrical funnel when plotted. The figure below shows
Figure 6.2: Example of (A) symmetrical and (B) asymmetrical funnel plot when testing for publication bias.
6.4 Testing for publication bias
Taking the opportunity to adapt a lyric from David Byrne: “You may ask yourself [does my meta-analytic dataset likely have publication bias?].” To which we’ll have a general response of an emphatic yes!.
There are so many ways that publication bias can occur in scientific literature–it’s extremely likely that your meta-analysis is beset by one or more types of publication biases. However, over the past several decades researchers have proposed many ways of assessing publication bias within datasets, and we’ll discuss and show examples of them here.
6.4.1 Funnel plots
One of the most popular ways to visually assess publication biases is by creating a funnel plot (Sterne and Egger 2001). Fortunately there is some great code built into the metafor package that can help us create funnel plots
To create several versions of the funnel plot, we’ll need to take the results of our random effects model that we created back in chapter 4 random_effect_model_results.
### First, run this code to create a 2x2 grid within the plotting window, so we can make 4 forest plots at the same time
par(mfrow=c(2,2))
### Then, make 4 different funnel plots
funnel(random_effect_model_results, main="Standard Error")
funnel(random_effect_model_results, yaxis="vi", main="Sampling Variance")
funnel(random_effect_model_results, yaxis="seinv", main="Inverse Standard Error")
funnel(random_effect_model_results, yaxis="vinv", main="Inverse Sampling Variance")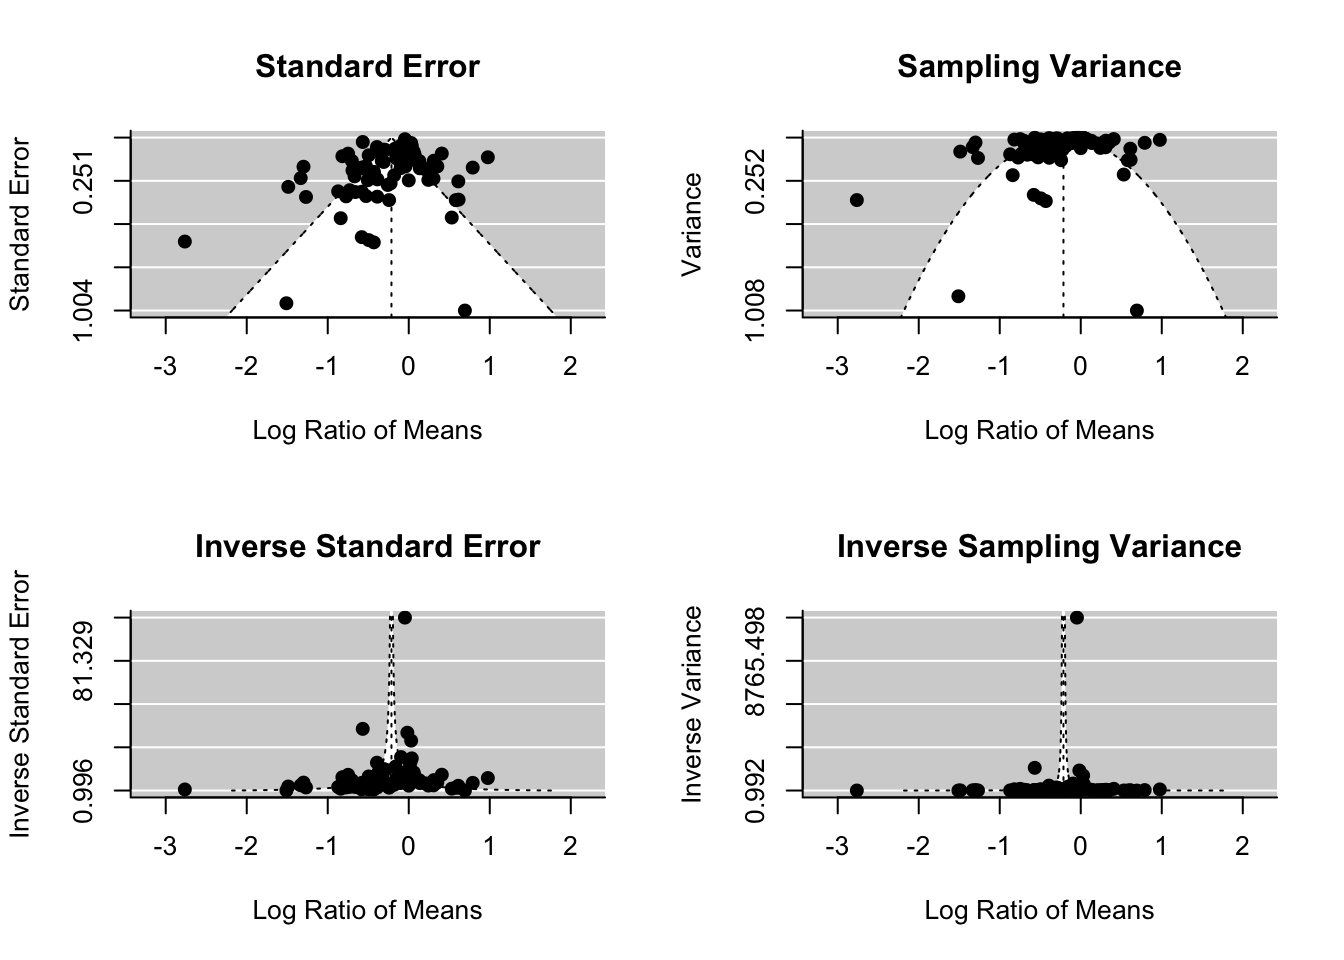 As you can see in these figures, the way the metafor creates funnel plots is by plotting on the y-axis the individual effect sizes, and on the x-axis the different source of error for each of the effect sizes. As mentioned in the metafor documentation (Viechtbauer 2017) a meta-analysis without publication bias would have all points falling roughly symmetrical on either side of the funnel and within the “confidence intervals” that form the two dotted lines that make up the funnel.
The metaviz package also provides some useful functions for creating forest plots which though we do not explore below may be useful should you choose to both create forest plots within metaviz as well as funnel plots (Kossmier, Tran, and Voracek 2018). Here’s a link to a metaviz tutorial. As with the funnel plots from the metafor package above, the general expectation with the metaviz funnel plots are the same–general symmetry around the funnel with most points falling somewhere within the funnel rather than outside.
Despite the popularity of funnel plots that have, for decades, been used to explore publication bias meta-analyses, they have come under scrutiny. The main critiques that argue against using funnel plots is that they are less useful when sample sizes are small and/or heterogeneity is high within the effect sizes included in the meta-analysis (Ioannidis and Trikalinos 2007; Lau et al. 2006).
6.4.2 Publication bias histograms
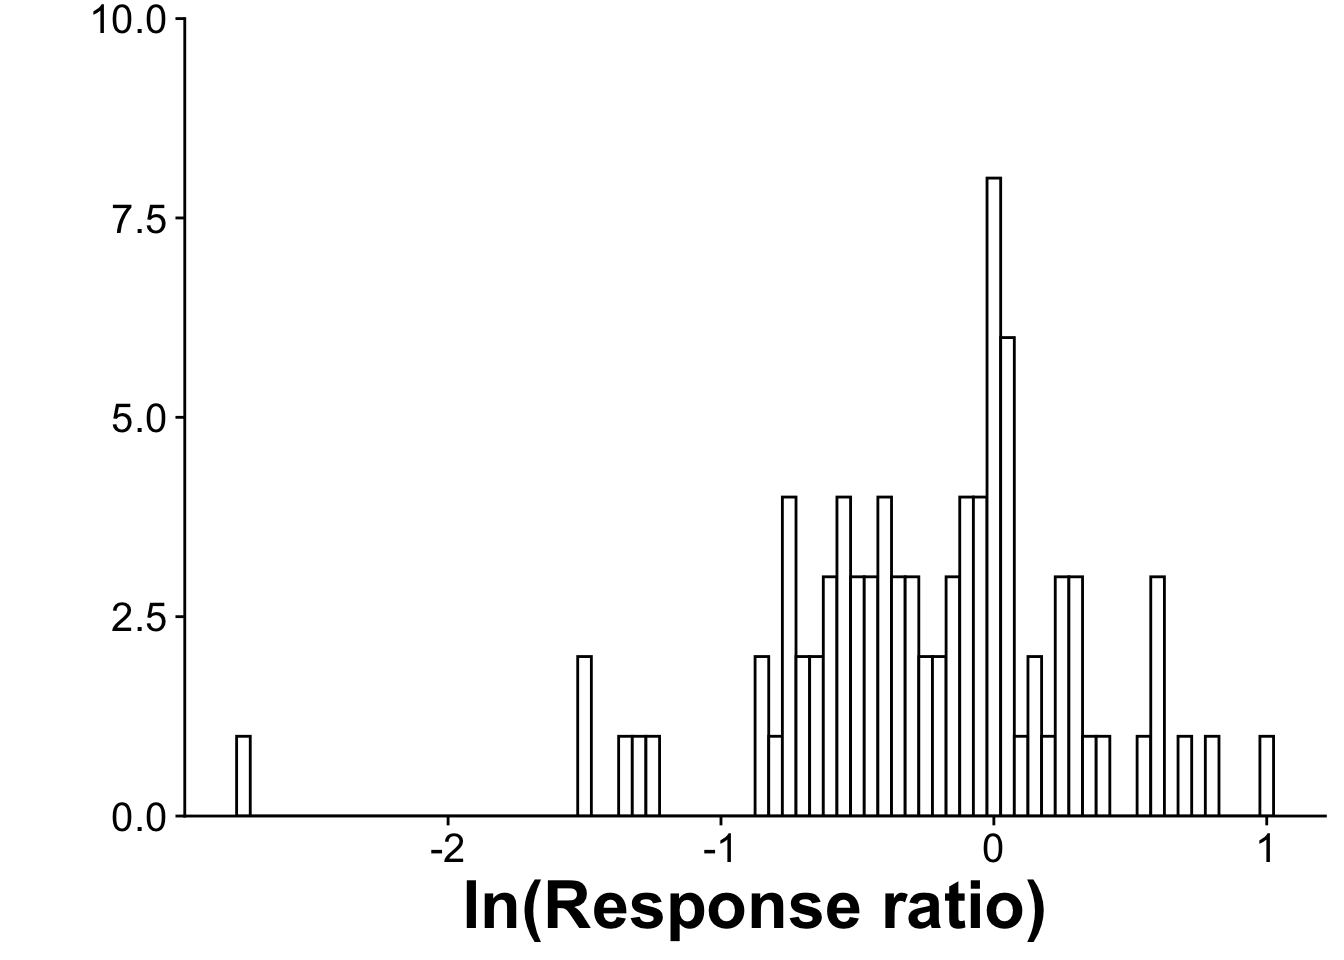
Another way to visually assess publication bias is though publication bias histograms (Thapa, Mirsky, and Tully 2018; Crystal-Ornelas, Thapa, and Tully 2021). We can create the histogram using the package ggplot2, and setting the x-axis of the graph as the effect sizes contained in the data frame RR_effect_sizes. The y-axis will simply be a count of all of the effect sizes in your dataframe. What we are looking for in these publication bias histograms is not all that different from what we looked for with the funnel plots. A dataset that lacks publication bias will have a generally normal distribution around the midpoint of the histogram. This shows that the dataset contains a roughly equal amount of positive and negative effect sizes at a roughly equal range of values.
pub_bias_histogram <-ggplot(RR_effect_sizes, aes(x=yi)) +
  geom_histogram(binwidth=0.05, color="black", fill="white") +
  xlab("ln(Response ratio)") +
  ylab ("") +
  theme_cowplot() +
  theme(plot.title = element_text(size = 25, hjust = -.06, face = "bold"),
        axis.title = element_text(size = 25, face = "bold"),
        axis.text = element_text(size = 15)) +
    scale_y_continuous(expand = c(0,0),limits=c(0,10))
pub_bias_histogram