Chapter 4 Deep-Sea Species in the Patent System
4.0.1 Introduction
Patents provide an important indicator of research and development directed towards commercial applications and products that involve genetic resources. Patent activity for marine genetic resources has received significant attention within existing reports on the deep-sea and the scientific literature [14–18]. For example, using sequence data from the patent division of GenBank, Arrieta, Arnaud-Haond and Duarte (2010) estimate that “Since 1999, the number of marine species with genes associated with patents has been increasing at an impressive rate of about 12% of species per year, which is more than 10 times faster than the rate of description of marine species” (Arrieta et al., 2010: 18319). In particular, the research identified non-redundant marine gene sequences from 558 distinct marine species in the sequence deposit for patent data at GenBank (Arrieta et al., 2010: 18319). In subsequent work the same research team focused on international patent activity at the World Intellectual Property Organization and identified 677 international claims for marine gene patents involving 520 species between 1991-2009 [17].
Existing research strongly suggests a growing interest in marine genetic resources [17]. As the quotes from participants in the Valuing the Deep Delphi study in Chapter 7 highlight, for some experts patent activity can lead to a perception of a gold rush requiring urgent action. However, other experts take a more reflective stance recognising issues such as the distribution of organisms both in the deep-sea in Areas Beyond National Jurisdiction (ABNJ) and terrestrial environments.
We set out to address three main issues as a contribution to advancing knowledge and understanding of patent activity for marine genetic resources:
- Clarifying the scale of patent activity for marine genetic resources in general using large scale text mining, and;
- Establishing whether organisms appearing in patent documents are likely to originate from inside or outside Exclusive Economic Zones;
- Investigating references to the origins or sources of species inside or outside the EEZ within patent documents.
In this chapter we address the first two issues and we consider the question of the origins or sources of species in the next chapter. To address the first two issues we used a combination of large-scale text mining of patent data from the main jurisdictions for references to marine organisms and mapping of the known occurrences of marine species inside or outside the EEZ and by pelagic zones in the water column.
We identified 4,759 marine species names in 61,045 patent publications from the main jurisdictions originating from 23,091 patent families (first filings) and linked to 250,309 family members world-wide. We identified a clear increase in first filings of patent applications (families) referencing marine organisms in the late 1990s with activity stabilising at approximately +/- 1500 new filings per year at the major offices between 2006 and 2010. Of these, 3,566 patent families (first filings) contained references to 2,714 marine organisms in the Title, Abstract or Claims indicating that the inventions are in some fundamental sense about the marine organism. While the number of first filings of new patent applications referencing marine species is relatively stable, trends in global demand for protection of inventions referencing marine species display a steep increase. This reflects the increasing willingness of applicants to pay to pursue protection for these inventions in multiple countries and the globalisation of demand for patent protection referencing marine species.
In conducting the research we used validated marine species names from the World Register of Marine Species (WoRMS). However, species may be found in terrestrial, terrestrial aquatic and marine environments. As such, species are not constrained by our expectations of where they should be occurring. Thus, top ranking marine species appearing in patent data include fungi that are more likely to originate from terrestrial environments but are also known to exist in marine environments. Furthermore, in some cases species that feature prominently in marine data and existing literature on the deep-sea, such as Sulfolobus solfataricus, were in fact originally isolated from terrestrial or terrestrial aquatic environments. The cosmopolitan nature of some species, including from deep-sea environments, complicates the ability to accurately analyse and assess patent activity involving marine organisms in general and deep-sea species in particular.
We used data on the known distribution of species and depth data from the Global Biodiversity Information Facility (GBIF) and the Ocean Biogeographic Information System (OBIS) to identify the location of species inside or outside the EEZ. We identified 1,800 marine species that are referenced in patent data that exist in Areas Beyond National Jurisdiction (ABNJ). A rising trend is observable in filings from the late 1990s with 369 filings records in 1999 rising to a peak of 731 filings in 2009 before declining to 643 in 2010.
Based on available taxonomic information, species are predominantly distributed inside the EEZ including at depths below 200 metres. Approximately 1,800 species were identified as occurring outside the EEZ. Only 42 of these species were identified as only occurring outside the EEZ. Available depth data suggests that species from the epipelagic zone are dominant (1,461 species) with 339 species recorded in the deep-sea zone below 200 metres outside the EEZ. However, because depth data is limited for certain kingdoms of organisms, notably bacteria and archaea, this data will underestimate species occurring in patents from the deep-sea zone below 200 metres. As such we do not presently regard the division of the data by depth as sufficiently robust. Rather, this highlights the need for greater attention to providing sample depth data across kingdoms in taxonomic databases and consultation with the research community to facilitate evidence based decision-making.
4.0.2 Methodology
We used the World Register of Marine Species (WoRMS) database of 402,540 species names, combined with the subsidiary World Register of Deep Sea Species (WoRDSS) as the taxonomic backbone for our research. Using advanced pattern matching techniques described in previous research we text mined 14,038,743 full text patents from the European Patent Office, the United States Patent and Trademark Office (USPTO) and the international Patent Cooperation Treaty (PCT) between 1976-2013 for species names from WoRMS and WoRDSS [6]. This allowed for the identification of species by document section such as the title, the abstract, description or the claims. The results from the text mining were then federated with the EPO World Patent Statistical Database (PATSTAT, October 2013 edition) for the development of statistics, identification of applicants and technology areas etc.
The results were federated with available occurrence data and depth data from GBIF and OBIS to facilitate geographic mapping and analysis by depth in the water column. We used the marine mark up in GBIF to validate marine species data. Species not identified as marine in GBIF but appearing in WoRMS were manually reviewed.
One of the key issues we sought to address was the availability of information on the geographic distribution of species. Data on geographic distribution in GBIF takes two main forms and it is important to understand the differences between them:
- Geocoded coordinate data displaying the latitude and longitude for a known occurrence of a species;
- General distribution data simply ascribing a record to one or more countries.
In addition, some of the marine data carries depth information for samples. However, the availability of depth data is variable and may be recorded as null or as zero. Figure 4.1 displays the results by kingdom and species counts for available data from GBIF and OBIS.
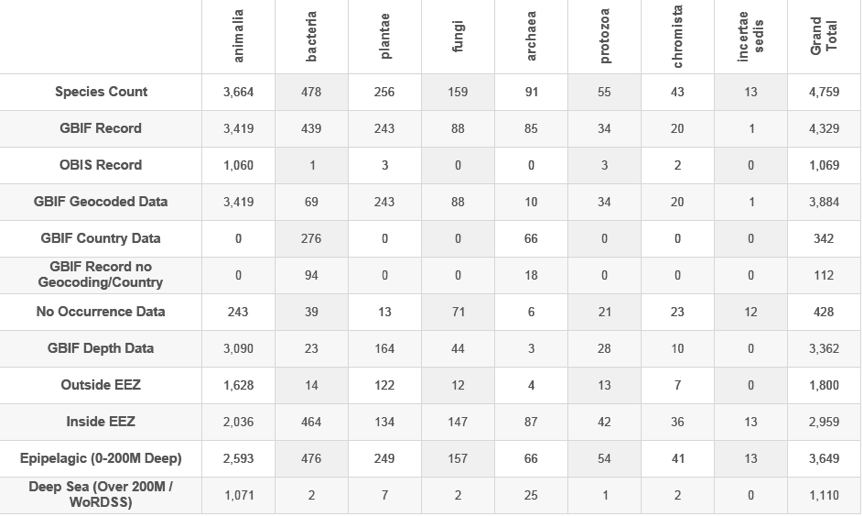
Figure 4.1: Species Appearing in Patents By Occurrence Data
In considering Figure 4.1 note that geocoded and distribution records vary across the major kingdoms. Furthermore, the availability of depth records also varies. The most significant variations in our view are for bacteria where geocoded data is limited, as is depth data. This signifies that the bulk of bacteria will be allocated inside the EEZ based on the availability of geocoded and distribution data. Bacteria will also be allocated to shallower waters in the water column. Given the focus in the literature on the potential economic value of enzymes or compounds from bacteria and archaea from outside the EEZ and at deep sites such as hydrothermal vents, this presents a challenge. That is, until such time that more geocoded and depth data becomes available, the ability to identify bacteria and archaea according to their status inside the EEZ or in ABNJ will remain limited.
Figures 4.2A and 4.2B present a summary of the results divided by whether a species occurs inside or outside the EEZ. Note that a species may occur both inside and outside the EEZ.
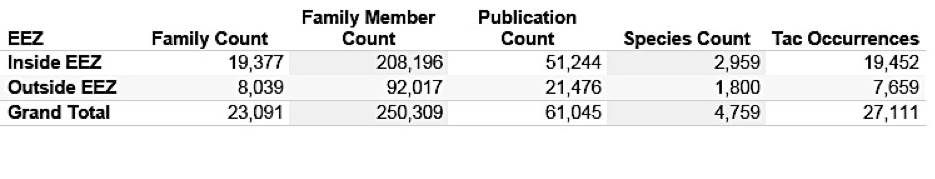
Figure 4.2A: Marine Species Appearing in Patent Documents
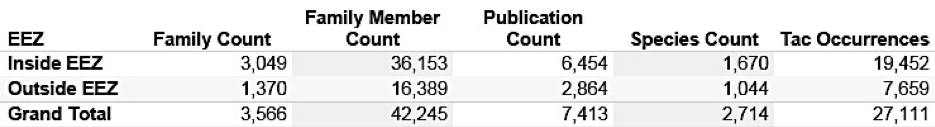
Figure 4.2B: Marine Species Appearing Only in the Title, Abstract or Claims
In later steps the raw data containing species names was searched for place and habitat names derived from analysis of the keywords and phrases from 484,999 words and phrases in the scientific literature (see Chapter 3). This was followed by a search using the General Bathymetric Chart of the Oceans Gazetteer (GEBCO Gazetteer) of 3,762 undersea feature names and complemented by a search for the names of known hydrothermal vents using the InterRidge Vents database16.
To identify species that may not have been taxonomically described except through comparison with known sequences, additional searches were performed for references to 16S rDNA related terms in 1,455 documents containing references to a marine species. References to marine species in PCT applications containing a sequence listing were reviewed based on data provided by WIPO. The patent datasets of full texts were manually reviewed based on the intersections between species names, habitats, places and references to new or novel strains and new species and allocated weight scores. The results of this research are reported in Chapter 5.
4.0.3 Trends in Patent Activity
In total we identified 4,759 Latin species names for marine species, including variant names, which resolved to 4,461 taxonomically accepted names based on GBIF data. Marine species appeared in 61,045 publications originating from 23,091 first filings and linked to approximately 250,309 family members worldwide.
The first and basic question that we can address in this data is whether in general terms references to marine species are increasing in the patent system. Secondly, we can identify patent trends based on whether these species are known to occur inside or outside the EEZ.
Patent data can be counted in a number of ways. Counts of patent families refer to counts of the first filings of a patent application anywhere in the world using the standard international INPADOC system. Counts of patent families have the advantage of counting a claimed invention only once and thus provide an indicator of innovative activity. However, because patent data only becomes available when an application is published – up to 2 years after filing – counts of patent families rapidly decline the closer we move to the present due to data availability issues. This produces a data cliff in patent statistics (see below). In the present research we regard the data on patent families to be robust until 2010 with data availability degrading from 2010 onwards in the October 2013 edition of PATSTAT.
In contrast, counts of publications refer to publications of applications and grants. These are confined to the three main jurisdictions covered by the research but are useful for mapping trends in applications and grants. Counts of family members refer to counts of all patent publications around the world that link back to a first filing as its parent or “priority”. Counts of family members are an indicator of global demand for patent rights that reference marine species.
Figure 4.3 displays trends in patent activity for documents referencing the 4,759 species in our data.
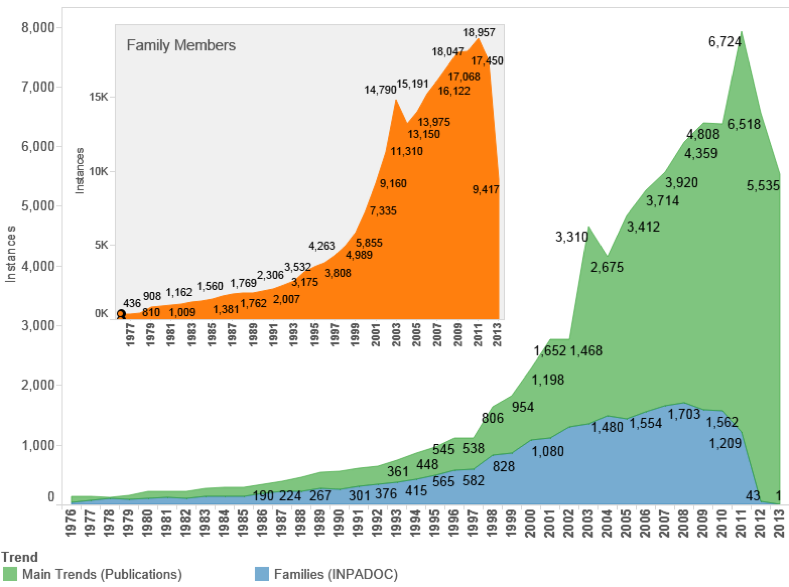
Figure 4.3: Trends in Patent Activity Referencing Marine Organisms
When approached from the bottom up, by focusing on patent families we can observe a steady rise from 2000 onwards with a peak of 1,645 filings in 2008. In the wake of the global financial crisis a temporary downturn was observed in patent filings in general and this is likely to be reflected in data for 2009–2010. Data from 2011 onwards will be affected by a lack of data arising from the delay in the publication of patent documents.
Trends based on publications display a steep increase that can be accounted for in two main ways. First, patent applications are typically published once as a patent application and also, if they meet the criteria, as a patent grant in one or more countries where the application is pursued. This introduces a multiplier effect into the data. Patent publication data also lags behind family count data because a document is published at least 2 years after filing. Second, prior to 2001 the United States Patent and Trademark Office (USPTO) only published granted patents. From 2001 the USPTO began publishing patent applications. This introduces a radical spike for 2001–2002 across patent statistics but is a reporting effect rather than a reflection of increased filings. In the case of increasing trends in publications after the decline of filings in 2008 this is likely to reflect the continued pursuit of patent rights by applicants where a filing had already been made. The data is also likely to be affected by repeat filings of variations of original filings (divisional or continuation filings) that enhance the multiplier effect. Data on global family members reflects global trends.
As this makes clear, there is a need for care in interpreting patent statistics. However, Figure 4.3 reveals that patent activity making reference to marine species measured on first filings has increased over the last decade but is not, as a measure of innovation, showing an exponential increase. In common with other areas of patent activity, patents referencing marine species were affected by the global financial crisis. However, trends based on patent publication counts in the main jurisdictions and global family members strongly suggest increasing demand for patent protection referencing marine species in multiple countries. This is significant because while first filings may be relatively stable, applicants are increasingly pursuing protection in multiple countries around the world. That is, they are willing to pay for protection in multiple markets based on the expectation of future income from products or the licensing of intellectual property [73].
Figure 4.4 displays levels of activity for the main patent offices based on the types of document for the European Patent Office, the United States Patent and Trademark Office and the Patent Cooperation Treaty.
In interpreting Figure 4.4 note that prior to 2001 the United States only published patent documents at the grant stage. For this reason applications only appear from 2001 onwards. In contrast, the Patent Cooperation Treaty does not award patent grants, which are awarded by national offices, and therefore the data is confined to patent applications17.
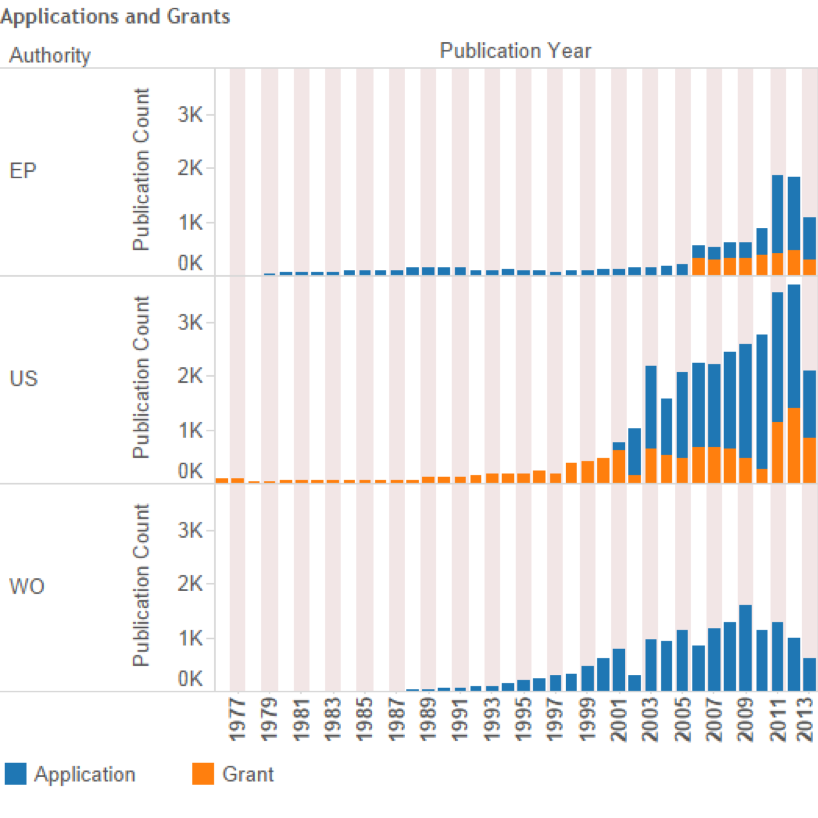
Figure 4.4: Trends in Applications and Grants Referencing Marine Species at the Major Offices
Figure 4.5 displays the top marine species appearing in patent documents. In approaching Figure 4.5 it is important to note that some species, notably fungi such as Aureobasidium pullulans and Aspergillus terreus, are cosmopolitan and distributed across multiple habitats. These species will therefore often appear at the top of the rankings. In other cases, such as Thermotoga maritima, members of Thermus and Thermococcus, a species may be found both in terrestrial hot springs and at hydrothermal vents. This may also hold true for less well known species isolated from core samples from marine ocean sediments or oceanic crust and those taken from oil wells or mines in terrestrial environments. In short, it is important to recognise that organisms, notably fungi and bacteria, may be distributed across multiple environments and a marine origin cannot simply be assumed. Lack of clarity on this issue can also introduce inadvertent errors into the literature on ABNJ. For example, Thermus aquaticus, Thermoplasma acidophilum and Sulfolobus solfataricus have been described as deep-sea marine species in the literature but were first recorded in terrestrial environments (see below). Conversely, while much attention in marine scientific research has focused on bacteria and archaea it is important to recognise that fungi are important in marine environments, including the sub-sea floor [74–76].
Figure 4.5 also displays counts of the number of times that a Latin species name occurs in the Title, Abstract or Claims section of a patent document (TAC Occurrences). Whereas references to a marine species in a patent document may take the form of a passing or casual reference, the appearance of a species in either the Title, Abstract or Claims strongly suggests that the patent document is fundamentally about material from this species or, in the case of a pathogen, is targeting this species. As we will see below, in other cases such as fish vaccines or fish feed, applicants may provide long lists of species in the patent claims where the invention can be applied in aquaculture.
Important species in Figure 4.5 include the jellyfish Aequorea victoria and the sea pansy Renilla reniformis as sources of Green Fluorescent Protein (GFP) that is widely used as a marker for reporting the expression of a desired outcome in genetic engineering and emerging areas of science and technology such as synthetic biology.
Figure 4.5: Top Species (all marine organisms)
In these cases, the discovery and development of Green Fluorescent Protein led to the joint award of the 2008 Nobel Prize in Chemistry to three researchers [77]. However, Green Fluorescent Protein is routinely produced in hosts such as E. coli and is not associated with repeated collection of the original organisms. A second major area reflected in Figure 4.5 are thermostable enzymes represented by Pyrococcus furiosus and Thermococcus litoralis. Both organisms possess enzymes that can be used in Polymerase Chain Reaction (PCR) for the transformation (amplification) of small samples of DNA into larger samples of identical DNA. PCR is most closely associated with the thermophilic bacterium Thermus aquaticus, originally isolated from Mushroom Pool in Yellowstone National Park. Until it was invalidated in 2004 the key patent protecting Taq DNA Polymerase was widely criticised for creating high costs for researchers and this contributed to the development of guidelines on research tools by the National Institutes of Health (see below) [12]. In part, interest in other extremophile organisms from areas such as hydrothermal vents appears to have been spurred by growing interest in industrial enzymes and the quest to find alternatives to Taq DNA polymerase.
Figure 4.6 displays the top applicants that make reference to a marine species. The top-ranking applicant (based on the number of families) is Bayer Cropscience. However, it is here also that issues arise with the distribution of species. Thus, Bayer Cropscience records focus on fungi. While these species have been verified as marine species within WoRMS, and may include specialist marine strains, we anticipate that in many cases the species will be cosmopolitan and distributed in both terrestrial and marine environments. In short, species are under no obligation to comply with the neat categories into which we might choose to place them. As such, we need to bear in mind that marine species that appear in patent data may be located across multiple environments. As discussed below, uncertainty about the precise source of species also raises issues about the potential desirability of improved disclosure of geographic origin within patent applications.
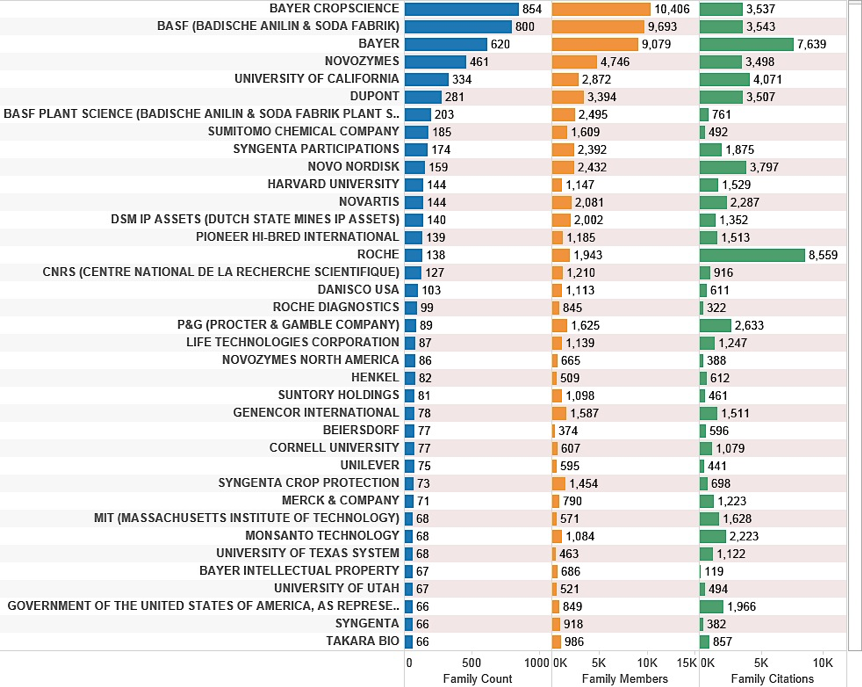
Figure 4.6: Top Applicants Referencing Marine Species Ranked on Family Count
This data raises the question of how to obtain a more accurate view of patent activity for marine species with a particular focus on the deep-sea.
4.0.4 Identifying Species from the Deep-Sea
To address the identification of species in patents by depth we used the available depth data from GBIF and OBIS to cluster the species by pelagic zones within the water column. Following experimentation with using latitude and longitude for mapping the occurrences of species inside and outside the EEZ within patent data we settled on the use of the country field in GBIF records to establish whether a species had been assigned to a country or occurs outside national jurisdiction. This was then cross-tested using actual coordinate data to test for the accuracy of GBIF country coding. Cross-testing revealed that GBIF coding is accurate but that actual coordinate data improves accuracy. We use the GBIF coding here because it is generally robust and provides a simpler method than the use of millions of coordinate records.
For the purpose of the clustering we divided the data into the epipelagic zone (0-200 metres in depth) and the deep-sea zone (pelagic zones below 200 metres in depth). Figure 4.7 displays the percentage of species records with depth data in GBIF where No refers to GBIF records with a null value, Zero is records assumed to be taken at sea level and Yes refers to actual depth records. In total 3,129 species possessed some form of depth record and 808 lacked a depth value representing 16.98% of the data. We also assume that depth values entered as zero will also in some cases be default values where no depth data is available. We also identified false positives in the data such as the extremely unlikely occurrence of a Tiger shark (Galeocerdo cuvier) in the Hadopelagic zone at 8,290 metres. At the time of writing the deepest recorded fish is Pseudoliparis amblystomopsis first identified in 1955 and recently documented at 7,700 m by a joint UK and Japanese team [78].
To supplement the data on deep-sea species we added records from the World Registry of Deep-sea Species (WoRDSS) and for the genus Thermococcus18. This added 36 species and 10% to the total number of identified deep-sea species. As this suggests, analysis of species by depth is constrained both by the availability of depth data and the accuracy of depth data. With the exception of the obvious false positive above we are obliged to accept the accuracy of depth data provided in the taxonomic record while recognising that this merits further work in collaboration with GBIF and the taxonomic community.
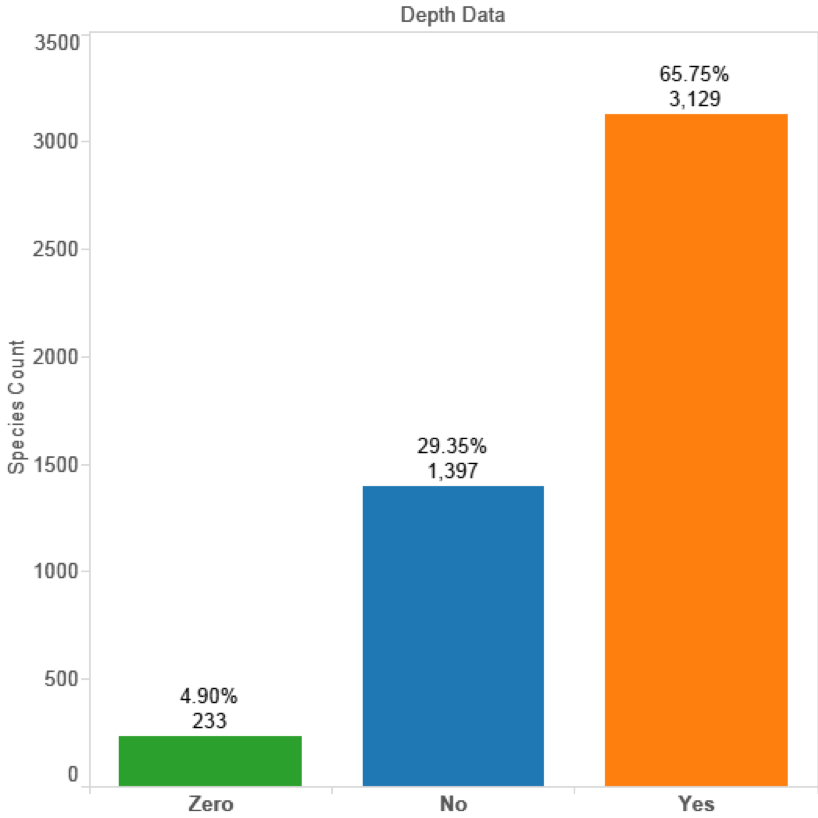
Figure 4.7: Depth Records for Marine Species in GBIF
Taking these data limitations into account, Figure 4.8 (see inset) demonstrates that the majority of species that appear in patent documents are from the epipelagic zone inside the EEZ and that the majority of deep-sea species also occur inside the EEZ. This pattern is repeated in Figure 4.8 based on counts of patent families (first filings). We use counts of patent families because it counts a claimed invention only once and therefore provides a more accurate measure of innovative activity than counts of later publications of the same application.
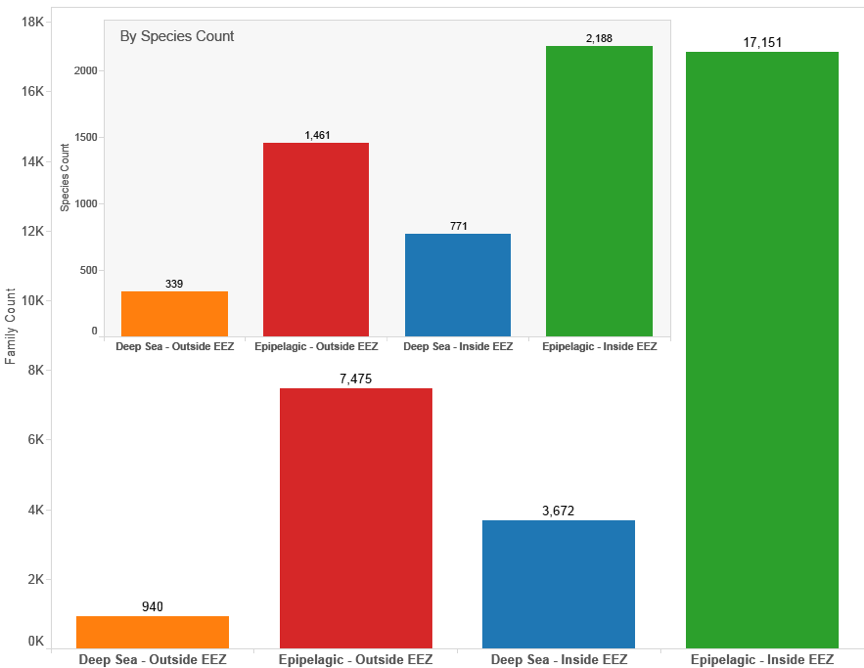
Figure 4.8: Species and Patent Data by Geographic & Depth Zone
Figure 4.9 displays the same data but confines the results to cases where a species name appears in the titles, abstracts or claims of patent documents. This data provides an insight into claimed inventions that are in some sense fundamentally about marine species. This reveals that 1,174 species appear in the title, abstract or claims for species inside the EEZ and 704 from outside the EEZ.
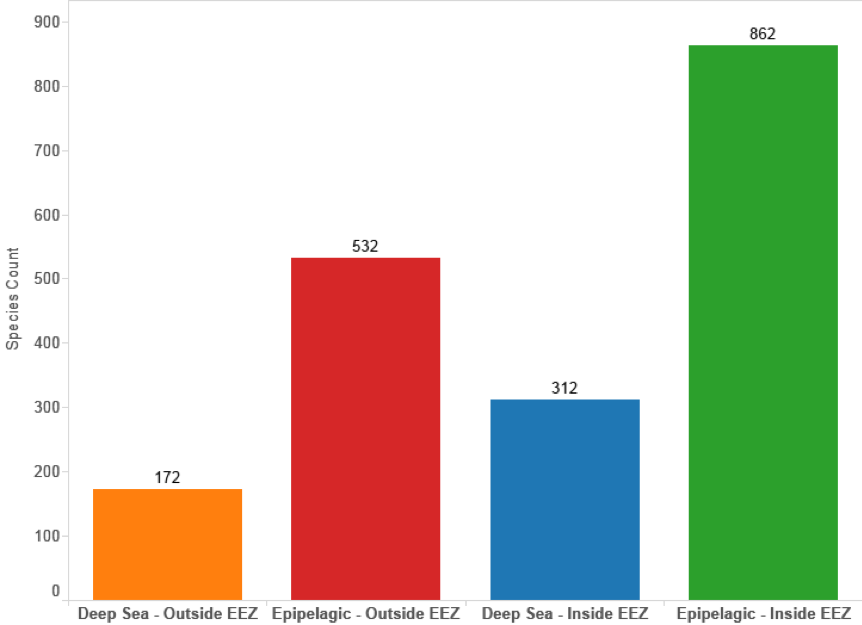
Figure 4.9: Species and Patent Data by Geographic & Depth Zone (Title, Abstracts, Claims, Species Count)
In considering these results we would note that in our view it is entirely logical that species inside the EEZ dominate the picture. In part this is because shallower water environments are more readily accessible but also because significant areas of deep-sea below 200 metres are found along continental margins and occur inside the EEZ. Given the major demands of research at depths below 200 metres it is also logical that activity will focus on more readily accessible sites within national jurisdiction.
Based on this data we now turn to more detailed analysis of activity based on records outside the EEZ. Figure 4.10 displays trends in activity by patent families (first filing) counts and the pelagic zone for records falling outside the EEZ based on counts of species references in documents (see Figure 4.1 above).
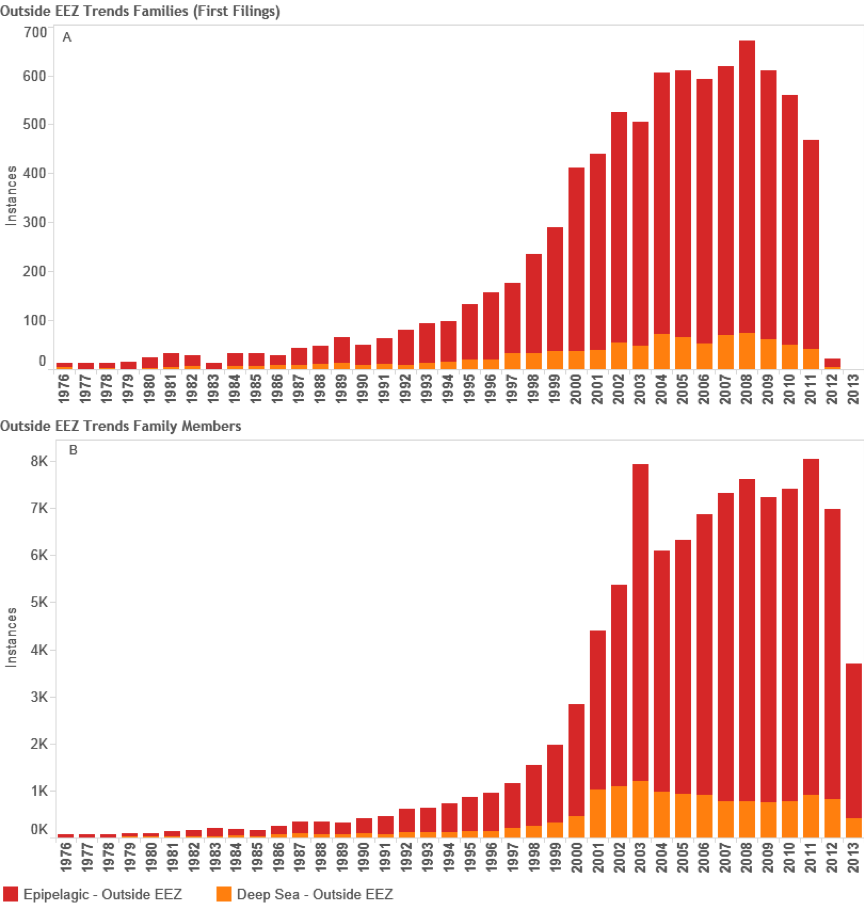
Figure 4.10: Trends in Filings Referencing Species Outside the EEZ
In total we identified 8,039 first filings (families) of patent documents that include references to species known to occur in Areas Beyond National Jurisdiction. Figure 4.10 Panel A suggests that based on trends in first filings epipelagic species dominate trends in activity with a peak of 596 filings in 2008 before declining in 2010. We are not able to make a judgement about trends in the period 2011–2013 because of the lack of available data on filings in PATSTAT (October 2013 edition). In the case of the deep-sea zone (-200 metres) the data is seriously constrained by a lack of depth data for bacteria and archaea that will appear in the epipelagic zone. The available information suggests that filings peaked at 74 families in 2008 before declining between 2009 and 2010. We would note that this decline could be reversed if more accurate depth data was available for bacteria and archaea. While recognising the limitations of depth data in our view it is nevertheless the case that the number of first filings of patent applications referencing marine species from Areas Beyond National Jurisdiction (ABNJ) is significant at between approximately 550–650 filings per year but would be quite modest if compared with other areas of activity. For the purpose of comparative analysis Figure 11 displays trends in patent filings for traditional or herbal medicines from plants based on data from PATSTAT October 2013 and International Patent Classification code A61K36. Figure 12 displays the same data but this time focuses on the key patent indicator for biotechnology and genetic engineering (C12N).
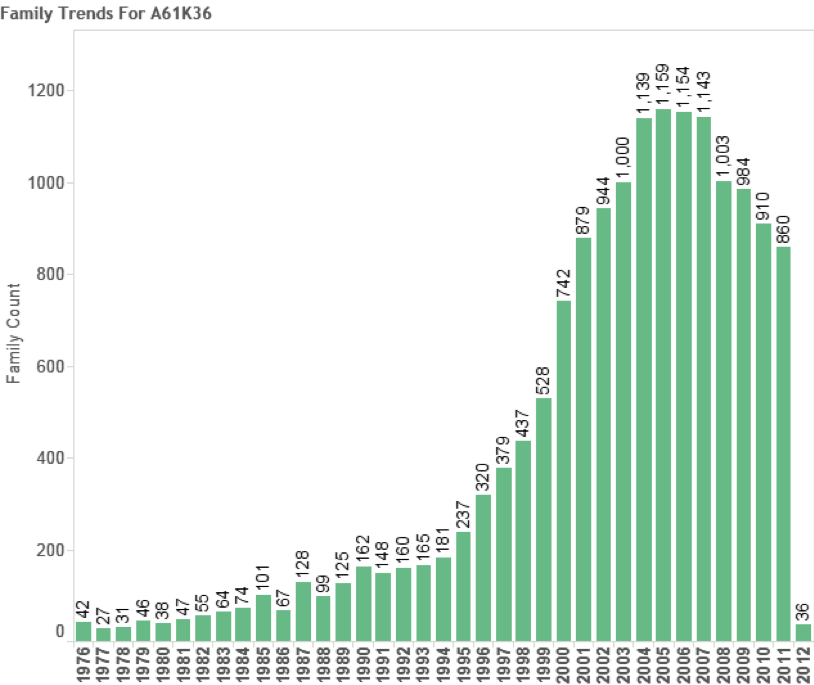
Figure 4.11: Patent Trends for Traditional Medicines from Plants
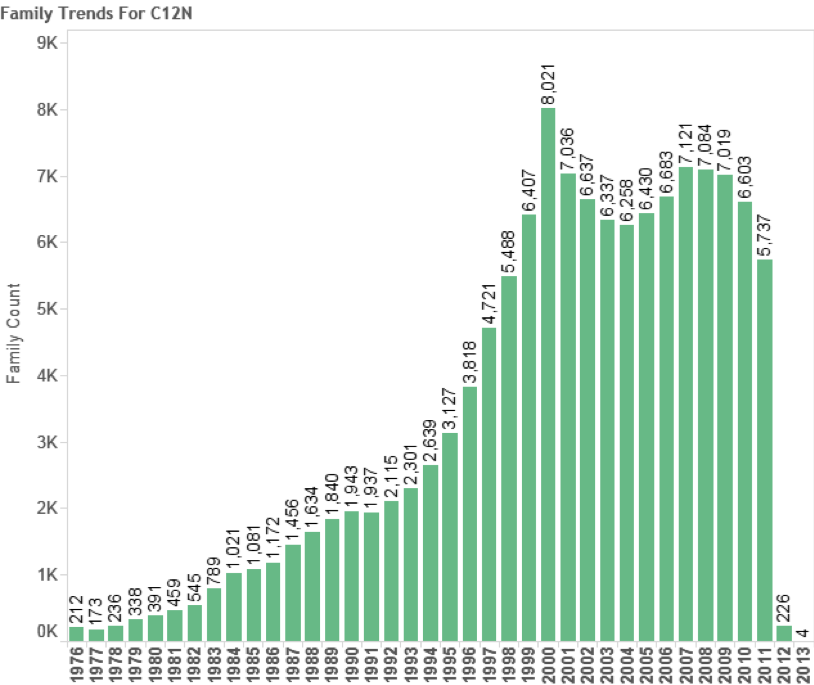
Figure 4.12: Patent Trends in Biotechnology (Key Indicator C12N)
As this data makes clear while the growth in patent filings referencing marine organisms from outside national jurisdiction is significant it is best classified as emergent. In particular, we make this observation because of uncertainties regarding the precise source of species outside the EEZ and because levels of activity for species references in the Titles, Abstracts or Claims are inevitably lower (see below).
However, a different picture emerges if we consider global demand for patent protection in multiple jurisdictions. Figure 4.10 Panel B (above) displays trends for global patent family members representing applications and grants in multiple countries that arise from the first filings, broken down by major pelagic zone. In this case a marked peak is observed in 2003 followed by a sharp decline. We believe that this possibly reflects the working through of the impacts of an economic downturn on biotechnology from 2001 onwards into the international system. Following a period of growth, activity peaks in 2008 (corresponding with the global financial crisis) before recovering to a fresh peak in 2011. Once again, data for 2011–2013 is incomplete.
In considering these trends it is important to emphasise that previous studies have not attempted to divide the data by pelagic zones and have relied on a more limited set of data. While significant difficulty remains, the present research moves analysis forward. Our data reveals that there has been an increase in patent activity making reference to marine species in general and this is partly reflected in trends for species known to occur outside the EEZ. However, it is important to distinguish between trends in first filings or families (as a proxy for new inventions) and trends in global demand for protection arising from those filings (family members). As a measure of inventions new filings referencing marine species known to occur in Areas Beyond National Jurisdiction (ABNJ) have been relatively stable at approximately 550–650 per year since 200419. This figure would decrease if only those documents containing references to species in the Title, Abstracts or Claims were considered. Figure 4.13 displays these trends.
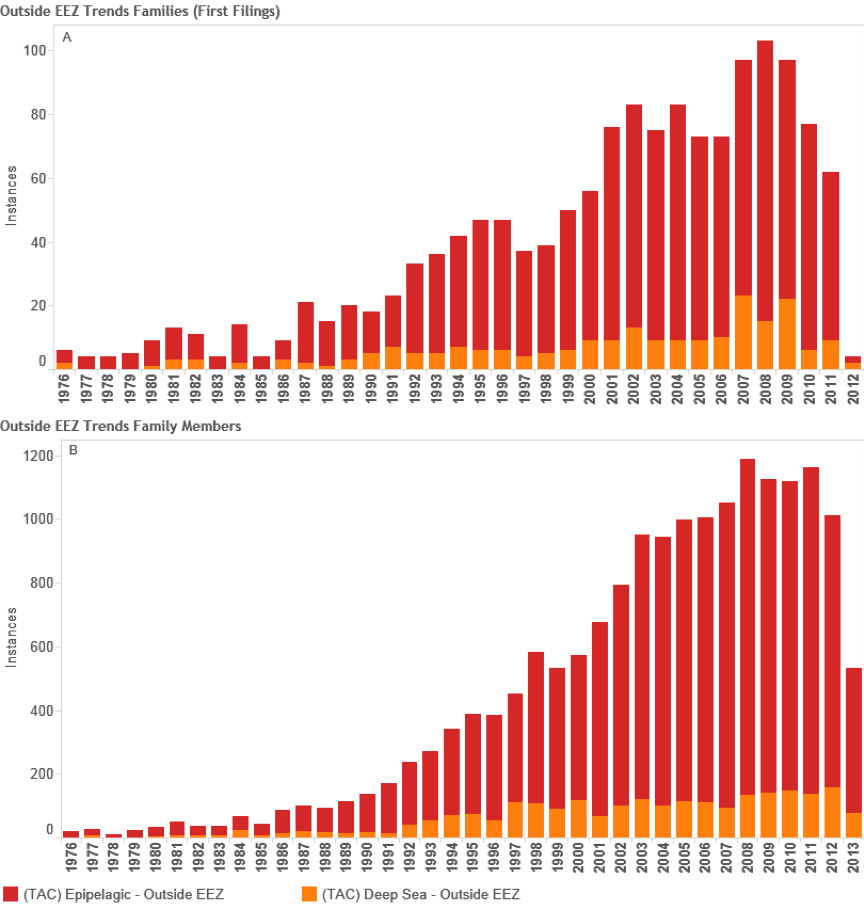
Figure 4.13: Deep-Sea Species in Titles, Abstracts or Claims
Figure 4.13 displays much lower frequencies on patent families and patent family members for deep-sea species with a peak of 93 filings in 2008. In practice, as noted above, an accurate indicator for marine genetic resources would lie somewhere between the data on patent documents referencing marine species and those referencing species in the Title, Abstract or Claims. What is interesting is that applicants are pursuing protection in multiple jurisdictions around the world suggesting that these species, or components from these species, are important to applicants in terms of their willingness to pay for protection in multiple countries. We now turn to other approaches to refining the analysis of marine genetic resources in patent data from Areas Beyond National Jurisdiction (ABNJ).
4.0.5 Sequence Data and New Species in Patent Data
Our analysis has focused on identifying named marine species in patent data with the purpose of identifying trends in patent activity. Previous research has focused on the analysis of sequence data in patent documents that contain a known gene from a marine species using patent sequence data from GenBank. The two approaches differ significantly in their methods and outcomes as follows:
- Previous research focuses on counting the number of marine species associated with genes that appear in patent documents;
- We focus on counting the number of patent documents that contain reference to a marine species.
The first approach highlights the number of marine species that are associated with genes listed in patent sequence data. In contrast the present report identifies patent trends as a proxy indicator for commercial research and development involving marine organisms. In short the two approaches are counting different things. This has important consequences for our understanding of commercial interest in marine genetic resources.
For the purpose of comparative analysis we used the raw patent data provided by Arnaud-Haond, Arietta and Duarte (2011) on sequences referencing genes from marine organisms in patent data from WIPO. Of a total of 594 patent documents listed in this research we were able to identify 588 in Thomson Innovation (99%)20. We then obtained the latest list of Patent Cooperation Treaty documents containing sequences from WIPO. Rather than focusing on the identification of genes associated with a marine species in a patent document we focused on identifying references to marine species in a Patent Cooperation Treaty document containing a claimed sequence. Figure 4.14 displays the results in comparison with the earlier research.
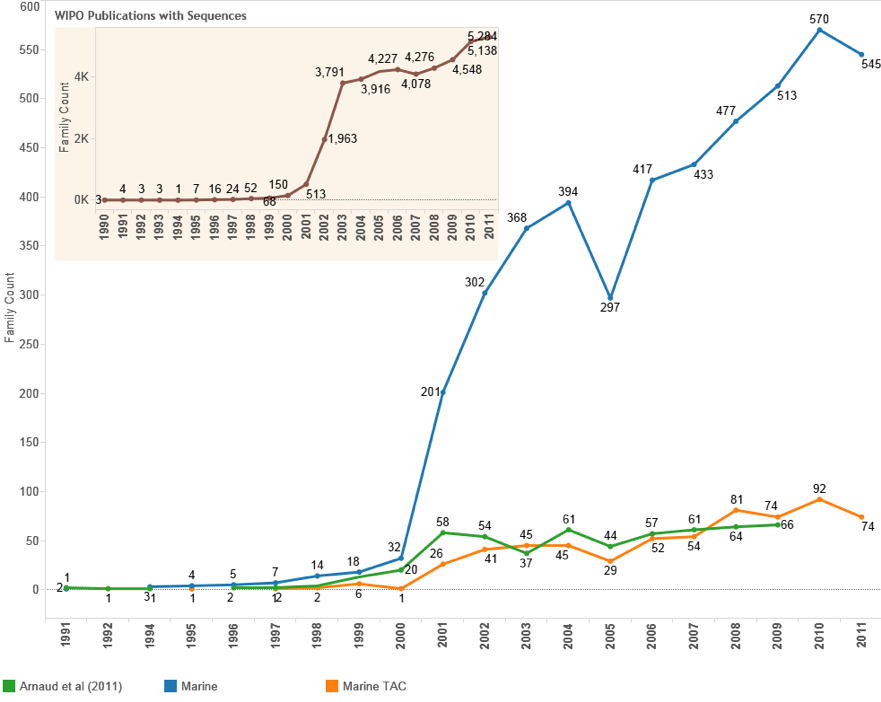
Figure 4.14: Trends for Patent Filings with DNA Sequences relevant to Marine Organisms under the Patent Cooperation Treaty
Figure 4.14 is based on counts of patent families based on the filing year. We can immediately see that patent filings containing a sequence listing that also reference a marine species (Marine) occur at much higher frequencies than in previous research. However, because a marine species may be referenced for a variety of reasons, notably as the source of an enzyme for use in PCR, rather than being material to the claimed invention, we further limit the data to documents where a marine species appears in the title, abstract or claims (Marine TAC). The most striking feature of this approach is that, with some variance, it closely follows the trend for the results of previous research using GenBank patent sequence data [17]. In short, we have made progress in bridging the gap between the two methodological approaches. However, further work is necessary to clarify whether claimed sequences are actually taken from organisms in marine environments or whether such sequences derive from terrestrial or aquatic members of a species.
Figure 4.15 displays the data on deep-sea marine species appearing in PCT patent applications with sequence data.
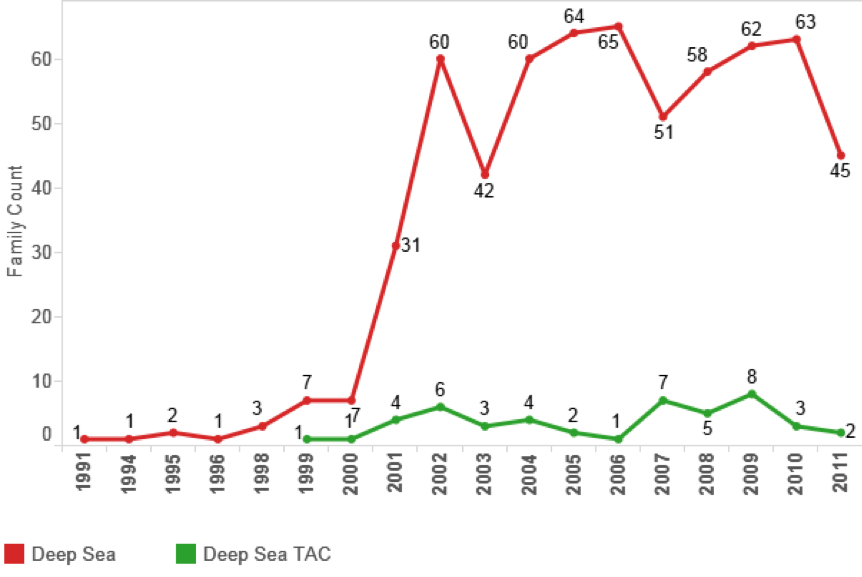
Figure 4.15: Patent Documents with DNA Sequences in the Claims referencing species from Outside the EEZ
We can immediately see that general references to deep-sea marine organisms in patent applications with sequences in the claims are significant but stable in the region of 60–65 filings per year. However, those that reference deep-sea marine species in the title, abstract or claims are minor. In considering this data we would note that closer attention to the way in which applicants construct patent claims is desirable. Our data focuses on the identification of binomial Latin species names in the patent data. However, applicants frequently construct claims on the family or genus level to capture any species with a corresponding sequence in that family or genus. This would increase the counts and merits further investigation in future research.
As noted above, previous research has highlighted that the number of patent claims associated with genes of marine organisms is growing at 12% per year. However, this is not the same as counting new filings of patent applications. As can clearly be seen from the data provided by Arnaud-Haond et al., (2011) and the present research on marine species in the Title, Abstract or Claims of patent filings with DNA sequences, when viewed from the perspective of patent filings the data is relatively stable.
An alternative approach to examining patent activity for marine organisms from Areas Beyond National Jurisdiction is to count species the first time they appear in the patent system. In this approach the first reference to a marine species in a filing is identified by filing year and then excluded in all later years so that it is counted only once. This allows trends in the appearance of species that are new to the patent system to be identified. We use the term ‘species new to the patent system’ to highlight that species may be new to the patent system but they are not necessarily new to science. Figure 4.16A presents the results of this exercise in the whole texts of patent documents and Figure 4.16B presents the results for references to marine species outside the EEZ in the Title, Abstract or Claims.
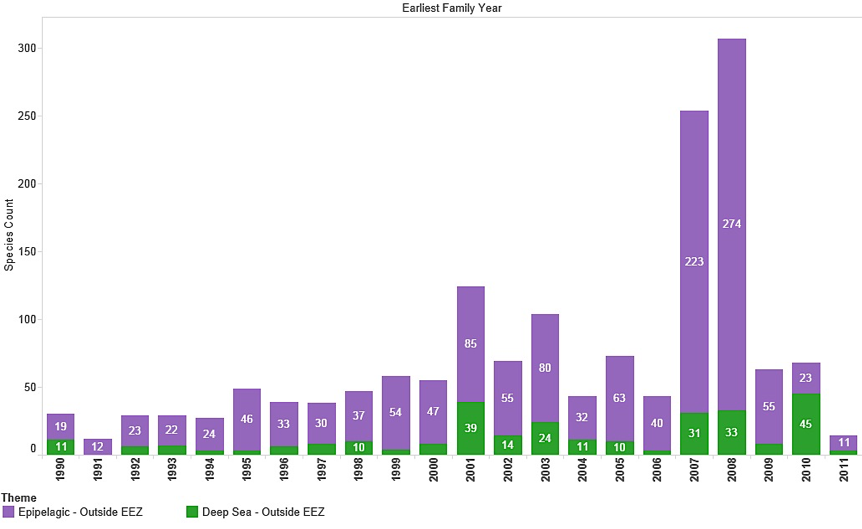
Figure 4.16A: Trends in New Marine Species in Patent Data (Outside EEZ)
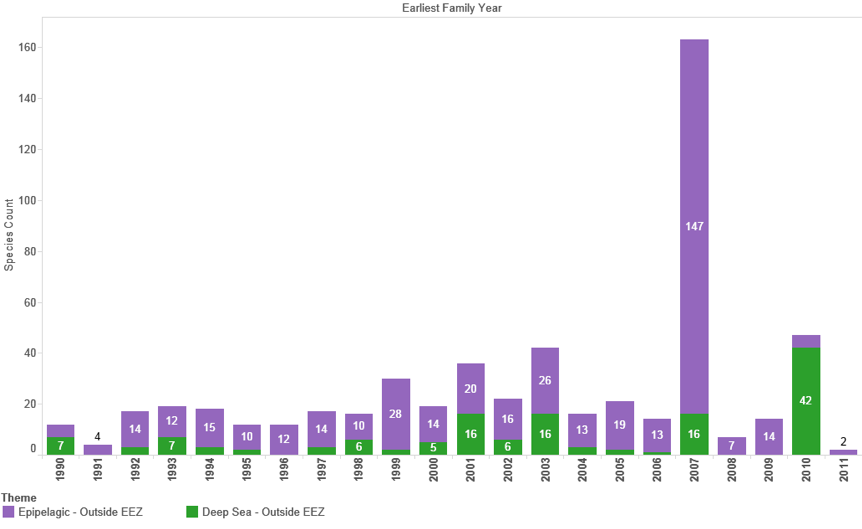
Figure 4.16B: Trends in New Marine Species in Patent Data (Outside EEZ) in Titles, Abstracts or Claims
Figure 4.16A and B reveal a variable picture in the entry of new marine species occurring outside the EEZ into patent data with an increasing trend observable in the data for the 1990s. As expected, species new to the patent system appear with lower frequency in the Title, Abstract or Claims of patent data. However, this also exposes the need for caution in the analysis of patent data. Thus, the spike in the appearance of species new to the patent system in 2007 in Figure 4.16A and B is due to a single application from Pharmaq in a patent application for Treatment of Parasite Diseases Using Vitamin K3 focusing on a fish feed composition (WO2009063044A1). The claims section of this application makes reference to over 100 fish species but the application is actually concerned with a Vitamin K3 composition that can be used to treat parasites in multiple fish species. In short, species new to the patent system may appear as the target for a claimed invention rather than being material to the invention.
In presenting this data our aim has been to clarify the issues involved in identifying and counting marine genetic resources from the deep-sea in patent data. It should now be clear that a variety of measures are available for counting marine species and deep-sea marine species in patent data. Each will have strengths and weaknesses.
In considering these results compared with earlier research it is important to note that growing trends in the sequencing of the genomes of organisms signifies that the same, or substantially similar, DNA sequences will be discovered in an increasing number of other organisms. It is therefore logical that the number of species associated with a particular gene sequence will expand over time as DNA database coverage improves. This is an outcome of the advancement of scientific knowledge. What we learn from this is that sequences or genes appearing in patent documents are associated with an increasing number of marine organisms.
This performs the very useful service of highlighting that permitting claims over specific gene sequences may also provide patent protection for all matching sequences that are subsequently identified in other species in the context of debates on the patentability of DNA. However, this is not the same as attempting to identify whether interest in marine organisms is increasing in the patent system. That can only be measured by counting the number of new inventions that involve or utilize marine genetic resources in the claimed invention.
The problem here is that an emphasis on counting the number of marine species associated with genes that appear in patent documents may become confused with measuring trends in the filing of patent applications. This could give rise to the perception that patent activity is increasing exponentially and will inevitably continue to do so. The present research reveals a more variable picture of activity using a variety of approaches. Furthermore, as discussed above, the appearance of marine species from outside the EEZ that are new to the patent system will also vary over time. Caution is required in interpreting quantitative data with respect to whether components of an organism are material to an invention or whether the organism is a target of the invention. Further work is clearly necessary to refine analysis in this area with respect to species from ABNJ.
In our view, it is more likely that what we will observe is the intensification of patent activity around the genetic components of a limited number of marine species rather than a dramatic increase in the number of new species, or strains, entering the patent system. This would be consistent with earlier research by the authors of this report, which found that patent applicants display herd-like tendencies [6]. This herd-like tendency involves applicants clustering around promising new species sometime after they are recognised as economically important. Examples of this type of effect include well-known species such as Thermus aquaticus (the source of the Taq DNA polymerase), Taxus brevifolia (the source of a best-selling anti-cancer drug) and Hoodia gordonii (source of an initially promising weight loss compound and food ingredient). In the era of genomics and whole genome sequencing this is also more likely as genome sequence data becomes available through GenBank and other databases. However, in other cases a species may languish and become forgotten in the patent system. We now turn to analysis of species from the deep-sea in patent data.
4.0.6 Top Species
Figure 4.17 displays the top species appearing in the data outside the EEZ for the epipelagic and deep-sea zones ranked on family counts. The figures next to the kingdom provide the maximum available depth data from GBIF records. As we can see references to cosmopolitan fungi such as Claviceps purpurea and Blumeria graminis continue to appear in the data. However, this type of species no longer dominates the data with Renilla reniformis and Sulfolobus solfataricus moving up the rankings. Plant species, such as the seaweed Chrondus crispus will appear in the data because they are widely distributed including in Areas Beyond National Jurisdiction. For the deep-sea zone (below 200 m depth) entries for Mytilus edulis (the common mussel) and Squalus acanthias (the spiny dogfish) provide an indicator of significant deep-sea species in patent data.
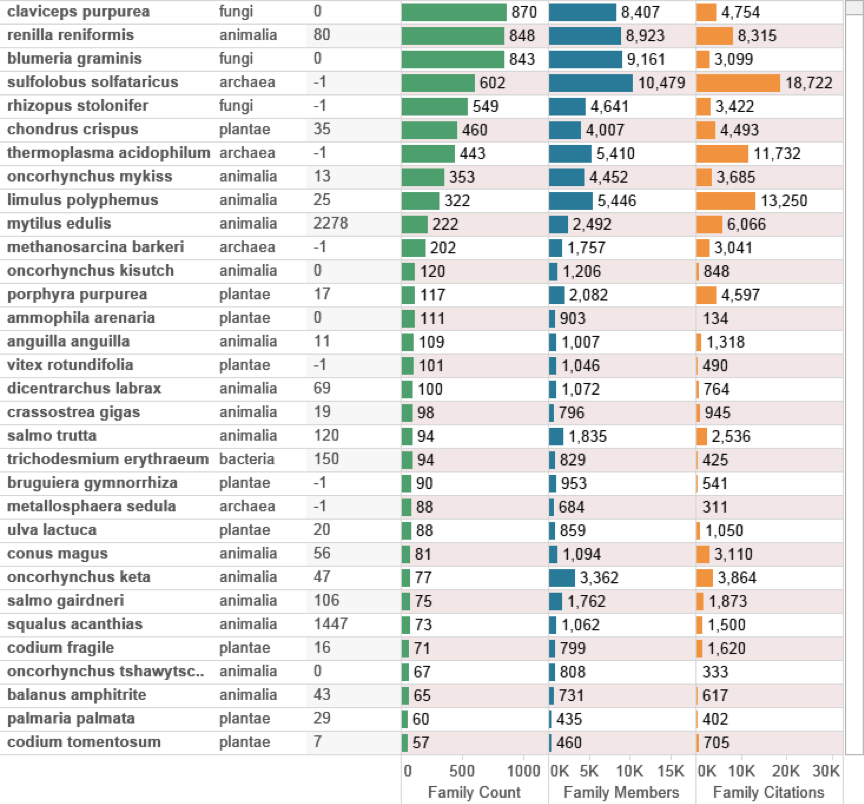
Figure 4.17: Species Outside the EEZ by Depth and Family Count.
Figure 4.18 (below) displays the data purely from species classified as occurring in the deep-sea zone (-200 m) and are clearly dominated by animal macrofauna based on the number of families with the exception of the diatom Chaetocerus gracilis as a member of the Chromista. As discussed above, this will reflect the absence of depth data for bacteria and archaea in taxonomic databases as an important constraint on analysis of species based on depth data.
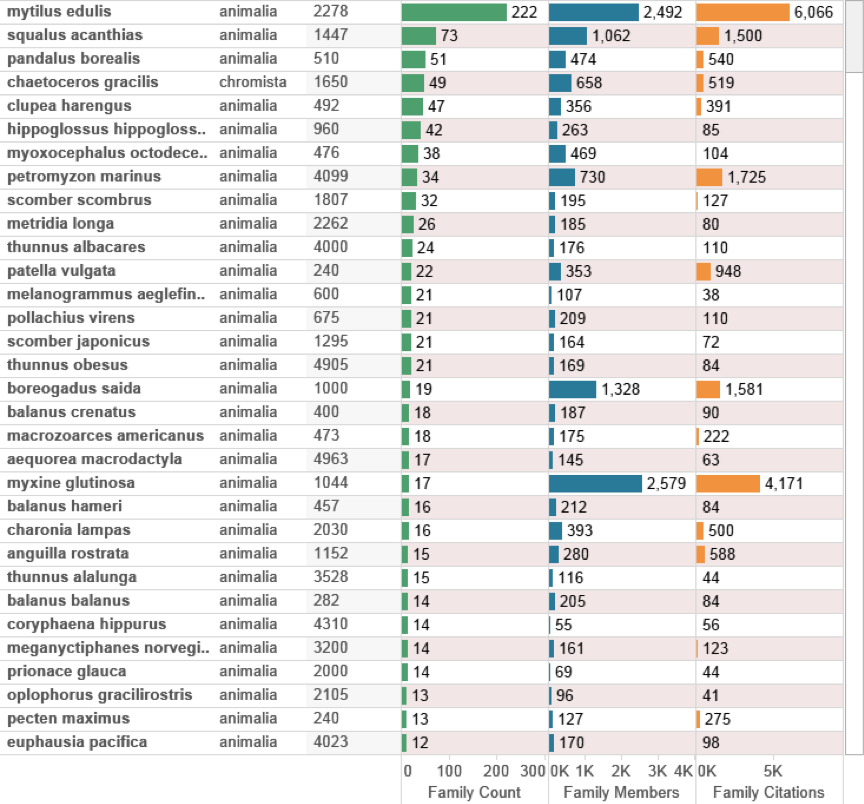
Figure 4.18: Species occurring Outside the EEZ in Patent Data Recorded Below 200 metres
In assessing this data, family counts provide an indicator of the number of inventions that make reference to the species in the text. Family members provide an indicator of global demand for inventions that contain a reference to the deep-sea marine species while family citations provide an indicator of the impacts of the patent families referencing the organism. Patent family members and citations are a key indicator of the economic importance of patents. Patent family size (based on counts of family members) provide an indicator of the willingness of applicants to pay for patent protection in multiple countries. In contrast, citation counts are an indicator of the impact that a filing, or set of filings, has on later applicants by limiting later claims to the same or similar invention. Because an application for an invention must be new (or novel) and involve an inventive step, applications are assessed in light of the prior art. Where prior patent or scientific art exists for the claimed invention or aspects of the claimed invention the applicants must either abandon the application or modify the claims to accommodate the prior art.
In interpreting this data we would reasonably expect species with large numbers of associated family members to generate more citations. Of greater interest however are relatively small family counts that generate large impacts in terms of citations such as Myxine glutinosa (the hagfish or Atlantic hagfish). Figure 4.19 displays the data for species outside the EEZ data ranked on family citation counts. We also introduce counts of the number of times a species name appears (occurs) in the Title, Abstract or Claims of a patent document (TAC Occurrences).
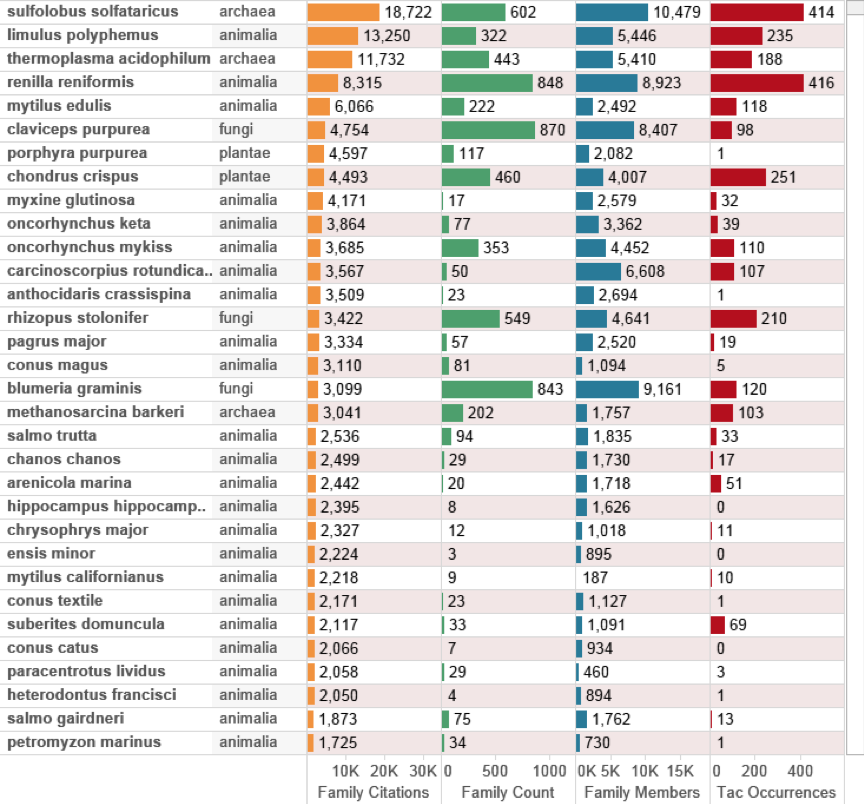
Figure 4.19: Top Species Appearing in Patents Occurring Outside the EEZ by Citation Counts
In considering Figure 4.19 it becomes clear that top species ranked by their impacts in the wider patent system are Sulfolobus solfataricus [79,80], Limulus polyphemus (the Atlantic Horseshoe crab) [81,82], Thermoplasma acidophilum [83,84] and the sea pansy Renilla reniformis [85]. In some cases, such as Sulfolobus solfataricus, a species was originally isolated in terrestrial hot-springs and subsequently discovered in deep-sea marine habitats [79] while Thermoplasma acidophilum was first identified in a coal refuse pile [83]. This once again highlights the obstinate refusal of species to conform to the geographical limits that humans may seek to impose upon them. More importantly, the introduction of the data on Titles, Abstracts and Claims illustrates that species appearing in high impact inventions are not necessarily referenced with high frequency in the title, abstract or claims. The reason for this will be either: a) that the reference to the species is purely general and not material to the invention or; b) the claims focus on a chemical compound or enzyme and do not directly reference the source species.
For the deep-sea data we are also able to focus on patent applicants using a variety of measures to interrogate the data. Figure 4.20 displays the deep-sea data ranked on counts of patent families. This closely mirrors the overall data for applicants referencing marine species with a reduction on family (filing) counts and movement in the rankings of applicants. This provides an indicator of global demand for protection by applicants making reference to a deep-sea species.
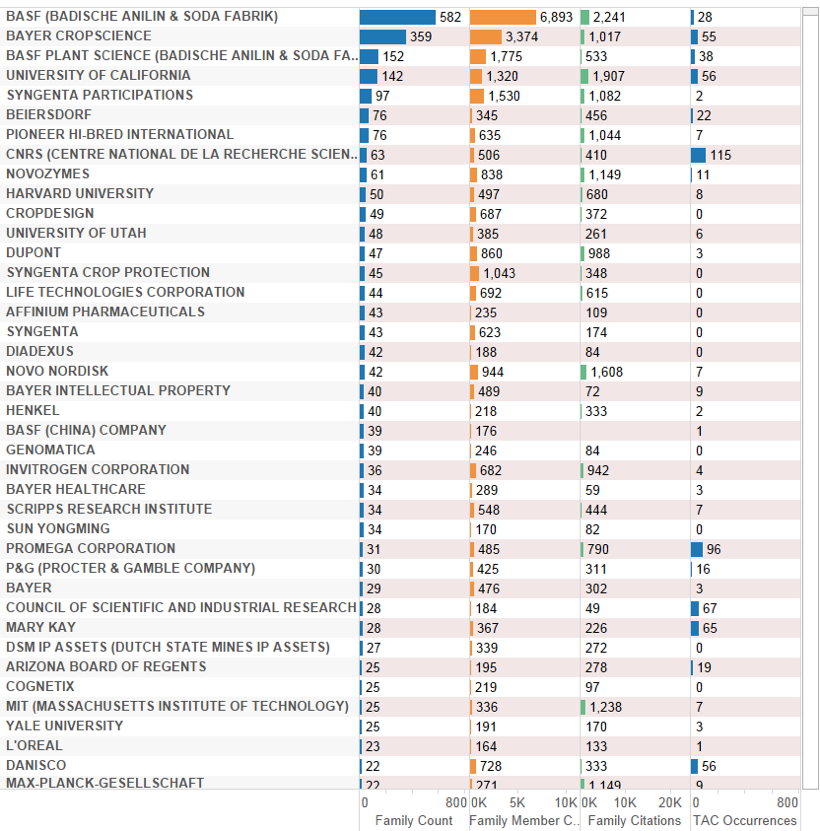
Figure 4.20: Patent Applicants Referencing Species Outside the EEZ Ranked by Family Members
An alternative measure of the rankings of applicants is to count the number of times that an applicant makes reference to a species in the Title, Abstract or Claims of a patent filing (TAC occurrences). While this method can be affected by difficulties in distinguishing between different sections in documents, notably the abstracts and description in older documents, it is a useful indicator of the intensity of an applicant’s activity around a species or group of species. Figure 4.21 displays applicants ranked by the occurrence of a deep-sea species in the Title, Abstract or Claims.
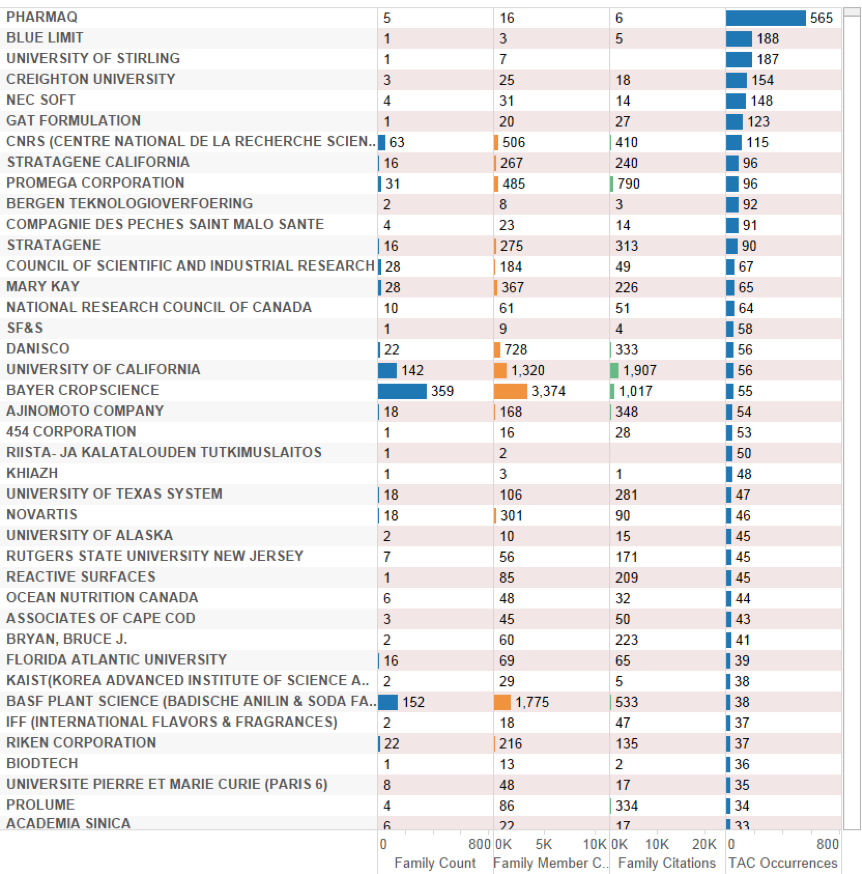
Figure 4.21: Applicants Ranked by Occurrence of Deep-Sea Marine Species in the Title, Abstract or Claims
The measurement of applicants by references to species in the Title, Abstract or Claims provides an indicator of applicants focusing on species. In the case of the top ranking Pharmaq, the application refers to a Vitamin K3 composition for treating parasites in large numbers of fish species (see above) (WO2009063044A1). In the second case, the company Blue Limit has also filed for a feed composition for aquatic organisms (WO2008084074A2). In contrast with Pharmaq, this includes proteins from sources such as krill or squid to be fed to fish and they claim the use of the feed for a large number of fish species. Finally, the University of Stirling has filed for a DNA vaccine against Aeromonas hydrophila in fish and claims the application of the vaccine in a large number of different fish species. As this suggests, more detailed review of the data would be required to identify patent documents that claim the use of a genetic resource from a deep-sea organism in a claimed invention.
An alternative way to examine the data by is by citations counts. Figure 4.22 ranks the deep-sea data by citation count.
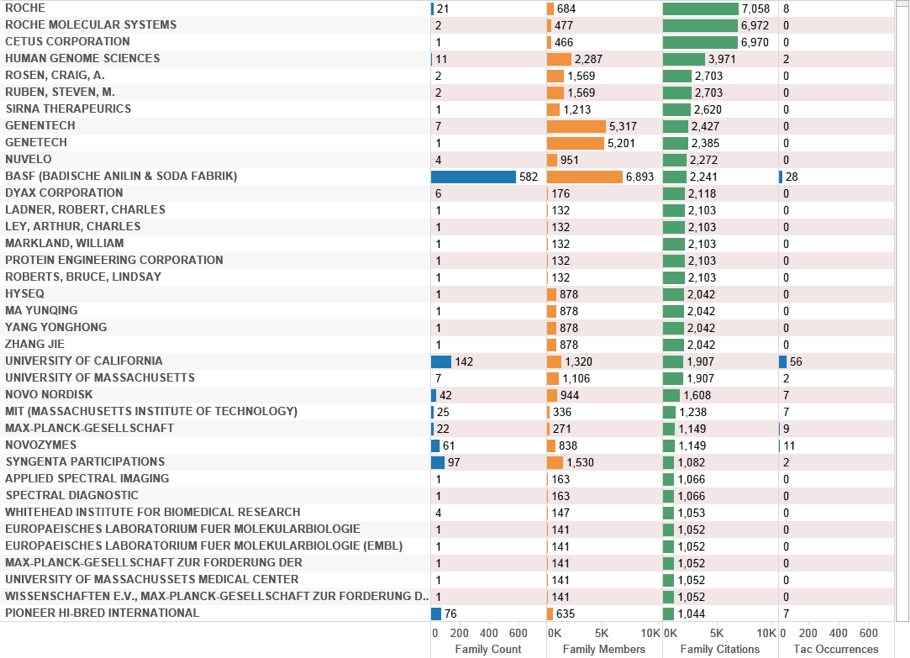
Figure 4.22: Applicants by Citation Count
Roche dominates the top ranking positions for patent filings linked with Polymerase Chain Reaction (see below) with individuals listed as co-applicants on filings also displayed. We can explore this data by displaying the records including species and accompanying citation counts by patent family. We illustrate this approach for Roche and Cetus (Figure 4.23).
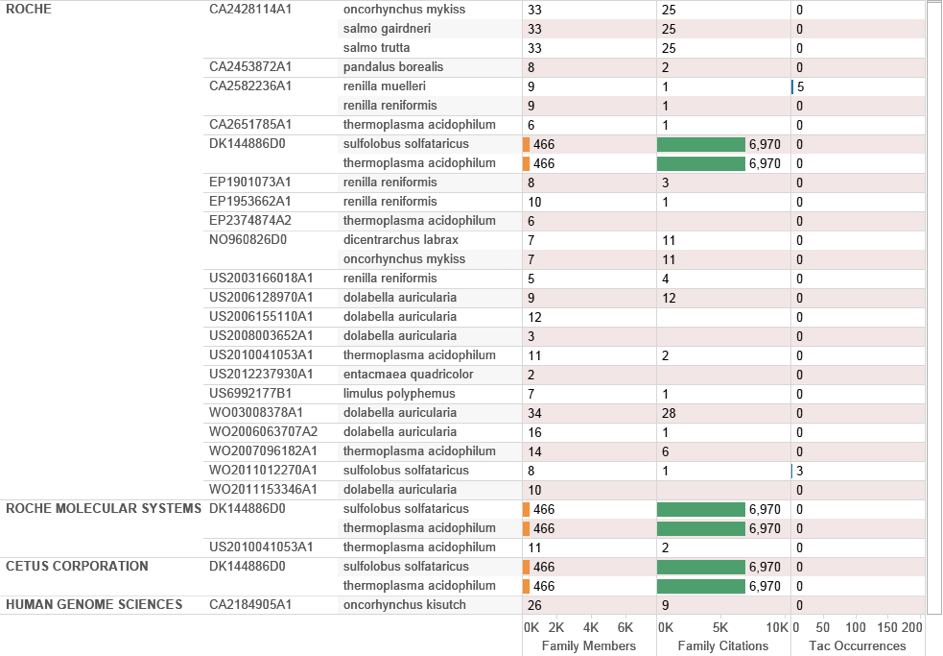
Figure 4.23: Applicant Breakout by Species and Citation
In considering this data note that the filing DK14486D0 dating to 1986 referencing Sulfolobus solfataricus and Thermoplasma acidophilum can be difficult to access in full-text because of its age21. In practice, this patent family containing 466 family members is one of the most important and influential in the history of biotechnology because it relates to the Nobel prize-winning Polymerase Chain Reaction (PCR). PCR allows small samples of DNA to be reproduced (amplified) in exact copies to radically increase sample size for research. The method essentially involves thermal cycling and enzymatic replication of DNA (where the polymerase is the enzyme). Cetus Corporation and later Roche submitted three key filings on PCR technology (US4683195A, US4683202 and US4889818A). The family members relating to this technology in the case of Sulfolobus solfataricus and Thermoplasma acidophilum relate to possible sources of the thermostable enzyme for potential use in the claimed invention as part of an indicative list where “The thermostable enzyme herein may be obtained from any source and may be a native or recombinant protein” (US5079352A). However, the applicants go on to state that: “The preferred thermostable enzyme herein is a DNA polymerase isolated from Thermus aquaticus,” and claim “A recombinant DNA sequence that encodes the thermostable DNA polymerase activity of Thermus aquaticus”. The key Roche patent in this family is in fact US4889818A for a purified thermostable enzyme from Thermus aquaticus.
Thermus aquaticus was first isolated from Mushroom Pool in Yellowstone National Park in the United States in 1966 and deposited in the American Type Culture Collection [86]. The subsequent identification of the Taq DNA Polymerase (Thermus aquaticus = Taq) by the patent applicants proved to be the most stable and effective enzyme at that time for the PCR process. According to later court documents in 1991 the original Cetus patent was reportedly sold to Roche for US$300 million and generated annual revenue of US$100 million [87]. The literature reports that Roche had gained revenue of US$2 billion from control of PCR technology although this figure is difficult to confirm [87].
The success of the Taq enzyme also sparked interest in the potential for extremophile organisms to generate returns for access and benefit-sharing to promote conservation. In international debates on access and benefit-sharing a 1997 Cooperative Research and Development Agreement (CRADA) between the US National Parks Authority and the company Diversa (now Verenium) was advanced as a potential model for generating conservation benefits from bioprospecting in protected areas [87–89]. However, the patents relating to Taq DNA polymerase had also become a focus of concern in the scientific community owing to the high price of the polymerase for use in experiments. This example contributed to the development of guidelines on access to research tools by the National Institutes of Health in the United States [90]. The patent also sparked a major long-running patent infringement lawsuit that culminated with the invalidation of the US4889818A patent grant under the Clean Hands doctrine whereby the applicant was found to have misled the United States Patent and Trademark Office (USPTO) at the time of application by claiming to have performed an experiment that had not been performed [87].
This example is relevant to debates on patent activity for organisms from Areas Beyond National Jurisdiction for three reasons. First, it illustrates that organisms may be referenced for a variety of reasons including patent applicants seeking to ensure that others cannot readily work around an invention rather than actual use of the genetic component. Second, it highlights the problem that flagship cases demonstrating the value of a genetic resource may not prove to be what they seem. In this particular case a US Court found evidence of fraudulent behaviour leading to invalidation of the patent. However, researchers and companies had been paying high prices for the patented enzyme for many years and that was not recouped. Finally, the Polymerase Chain Reaction patents, along with the Cohen Boyer patents on recombinant DNA technology (e.g. US4237224), are truly foundational patents in that they provided the foundation for the entire field of biotechnology. The exceptional nature of foundational patents means that they are extremely bad examples to use as a foundation for international access and benefit-sharing policies. Most patents are far less valuable and it is widely recognized in the literature on patents that most patents are low value and go nowhere. As such, international policy debates on access and benefit-sharing would benefit from a subtle or nuanced understanding of the workings and economics of the patent system. This could best be achieved through the analysis of specific historic cases involving marine genetic resources to generate lessons learned and greater attention to the assessment of the economic value of patents.
4.0.7 Countries
The existing literature on patent activity involving marine genetic resources has highlighted that “claims associated with marine genes originate from only 31 of the 194 countries in the world” with ten countries dominating 90% of patents containing marine genes and 70% from three countries led by the United States, Germany and Japan [17].
In practice it is possible to map the portfolios of countries referencing marine species by the priority country (country of first filing). Figure 4.24A maps the country of first filing for patent applications referencing marine organisms in general. Figure 4.24B displays the same data for applications referencing marine organisms from ABNJ.
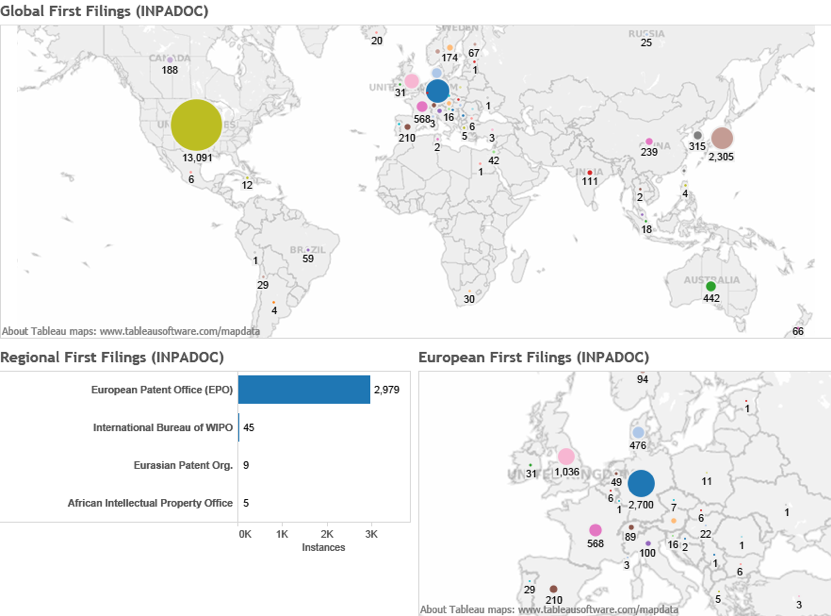
Figure 4.24A: Marine Genetic Resources in General
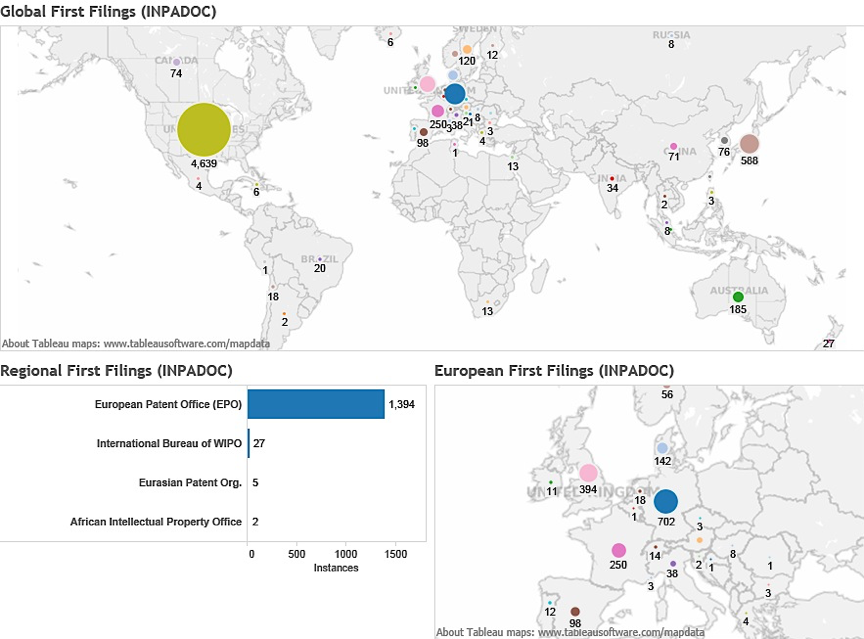
Figure 4.24B: Marine Genetic Resources in ABNJ
Within the underlying literature there has been a concern that a small number of countries are benefiting from the commercial exploitation of marine genetic resources leading to further investment in this kind of research that may broaden the gap between countries with capacity in this area and countries without this capacity [17]. This argument leads to support for the need for an international framework for marine genetic resources [17].
In our view this is a valid concern. However, in reality patent filings also reveal networks of collaboration between researchers and companies in different countries in a similar way to the collaboration networks discussed in the previous chapter. Figure 4.25 displays the network of collaboration between applicants based on country codes associated with each applicant.
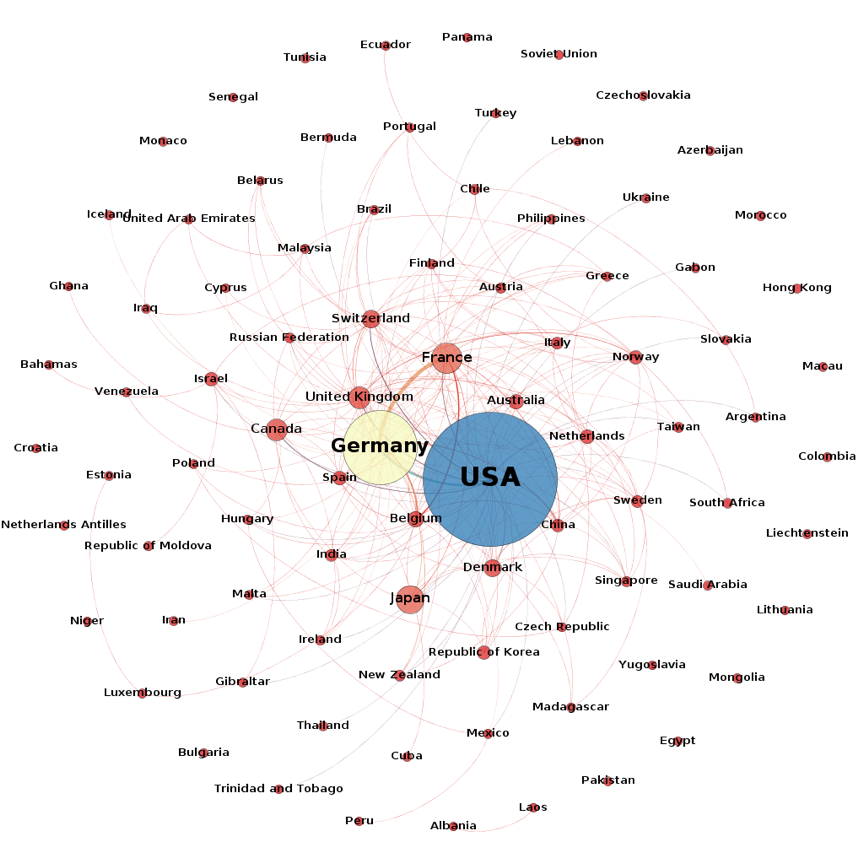
Figure 4.25: Applicant Co-Application Network for First Filings Referencing Species Outside the EEZ
What this data demonstrates is that while certain countries dominate the patent landscape for marine genetic resources, in practice we also observe networks of international collaboration across countries. This is significant because these networks provide indicators of technology and knowledge transfer across countries. What is less clear is the extent to which collaboration in patent activity results in rent transfers from revenue generated by patents across countries participating in patent filings. Nevertheless, while recognising the legitimacy of concerns about concentration in the existing literature it is also important to recognise that joint patent activity could be an important component in benefit-sharing under any implementing agreement in terms of technology and knowledge transfer and monetary benefit-sharing. We now turn to the analysis of patent data by technology area.
4.0.8 Technology Areas
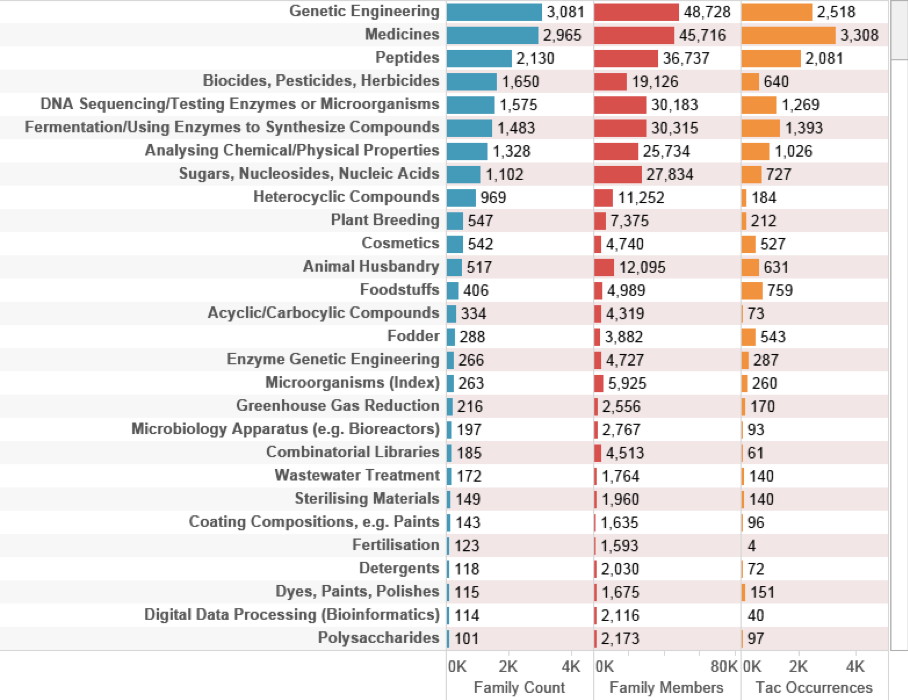
Figure 4.26: Technology Areas Marine Species Outside the EEZ
Figure 4.26 is based on International Patent Classification sub-class codes that describe the technical area of an invention. The code descriptions have been edited for display to capture the main technology areas. We can readily see that the data is dominated by genetic engineering and biotechnology followed by medicines (primarily pharmaceuticals), biocides (reflecting species that are a source and target of biocides). As we might expect, DNA sequencing and the chemical synthesis of enzymes using fermentation also feature prominently.
In terms of sectors, references to plant breeding and cosmetics are likely to reflect the use of components of marine organisms in applications and products in these areas. Fuller consideration of the technology areas involving marine genetic resources from outside the EEZ is provided in chapter 6. We now turn to the analysis of patent activity involving marine organisms for the UK.
4.0.9 UK Patent Activity
UK patent activity is a subset of the international activity identified above. To calculate UK patent activity we count patent filings that contain a UK country code (GB) in the applicant field as the primary measure. We then add patent filings containing a UK country code in the inventor data where the record also includes the UK as a priority filing. This second restricted measure has the effect of removing records where a UK inventor is working for a non-UK company or organisation on the grounds that they are non-resident (e.g. working for a European or other company). Note that UK applicants often file patents with residents of other countries either as individual co-applicants or as joint applications with other companies. For this reason non-UK collaborating companies will appear in the data. Furthermore, where a UK subsidiary of an international company (e.g. Syngenta UK) files a patent application as a UK applicant they will also appear in the UK data.
In this discussion we begin with overall UK international activity for patent documents referencing marine species. We then turn to analysis of UK international activity for deep-sea organisms.
Figure 4.27 displays trends in UK international activity making reference to a marine species inside or outside the EEZ with trends on publications reflecting activity at the European Patent Office, the USPTO and the Patent Cooperation Treaty.
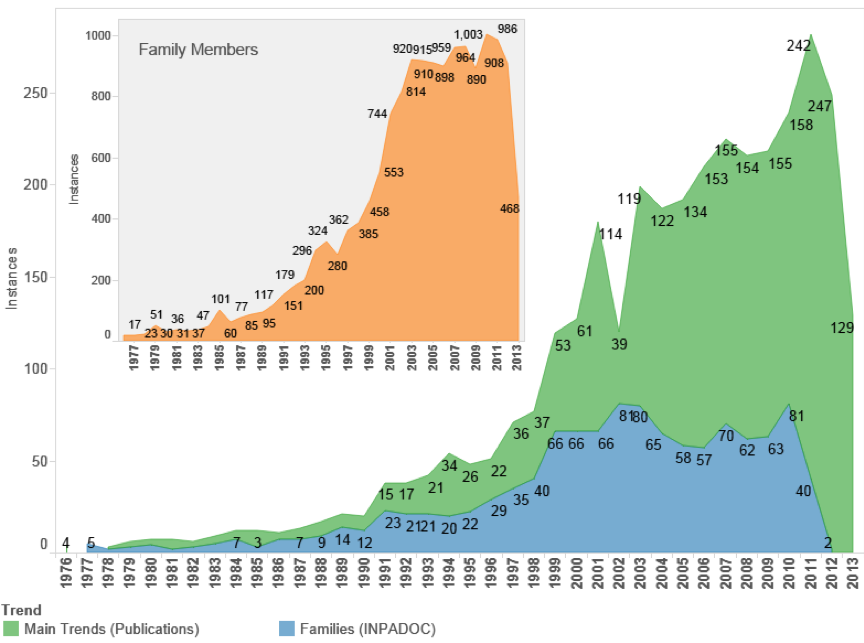
Figure 4.27: International UK Patent Activity Referencing Marine Organisms
We can immediately see that UK patent activity referencing marine species in general is a much more limited sub-set of the overall data with international filing levels in the region of 60-85 filings per year in the period between 2000-2010. As such we would not expect debates on marine genetic resources to have major implications for the UK except where the filings resulted in patent grants that proved to be economically important. Figure 4.28 displays the main technology areas for UK patent activity using International Patent Classification Codes.
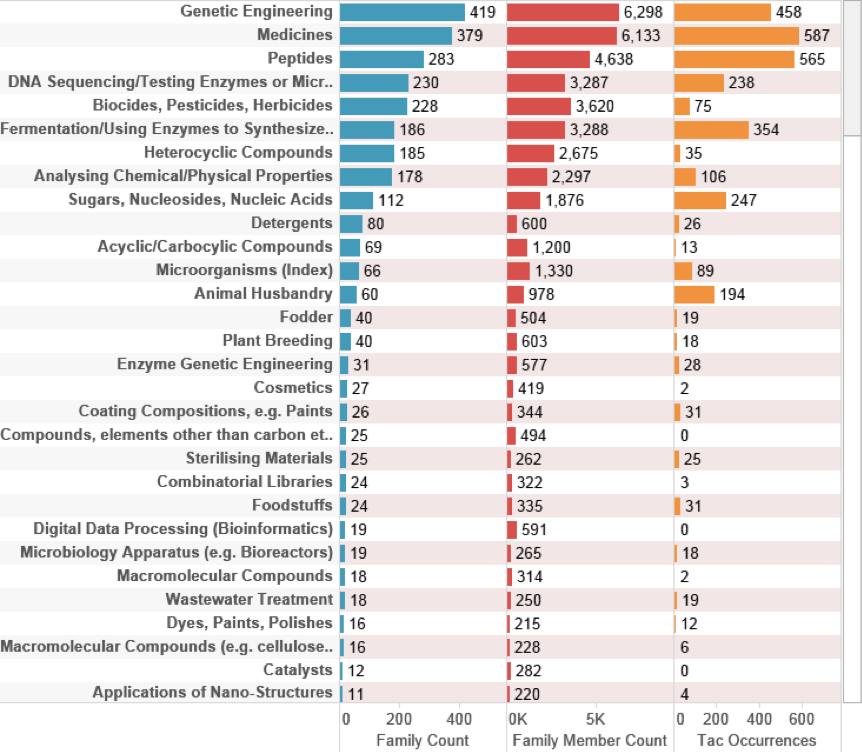
Figure 4.28: UK Technology Areas for all Marine Species:
Figure 4.29 displays the top applicants ranked on family count for references to marine species in UK data. Note that in some cases, such as the Spanish company PharmaMar, the data reflects the presence of a UK individual listed as a co-applicant.
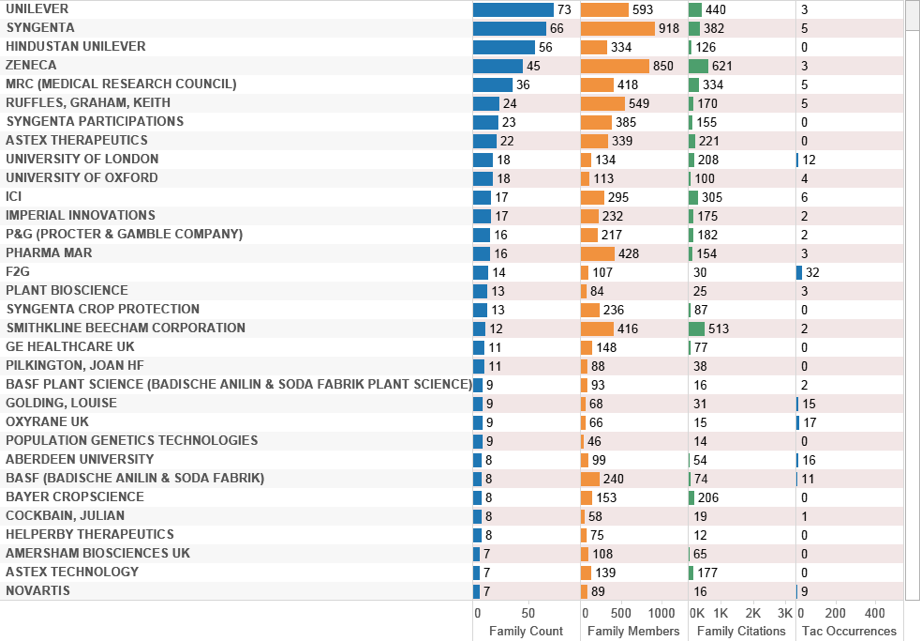
Figure 4.29: UK Patent Activity Referencing Marine Species (Family Counts)
UK data ranked on family counts by assignee reveals a relatively limited set of filings referencing a marine species. Figure 4.30 provides a breakout of the data by species for the top UK applicant, Unilever.
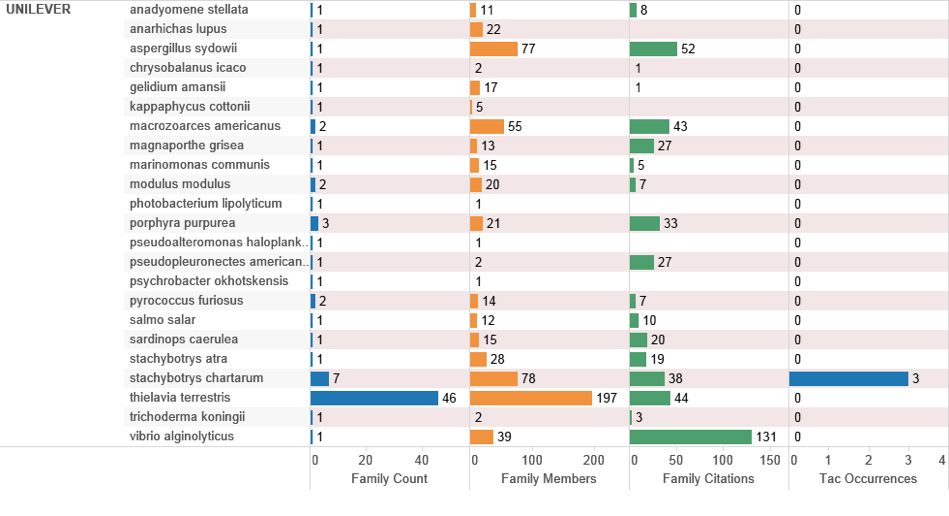
Figure 4.30: UK Top Applicants Referencing Marine Species
Figure 4.31 displays the same data but ranked on references in the Title, Abstract or Claims.
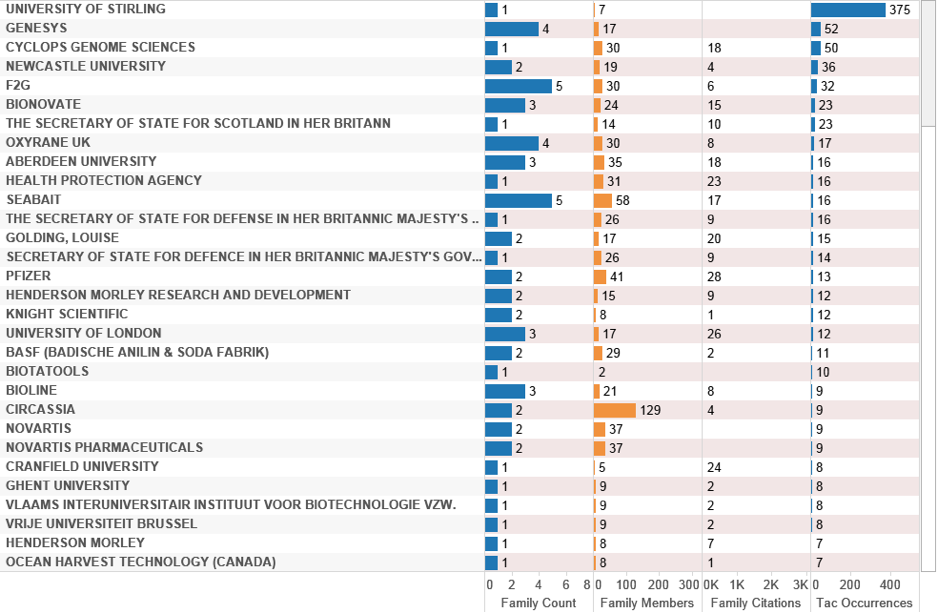
Figure 4.31: UK Activity with Marine Species in the Title, Abstract or Claims
In this case, the University of Stirling emerges top in the rankings for the filing noted above on vaccines. This is followed by Genesys (a management consultancy company) that references Thermodesulfatator indicus and Thermotoga maritima along with the Cambridge based biotechnology company Cyclops Genome Sciences focusing on Modified RNA Technology. The latter references Pyrodictium occultum, Thermococcus litoralis, Thermoplasma acidophilum, Thermisipho africanus and Thermotoga maritima in a patent family with 30 members. Family member US20050272679A1 focuses on an oligonucleotide consisting of mRNA, rRNA or viral RNA with modified ribose rings for use as a probe in gene expression analysis. References to marine species appear in Claim 9 where the applicant claims:
“The nucleic acid polymerase comprises a DNA-dependent DNA polymerase; or wherein the DNA-dependent DNA polymerase is selected from the group consisting of DNA polymerase I; DNA polymerase I-Klenow fragment; T4 DNA polymerase; T7 DNA polymerase; Taq DNA polymerase, Tli DNA polymerase, Pfu DNA polymerase; Vent® DNA polymerase; DeepVent® DNA polymerase; Bst DNA polymerase; Tth; Pfu Turbo®, Pfu(exo-), Pwo, Pyra®, Tfu, KlenTaq, Taq2000®, AmpliTaq; Stoffel fragment, Sequenase®, Tma, Vent® (exo-), DeepVent® (exo-), and a DNA polymerase purified from an organism selected from the group consisting of: Thermosipho africanus, Thermotoga maritima, Desulfurococcus mobilis, Methanobacterium thermoautotrophicum, Methanothermus fervidus, Pyrococcus furious, Pyrodictium occultum, Sulfolobus acidocaldarius, S. solfataricus, Thermococcus litoralis and Thermoplasma acidophilum…”
As this example suggests, in perhaps the majority of cases UK patent activity will reference species and genetic material that are well known in the art, or modifications to existing structures, rather than applying for protection arising from novel organisms directly collected from marine environments.
We anticipate that with few exceptions this will constitute the dominant pattern in UK activity referencing or involving marine species. We now turn to analysis of UK activity involving species occurring outside the Exclusive Economic Zone (EEZ).
UK Patent Activity and the Deep-Sea
Figure 4.32 displays the results of breaking out the UK marine data by species (inset) and counts of family members. This data strongly suggests that UK activity mainly refers to species from inside the EEZ with 464 species occurring inside the EEZ and 272 species referenced from outside the EEZ (see Species Count). Once again we would note that data on species outside the EEZ by depth is affected by a lack of accurate depth records for bacteria and archaea that are grouped in the epipelagic zone.
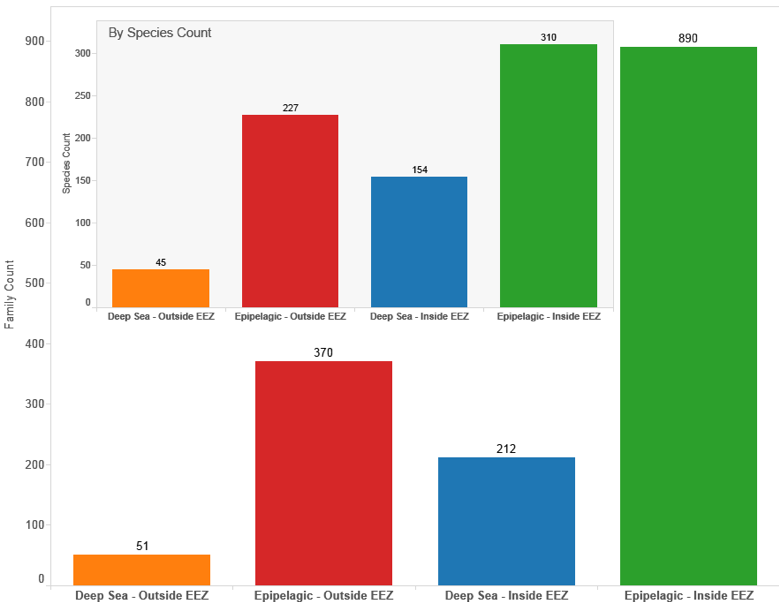
Figure 4.32: UK Patent Activity for Marine Species by Geographic Zone and Depth
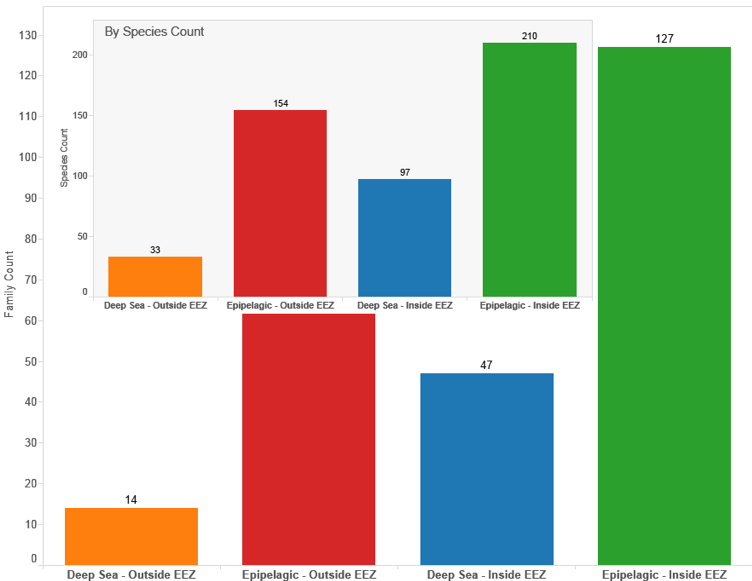
Figure 4.33: Displays the Same Data for Titles, Abstracts and Claims
Figure 4.34 demonstrates that UK activity referencing deep-sea species in the Title, Abstracts or Claims is limited with the total number of species from the deep-sea in patent data involved in an invention resting somewhere between the total number of species in the documents and species in the Title, Abstract or Claims.
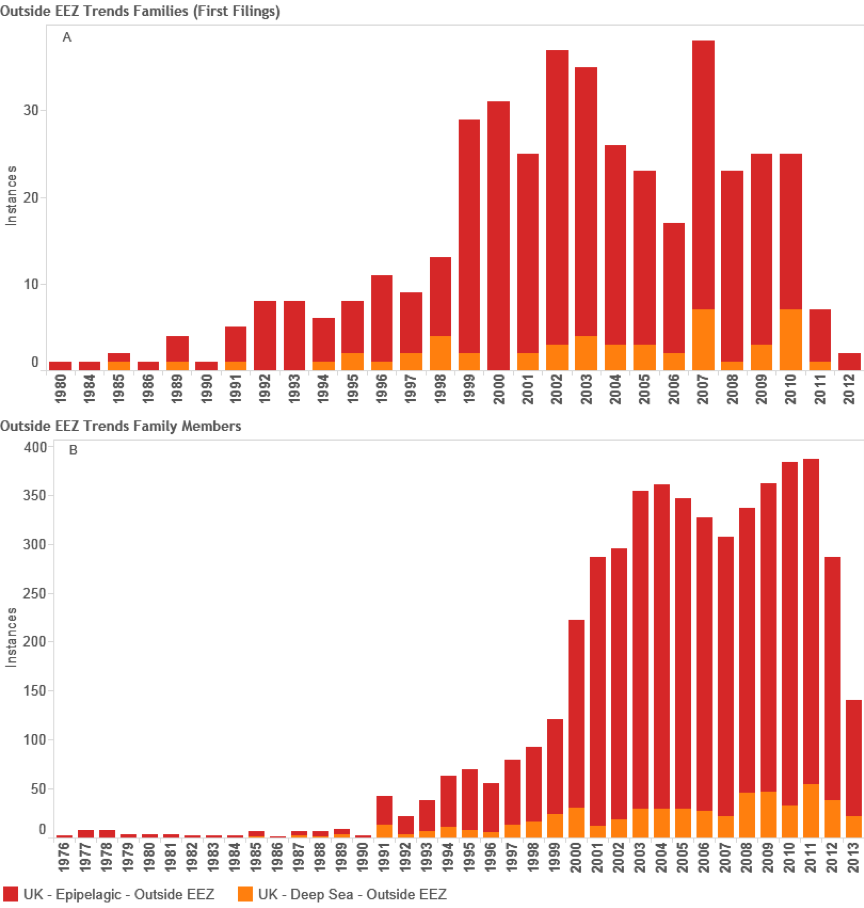
Figure 4.34: Trends in International UK Activity Referencing Deep-Sea Species
Figure 4.34 reveals a variable picture for UK international patent activity referencing deep-sea species in first filings and demonstrates that patent activity may go up or down over time. UK filings referencing deep-sea species presently do not exceed 50 filings per year and have been under 40 filings per year in recent years with the exception of a spike in 2007. Trends in family members as a measure of demand for protection for these inventions in multiple countries display a generally increasing trend with a marked drop in demand between 2007 and 2009.
Technology Areas
Figure 4.35 displays UK patent activity referencing deep-sea species using International Patent Classification Codes.
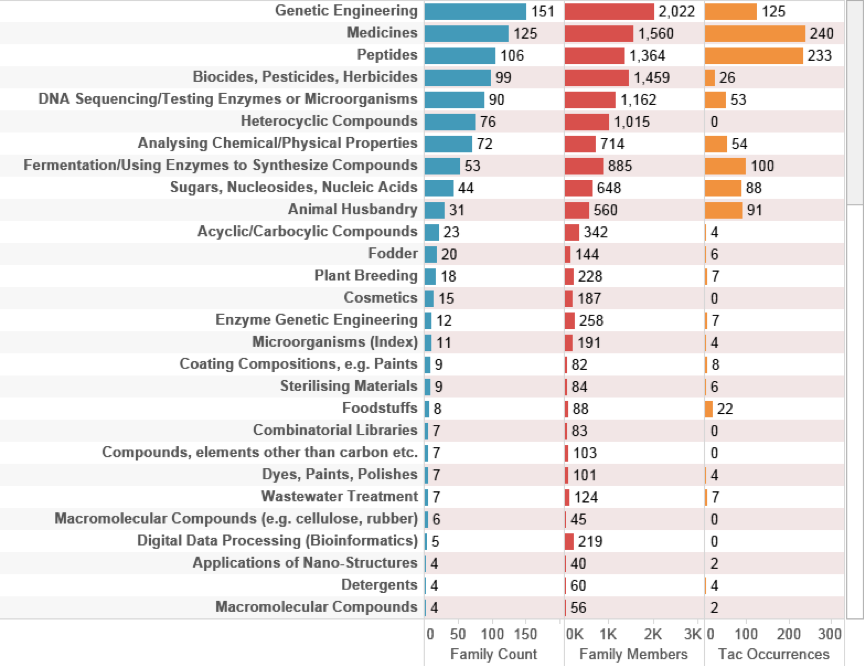
Figure 4.35: UK Activity Referencing Species Outside the EEZ
This data demonstrates that UK activity is mainly focused on genetic engineering and pharmaceuticals with emerging developments such as bioreactors and applications of nano-structures (nanotechnology) beginning to move into the picture albeit at low frequencies.
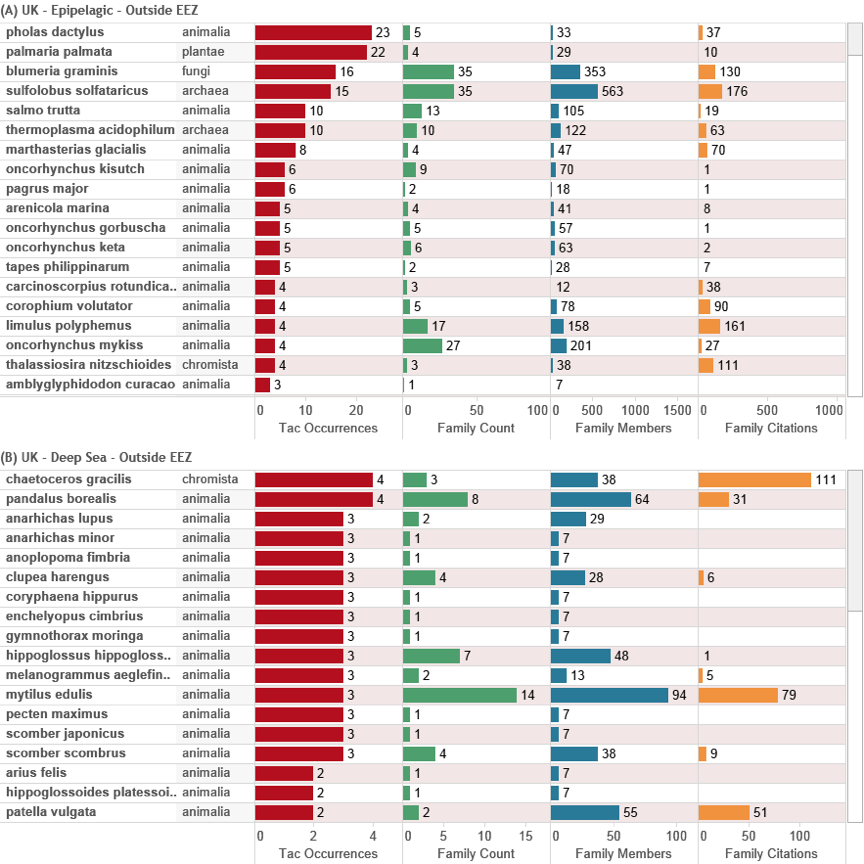
Figure 4.36: Top Species from GB Innovation (Outside the EEZ)
Figure 4.36 focuses on the top species appearing in UK international activity for the epipelagic (A) and deep-sea -200 m zones (B). The data is ranked on the number of occurrences of a species in the Title, Abstract or Claims to reveal the intensity of UK activity around particular species. Note that some of the bacteria and archaea in the epipelagic zone may belong in the deep-sea zone. Also note that some species may also be of terrestrial origin (e.g. Sulfolobus solfataricus). Figure 4.36 also demonstrates that individual species generally have relatively low patent family member counts signifying relatively weak international demand for protection in multiple countries and, with few exceptions, these have generally attracted less than 100 citations.
UK Patent Applicants
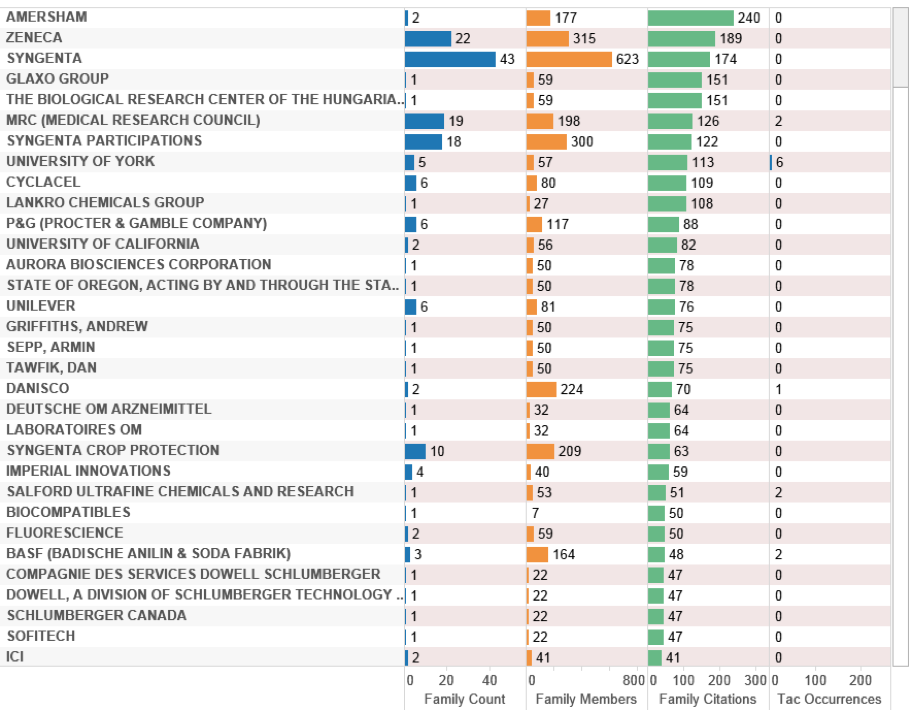
Figure 4.37: UK Patent Activity (Outside the EEZ)
Figure 4.37 displays the top UK applicants ranked on citation scores to expose the most important patent documents in the UK portfolio in terms of their impacts on other patent applicants (as opposed to family size as a measure of an applicant’s willingness to pay). The top-ranking patent families for Amersham involve references to Renilla reniformis as a source of Green Fluorescent Protein for use as a marker in claimed inventions relating to a human myosin like polypeptide (US6686188B2) and isoforms of human pregnancy associated protein-E (US6656700B2). This forms part of a wider and common pattern involving enzymes or compounds from marine organisms that are now produced through fermentation rather than direct collection.
We can move closer to UK activity directly involving marine organisms from outside the EEZ by examining patent documents where an organism appears in the Title, Abstract or Claims ranked by citation scores. Figure 4.38 displays this data for the top ranking UK organisation by this measure, the University of York.
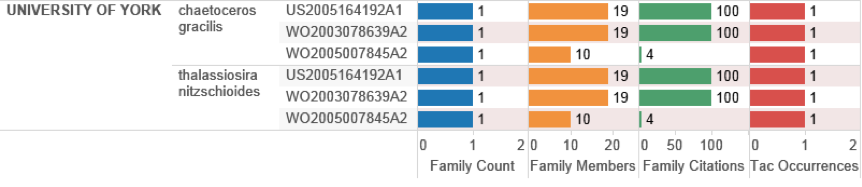
Figure 4.38: UK Patent Activity with Species in the Title, Abstract or Claims Ranked on Citation Scores.
Cheatoceros gracilis is a marine diatom and is referenced in the claims of three patent applications by the University of York that focus on transgenic plants that express enzymes involved in fatty acid biosynthesis. Specifically, these applications focus on the use of nucleic acid sequences from a variety of organisms for the expression of docosahexaenoic acid (DHA), an Omega 3 fatty acid, or its variants in transgenic plants. In marine organisms DHA is normally associated with krill or fish oils and has generated a significant market for Omega 3 products. In this case the applicants claim that the expression of DHA in plants would overcome the problem of increasing levels of pollution in fish. However, it is important to note that the applicants claim that the nucleic acid could be derived from a number of algal species in the following claims:
“3. The isolated nucleic acid molecule according to claim 1, wherein the isolated nucleic acid molecule is isolated from an algal species. 4. The isolated nucleic acid molecule according to claim 3 wherein said algal species is Amphidinium carterae, Amphiphora hyalina, Amphiphora sp., Chaetoceros gracilis, Coscinodiscus sp., Crypthecodinium coohnii, Cryptomonas sp., Cylindrotheca fusiformis, Haslea ostrearia, Isochrysis galbana, Nannochloropsis oculata, Navicula sp., Nitzschia closterium, Pavlova lutheri, Phaeodactylum tricornutum, Prorocentrum minimum, Rhizosolenia setigera, Skeletonema costatum, Skeletonema sp., Tetraselmis tetrathele, Thalassiosira nitzschioides, Thalassiosira heterophorma, Thalassiosira pseudonana, or Thalassiosira stellaris.” (US20050164192A1)
There is no evidence that the organism was collected by the applicants from a marine environment and the main focus of the invention appears to have been the cultivation of the marine haptophyte Pavlova lutheri, first described in 1953, in artificial seawater followed by cDNA library construction, sequencing and sequence analysis against existing libraries for identification of the relevant genes [91]. We therefore assume that the inclusion of the organism and other organisms in the claims reflects the identification of the target sequence in the invention in these organisms. As such, the applicants are covering the possibility that other applicants may seek to reproduce the invention using the same sequence in other organisms. Family members arising from the claimed invention include European Patent and US patent grants (e.g. EP1487985B1, EP2302060B1, US7705202B2).
In closing this discussion of UK patent activity this example usefully highlights that in what may prove to be many if not the majority of cases, patent applicants will not engage in direct collection of organisms but will rely on access to existing collections and or sequence databases. Furthermore, as in this case, an applicant may make claims to a DNA sequence from an organism on the basis that sequence analysis reveals that the sequence occurs in a particular organism to close off possible competition by others. In terms of debates on access to genetic resources and benefit-sharing this highlights the increasing importance of access to data about organisms in the form of DNA databases. At the same time it also highlights that applicants may make claims over the particular genetic components of organisms for the purpose of defending an invention from competitors seeking to work around the invention or because subsequent identification of polymorphisms associated with a particular gene or set of genes may prove advantageous for the realisation of the invention at a later data.
4.0.10 Conclusions
The aim of this chapter has been to clarify the presence of marine genetic organisms and deep-sea marine organisms in international patent data as a contribution to understanding trends in commercial research and development involving marine genetic resources. In particular, and building on growing attention to evidence-based quantitative analysis of patent data, we have sought to address the problem of scale in identifying marine organisms in millions of patent documents and progressively refining the analysis to focus on organisms known to occur in Areas Beyond National Jurisdiction.
In the course of this analysis a number of key issues have emerged that are directly relevant to the potential negotiation of an implementing agreement, or agreements, within the framework of the United Nations Convention on the Law of the Sea.
Marine organisms that appear in patents may also be found in terrestrial and terrestrial aquatic environments. It is presently very difficult to differentiate the source or origin of marine genetic material in patent documents (see chapter 5);
Marine organisms may be the targets of an invention or the source of a claimed invention. It is presently difficult to differentiate these types of references using computational methods and qualitative assessment is needed in future work;
Marine organisms in general are increasingly referenced in patent documents suggesting increasing interest in these species. However there is a need for care in interpretation of quantitative trends because:
Patent activity may be intensifying around a cluster of well known species;
Applicants may name species as a defensive measure to prevent competitors from working around a patent;
Patent claims may be constructed on the family or genus level that will not be adequately captured in the present research.
Our ability to identify marine species in patent data that originate from Areas Beyond National Jurisdiction (ABNJ) is presently limited. Further efforts to accurately geocode sample records should be encouraged. In particular, our ability to section data by pelagic zone is severely constrained by the absence of sample depth data in taxonomic databases for bacteria and archaea. In our view greater attention should be paid to actively promoting the recording of sample depths as a contribution to longer term monitoring and analysis of patent activity involving marine organisms and organisms from the deep-sea.
There is a need for clarity and caution in the interpretation of patent research using different methodological approaches. Trends in research and development involving marine species should be conducted using standard counts of patent families and related patent counts such as family members to measure global demand. At the same time, methodological development using a variety of approaches, including harmonisation, should be strongly encouraged to improve the accuracy of patent statistics to inform decision making over time.
On the balance of the available evidence, and taking into account the constraints identified above, we conclude that patent activity for genetic resources from the deep-sea is an emerging area of interest among patent applicants. However, significant uncertainty remains on the extent to which organisms known to occur in the deep-sea are actually collected from Areas Beyond National Jurisdiction.
In the case of the UK we find limited evidence for the presence of genetic material from marine organisms from Areas Beyond National Jurisdiction in UK patent activity. While UK applicants may be affected by any implementing agreement that may be agreed within the framework of UNCLOS involving access and benefit-sharing, the available evidence suggests that the impacts of such an agreement are likely to be limited. Proposals on conditions for access to samples or genetic data would merit careful consideration and further analysis. We now turn to analysis of the origins and sources of marine genetic material in patent data.
http://www.interridge.org/IRvents Accessed 30/07/2014↩
For the European Patent Office counts of patent grants may potentially be affected by situations where the first publication is through the Patent Cooperation Treaty and results in patent grants in Contracting States but does not involve a regional patent grant publication by the EPO. This issue merits further clarification in consultation with the EPO in future work.↩
Members of the genus Thermococcus are important deep-sea organisms. However, with two exceptions depth data is absent from GBIF and OBIS.↩
The total count of first filings is lower than the stacked charts dividing the data by depth zone. The reason for this is that species from different depth zones may appear in the same document.↩
Arnaud-Haond et al., (2011) list 677 international claims in their article. The raw data provided in the supporting information contains 594 actual documents. Because of the raw application number format used by WIPO these documents could not be readily retrieved in PATSTAT without extensive work on harmonisation. We therefore used Thomson Innovation.↩
DK14486D0 can be accessed as publication number DK19861448A in Thomson Innovation.↩