User Interface (UI): Designing the front end

Sources: Wickham (2021, Ch. 2)

1 Basics

  • Shiny encourages separation of code that generates UI (front end) from code that drives app’s behaviour (server/back end).
  • Here focus on front end & tour of Shiny inputs and outputs
    • won’t stitch inputs and outputs together yet
  • primary focus on native Shiny components (contained in Shiny package) but vibrant community (see awesome shiny extenstions)

2 UI: Layout

  • Any Shiny app consists of ui, server and shinyApp(ui=ui, server = server)
    • ui <- function(): function is used to create UI
      • UI then displays different inputs and outputs
    • Shiny provides different functions that can be used to create basic layouts
  • fluidPage() creates the classic fluid page layout
  • dashboardPage() create a dashboard layout (Guerry dashboard uses that!)

2.1 fluidPage

  • fluidPage(): Creates most basic layout
    • display that automatically adjusts to user’s browser dimensions (smartphone!)
    • layout consists of rows containing columns
      • rows making sure elements appear on the same line
      • columns define how much horizontal space elements should occupy (within a 12-unit wide grid)
  • Below a UI with title panel and sidebar panel
    • titlePanel() and sidebarLayout() create a basic Shiny app/layout with a sidebar
    • sidebarLayout() takes two functions
      • sidebarPanel(): Includes content displayed in the sidebar
      • mainPanel(): Includes content displayed in the main panel
    • fluidRow() and column(): Divide ui into rows/columns
  • Try the code below by pasting it into your console and running it. It will only create a user interface.
Code: Creating a simple UI
ui <- fluidPage(
  titlePanel("This is the title panel"),
  
  sidebarLayout(
    sidebarPanel( "Title: Sidebar panel"),
    
    mainPanel("Title: Main panel",
              fluidRow(
                column(width = 4,"Column 1: Description here"),
                column(width = 4, "Column 2: Model summary")
                ,
                column(width = 3, 
                       offset = 1, 
                       "Column 3: Model visualization")
              )
  )))

server <- function(input, output){}

shinyApp(ui=ui, server = server)
  • Change sidebarLayout(position = "right",...) to position sidebar on the right
  • navbarPage(): Create a multi-page user-interface that includes a navigation bar
  • Sometimes adding borders helps..
Code: Adding borders for better understanding of UI
ui <- fluidPage(
  titlePanel("This is the title panel"),
  
  sidebarLayout(
    sidebarPanel( "Title: Sidebar panel"),
    
    mainPanel("Title: Main panel",
              fluidRow(
                column(style='border: 1px solid black',
                       width = 4,"
                       Column 1: Description here"),
                column(style='border: 1px solid black',
                       width = 4, "Column 2: Model summary")
                ,
                column(style='border: 1px solid black',
                       width = 3, 
                       offset = 1, 
                       "Column 3: Model visualization")
              )
    )))

server <- function(input, output){}

shinyApp(ui=ui, server = server)

2.1.1 Creating panels and tabs

  • tabsetPanel() + tabPanel()
    • Allows for using sidebar layout but dividing main panel into tabs
    • Users can switch between tabs that can be used to display various outputs simultanously
ui <- fluidPage(
  titlePanel("This is the title panel"),
  
  sidebarLayout(
    sidebarPanel( "This is the sidebar panel"),
    
    mainPanel(
      tabsetPanel(type = "tabs",
                  tabPanel("3d Frequency Plot", 
                           "Tab 1: plot here"),
                  tabPanel("Histogram", 
                           "Tab 2: another plot here"),
                  tabPanel("Model Summary", 
                           h4("Tab 3: estimation results here")),
                  tabPanel("Data Summary", 
                           h4("Tab 4: Variable summaries"))
      ))))
  
  server <- function(input, output){}
  
  shinyApp(ui=ui, server = server)

2.2 dashboardPage

  • dashboardPage(): creates a dashboard interface (underlying Guerry app!)
    • function contained in packages shinydashboard and bs4Dash (use bs4Dash1!)
    • dashboardHeader(): creates a dashboard header
    • dashboardSidebar(): Creates dashboard sidebar
      • sidebar typically contains a sidebarMenu, although it may also contain a sidebarSearchForm, or other Shiny inputs.
    • dashboardBody(): creates main body typically containing boxes or tabItems
library(bs4Dash)
# UI ----
ui <- dashboardPage(title = "The Guerry Dashboard",

  ### Header ----
  header = dashboardHeader(),

  ### Sidebar ----
  sidebar = dashboardSidebar(),

  ### Body ----
  body = dashboardBody()
)

# Server ----
server <- function(input, output, session) {}

shinyApp(ui, server)

2.2.1 Creating items and tabs

  • ?sidebarMenu(): create sidebarMenu within dashboardSidebar
    • menuItem(tabName = "...", text = "...", icon = icon("table")): Creates one item in sidebarMenu
  • tabItems(): creates container for tab items
    • tabItem(tabName = "insp", ...): creates tab to put inside a tab items container
    • can be combined with fluidRow() and column()
    • Connection through name tabName argument
library(bs4Dash)
# UI ----
ui <- dashboardPage(title = "The Guerry Dashboard",

  ### Header ----
  header = dashboardHeader(
    title = "Title here"
  ),

  ### Sidebar ----
  sidebar = dashboardSidebar(
    sidebarMenu(
      menuItem(tabName = "tab_table", 
               text = "Table data", 
               icon = icon("table"))
    )
  ),
  ### Body ----
  body = dashboardBody(
    tabItems( # start tabItems

      tabItem(
        tabName = "tab_table",
        hr(), # add separation line
        "Here we will put a table"
      )
      
    ) # end tabItems
  )
) # End UI


# Server ----
server <- function(input, output, session) {}

shinyApp(ui, server)

2.3 Images

  • img() function places an image
    • img(src = "http://.../img-2.jpg", height = 35, width = 35): Load image from website or folder
  • Store image(s) locally
    • www subfolder stores all sorts of additional files(images, data etc.)
    • If working directory = app directory create with: dir.create("www")
    • IMAGES PLACED UNDER www SHOULD BE REFERENCES WITHOUT THE www FOLDER NAME
      • e.g., img(src = "guerry.jpg", width = "100%")
Code: Adding images
ui <- dashboardPage(
  title = "The Guerry Dashboard",
  
  ### Header ----
  header = dashboardHeader(
    span(style = "display: inline-block; width: 100%;"),
    a(
      class = "logo",
      href = "https://gesis.org/",
      img(src = "gesis-logo.png", style = "height: 1.8em;")
    ),
    title = tagList(
      img(src = "workshop-logo.png", width = 35, height = 35),
      span("The Guerry Dashboard", class = "brand-text")
    )
  ),
  
  ### Sidebar ----
  sidebar = dashboardSidebar(
    sidebarMenu(
      menuItem(tabName = "tab_image",
               text = "Image section", 
               icon = icon("image"))
    )
  ),
  ### Body ----
  body = dashboardBody(
    tabItems(
      tabItem("tab_image",
              img(src = "https://journals.openedition.org/belgeo/docannexe/image/11893/img-1.jpg", width = 358, height = 476)
      )
    ) # end tabItems
  )
) # End UI

# Server ----

server <- function(input, output, session) {}

shinyApp(ui, server)
1
dashboardPage(): Main function to create a dashboard page layout in Shiny.
2
dashboardHeader(): Function to set up the header part of the dashboard.
3
span(): Function to create an HTML span element with a style attribute to control its display.
4
a(): Function to create a hyperlink element (“a” HTML tag) with a specified class, href attribute (URL), and nested img (image) element.
5
tagList(): Function to create an HTML list from arguments. Here it’s used to group the title components together.
6
dashboardSidebar(): Function to create the sidebar of the dashboard.
7
menuItem(): Function to add an item to the sidebar menu.
8
dashboardBody(): Function to create the body of the dashboard.
9
tabItems(): Function to create tabbed content sections. The arguments are pairs of tab names and tab content.
10
tabItem(): Function to create a single tab item. Its arguments are a tab name and its content.
11
server: Placeholder for server logic. In this case, it’s empty.
12
shinyApp(ui, server): Main function to create a Shiny app. It takes as arguments the UI and server definitions.

2.3.1 Add several images

  • Below some exemplary code to add several images, i.e., simply repeat the img() function
Code: Adding images
ui <- dashboardPage(
  title = "The Guerry Dashboard",
  
  ### Header ----
  header = dashboardHeader(
    span(style = "display: inline-block; width: 100%;"),
    a(
      class = "logo",
      href = "https://gesis.org/",
      img(src = "gesis-logo.png", style = "height: 1.8em;")
    ),
    title = tagList(
      img(src = "workshop-logo.png", width = 35, height = 35),
      span("The Guerry Dashboard", class = "brand-text")
    )
  ),
  
  ### Sidebar ----
  sidebar = dashboardSidebar(
    sidebarMenu(
      menuItem(tabName = "tab_image",
               text = "Image section", 
               icon = icon("image"))
    )
  ),
  ### Body ----
  body = dashboardBody(
    tabItems( 
      tabItem("tab_image",
              img(src = "https://journals.openedition.org/belgeo/docannexe/image/11893/img-1.jpg", width = 358, height = 476),
                            img(src = "https://journals.openedition.org/belgeo/docannexe/image/11893/img-1.jpg", width = 358, height = 476)
      )
    ) # end tabItems
  )
) # End UI

# Server ----

server <- function(input, output, session) {}

shinyApp(ui, server)

2.4 Exercise: UI layout

  1. Familiarize yourself and use the code in Section 2.3.
  2. Change the website title to “A big name in politics”
  3. Change the sidebar menu title with “The Arni dashboard”.
  4. Replace the image of Guerry with an image Arnold Schwarzenegger from the web, e.g., here.
  • Either store the image in a www subfolder of your app directory or use the URL in your code.
# UI ----
ui <- dashboardPage(
  title = "A big name in politics",
  
  ### Header ----
  header = dashboardHeader(
    span(style = "display: inline-block; width: 100%;"),
    a(
      class = "logo",
      href = "https://gesis.org/",
      img(src = "gesis-logo.png", style = "height: 1.8em;")
    ),
    title = tagList(
      img(src = "workshop-logo.png", width = 35, height = 35),
      span("The Arni Dashboard", class = "brand-text")
    )
  ),
  
  ### Sidebar ----
  sidebar = dashboardSidebar(
    sidebarMenu(
      menuItem(tabName = "tab_image", 
               text = "Image section", 
               icon = icon("image"))
    )
  ),
  ### Body ----
  body = dashboardBody(
    tabItems( # start tabItems
      tabItem("tab_image",
              img(src = "http://assets.schwarzenegger.com/images/img-2.jpg", 
                  width = 729, height = 423)
      )
    ) # end tabItems
  )
) # End UI

# Server ----

server <- function(input, output, session) {}

shinyApp(ui, server)
  1. Check the directory you are in with getwd().
  2. Make sure the app.R file you are using is saved in this directory.
  3. Use dir.create("www") or the buttons in Rstudio to create the www folder.
  4. Store the image from the link in this www folder.
  5. Add the image name simply in the code img(src = "img-2.jpg", width = 729, height = 423) (see below).
  • IMAGES PLACED UNDER www SHOULD BE REFERENCES WITHOUT THE www FOLDER NAME
  1. Run the app.
# UI ----
ui <- dashboardPage(
  title = "A big name in politics",
  
  ### Header ----
  header = dashboardHeader(
    span(style = "display: inline-block; width: 100%;"),
    a(
      class = "logo",
      href = "https://gesis.org/",
      img(src = "gesis-logo.png", style = "height: 1.8em;")
    ),
    title = tagList(
      img(src = "workshop-logo.png", width = 35, height = 35),
      span("The Arni Dashboard", class = "brand-text")
    )
  ),
  
  ### Sidebar ----
  sidebar = dashboardSidebar(
    sidebarMenu(
      menuItem(tabName = "tab_image", 
               text = "Image section", 
               icon = icon("image"))
    )
  ),
  ### Body ----
  body = dashboardBody(
    tabItems( # start tabItems
      tabItem("tab_image",
              img(src = "img-2.jpg", 
                  width = 729, height = 423)
      )
    ) # end tabItems
  )
) # End UI

# Server ----

server <- function(input, output, session) {}

shinyApp(ui, server)

3 UI: Inputs

3.1 UI Inputs: common structure

  • inputId argument:
    • inputId connects front end with back end, e.g., if UI has input with ID name, the server function will access it with input$name
    • name` = simple string (only letters, numbers, and underscores) and unique
    • Inputs are stored in list called input$...
  • label argument: Used to create human-readable label
  • value argument: usually let’s you set default value
  • Remaining 4-x arguments are unique to the particular input
  • Recommendation: Supply inputId and label arguments by position, and all other arguments by name
    • Q: How would we read the following?
      • sliderInput("min", "Limit (minimum)", value = 50, min = 0, max = 100)

3.2 UI Inputs: Logic

  • Widget = Web element the user can interact with (Shiny widget gallery)
    • Users can send messages to the SERVER/Computer (e.g. “I want to choose this variable”)
  • Underlying logic is the same for all widgets
    • User uses widget to give input
    • Input is inserted into the functions in the SERVER
      • server <- function(input, output) {}
  • shiny package contains many widgets
    • Additional ones for instance in shinyWidgets package (e.g., pickerInput())

3.3 UI Inputs: Examples

  • You can run the code for the Shiny app below in R.
library(shinyWidgets) # Install!

animals <- c("dog", "cat", "mouse") # Predefining some categories

ui <- fluidPage(
  
  # Free text
  textInput("name", "What's your name?"),
  passwordInput("password", "What's your password?"),
  textAreaInput("story", "Tell me about yourself", rows = 3),
  
  # Numeric inputs
  numericInput("num", "Number one", value = 0, min = 0, max = 100),
  sliderInput("num2", "Number two", value = 50, min = 0, max = 100),
  sliderInput("rng", "Range", value = c(10, 20), min = 0, max = 100),
  
  # Dates
  dateInput("dob", "When were you born?"),
  dateRangeInput("holiday", "When do you want to go on vacation next?"),
  
  # Limited choices
  selectInput("state", "What's your favourite animal?", animals),
  radioButtons("animal", "What's your favourite animal?", animals),
  selectInput( "state", "What's your favourite animal?", animals, multiple = TRUE),
  checkboxGroupInput("animal2", "What animals do you like?", animals),
  pickerInput(
    inputId = "animal3",
    label = "What animals do you like?",
    choices = animals
  ),
  
  # Single checkbox
  checkboxInput("cleanup", "Clean up?", value = TRUE),
  checkboxInput("shutdown", "Shutdown?"),
  
  # File uploads
  fileInput("upload", NULL),
  
  # Action buttons
  actionButton("click", "Click me!"),
  actionButton("drink", "Drink me!", icon = icon("cocktail"))
)

server <- function(input, output, session) {}

shinyApp(ui, server)

3.4 Exercise(s)

  1. When space is at a premium, it’s useful to label text boxes using a placeholder that appears inside the text entry area. How do you call textInput() to generate the UI in Figure 1 below (see ?textInput)?

Figure 1: Text input (Source: Wickham 2021)
textInput("text", "", placeholder = "Your name")
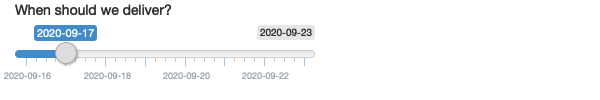
  1. Carefully read the documentation for sliderInput() to figure out how to create a date slider, as shown below in Figure 2.

Figure 2: Date slider (Source: Wickham 2021)
sliderInput(
  "dates",
  "When should we deliver?",
  min = as.Date("2019-08-09"),
  max = as.Date("2019-08-16"),
  value = as.Date("2019-08-10")
)
  1. Create a slider input to select values between 0 and 100 where the interval between each select able value on the slider is 5. Then, add animation to the input widget so when the user presses play the input widget scrolls through the range automatically.
  sliderInput("number", "Select a number:",
              min = 0, max = 100, value = 0, 
              step = 5, animate = TRUE)
  1. If you have a moderately long list in a selectInput(), it’s useful to create sub-headings that break the list up into pieces. Read the documentation to figure out how. (Hint: the underlying HTML is called <optgroup>.)
selectInput(
  "breed",
  "Select your favorite animal breed:",
  choices =
    list(`dogs` = list('German Shepherd', 'Bulldog', 
                       'Labrador Retriever'),
         `cats` = list('Persian cat', 'Bengal cat', 
                       'Siamese Cat'))
)
ui <- fluidPage(
  textInput("text", "", placeholder = "Your name"),
  
  sliderInput(
  "dates",
  "When should we deliver?",
  min = as.Date("2019-08-09"),
  max = as.Date("2019-08-16"),
  value = as.Date("2019-08-10")
  ),
 
    sliderInput("number", "Select a number:",
              min = 0, max = 100, value = 0, 
              step = 5, animate = TRUE),
  
  selectInput(
  "breed",
  "Select your favorite animal breed:",
  choices =
    list(`dogs` = list('German Shepherd', 'Bulldog', 
                       'Labrador Retriever'),
         `cats` = list('Persian cat', 'Bengal cat', 
                       'Siamese Cat'))
)
  
)
server <- function(input, output, session) {
  
  
}
shinyApp(ui, server)
#rm(list=ls())
library(shiny)

ui <- basicPage(
  textInput("text", "", placeholder = "Your name"),
  
  sliderInput(
    "dates",
    "When should we deliver?",
    min = as.Date("2019-08-09"),
    max = as.Date("2019-08-16"),
    value = as.Date("2019-08-10")
  ),
  
  sliderInput("number", "Select a number:",
              min = 0, max = 100, value = 0, 
              step = 5, animate = TRUE),
  
  selectInput(
    "breed",
    "Select your favorite animal breed:",
    choices =
      list(`dogs` = list('German Shepherd', 'Bulldog', 
                         'Labrador Retriever'),
           `cats` = list('Persian cat', 'Bengal cat', 
                         'Siamese Cat'))),
  tableOutput('show_inputs')
)
server <- shinyServer(function(input, output, session){
  
  AllInputs <- reactive({
    myvalues <- NULL
    for(i in 1:length(names(input))){
      myvalues <- as.data.frame(rbind(myvalues,(cbind(names(input)[i],input[[names(input)[i]]]))))
    }
    names(myvalues) <- c("User Input","Last Value")
    myvalues
  })
  
  output$show_inputs <- renderTable({
    AllInputs()
  })
})
shinyApp(ui = ui, server = server)

4 UI: Outputs

  • Outputs in UI create placeholders that are later filled by the server function
  • Have unique ID as first argument like inputs
    • e.g., textOutput("text") as ID text that is filled by the server
  • If UI specification creates an output with ID text, you’ll access it in the server function with output$text (see below)
  • Each output function on the front end is coupled with a render function in the back end (server)
  • Three main types of output: text, tables, and plots

4.1 Text output

ui <- fluidPage(
  textOutput("text"),
  verbatimTextOutput("code")
)
server <- function(input, output, session) {
  output$text <- renderText({ 
    "Hello friend!" 
  })
  output$code <- renderPrint({ 
    summary(1:10) 
  })
}
shinyApp(ui, server)

4.2 Table output

ui <- fluidPage(
  tableOutput("static"),
  dataTableOutput("dynamic")
)
server <- function(input, output, session) {
  output$static <- renderTable(head(mtcars))
  output$dynamic <- renderDataTable(mtcars, options = list(pageLength = 5))
}
shinyApp(ui, server)

4.3 Plots output

ui <- fluidPage(
  plotOutput("plot", width = "400px")
)
server <- function(input, output, session) {
  output$plot <- renderPlot(plot(1:5), res = 96)
}
shinyApp(ui, server)

4.4 Exercise(s)

  1. Which of textOutput() and verbatimTextOutput() should each of the following render functions be paired with?
  1. renderPrint(summary(mtcars))
  2. renderText("Good morning!")
  3. renderPrint(t.test(1:5, 2:6))
  4. renderText(str(lm(mpg ~ wt, data = mtcars)))
ui <- fluidPage(
  verbatimTextOutput("mtcarsout1"),
  br(), hr(),
  textOutput("mtcarsout2"),
  br(), hr(),
  verbatimTextOutput("mtcarsout3"),
  br(), hr(),
  verbatimTextOutput("mtcarsout4")  
)
server <- function(input, output, session) {
  output$mtcarsout1 <- renderPrint(summary(mtcars))
  output$mtcarsout2 <- renderText("Good morning!")
  output$mtcarsout3 <- renderPrint(t.test(1:5, 2:6))
  output$mtcarsout4 <- renderPrint(str(lm(mpg ~ wt, data = mtcars)))
}
shinyApp(ui, server)
  1. Update the options in the call to renderDataTable() below so that the data is displayed, but all other controls are suppress (i.e. remove the search, ordering, and filtering commands). You’ll need to read ?renderDataTable and review the options at https://datatables.net/reference/option/ or at https://shiny.posit.co/r/gallery/widgets/datatables-options/
ui <- fluidPage(
      dataTableOutput("table")
    )
    server <- function(input, output, session) {
      output$table <- renderDataTable(mtcars, options = list(pageLength = 5))
    }
shinyApp(ui, server)
ui <- fluidPage(
  dataTableOutput("table")
)
server <- function(input, output, session) {
  output$table <- renderDataTable(mtcars, 
                                  options = list(pageLength = 5,
                                                 searching = FALSE,
                                                 paging = FALSE,
                                                 ordering = FALSE,
                                                 filtering = FALSE))
}
shinyApp(ui, server)

4.5 Overview of Output functions

  • Output functions
    • htmlOutput()… creates raw HTML (!)
    • imageOutput()… creates image
    • plotOutput()… creates plot
    • plotlyOutput … creates plotly graph (!)
    • tableOutput()… creates table
    • textOutput()… creates text
    • uiOutput()… creates raw HTML (!)
    • verbatimTextOutput()… creates text
    • dataTableOutput()… creates a data table (interactiv) (!)
    • leafletOutput() … creates leaflet map
  • Our Guerry app uses those marked with (!).

5 HTML tag functions

  • Shiny’s HTML tag functions translate input into html code
    • Try pasting h2("A NEW HOPE", align = "center") into your console
    • h2() function creates <h2></h2> html tag
  • Common HTML tags (e.g., ⁠<div>⁠) can be created by calling for their tag name directly (e.g., div())
  • Less common tags (e.g., ⁠<article>⁠), use the tags list collection (e.g., tags$article()) stored in the tags object
    • Try tags$ in the console
      • .noWS = ... argument to remove whitespace
  • See full reference for HTML tags
  • Here we just do a quick example but in this tutorial you find more information
  • Exercise: Please run the shiny app below and explore the effect of different html tags.
library(bs4Dash)
# UI ----
ui <- dashboardPage(title = "My Shiny App",

  ### Header ----
  header = dashboardHeader(),

  ### Sidebar ----
  sidebar = dashboardSidebar(),

  ### Body ----
  body = dashboardBody(
      h2("A NEW HOPE", align = "center"),
              h5("It is a period of civil war.", align = "center"),
      p("p creates a paragraph of text."),
      tags$p("A new p() command starts a new paragraph. Supply a style attribute to change the format of the entire paragraph.", style = "font-family: 'times'; font-si16pt"),
      strong("strong() makes bold text."),
      em("em() creates italicized (i.e, emphasized) text."),
      tags$hr(style="border-color:black;"),
      tags$br(),
      tags$line(),
      br(),
      code("code displays your text similar to computer code"),
      div("div creates segments of text with a similar style. This division of text is all blue because I passed the argument 'style = color:blue' to div", style = "color:blue"),
      br(),
      p("span does the same thing as div, but it works with",
        span("groups of words", style = "color:blue"),
        "that appear inside a paragraph."))
)


# Server ----

server <- function(input, output, session) {}

shinyApp(ui, server)

6 Guerry app: Introduction tab

  • Below is the code for the Guerry app introduction tab
    • The code has some file dependencies that need to be deleted to run it directly
      • e.g., includeCSS("www/styles.css")
    • Images that are not accessible are simply shown as blank
    • Most UI function simply create html tags, e.g., try h1() or jumbotron()
    • Let’s do this together!
Full R code including Shiny events
library(shiny)
library(htmltools)
library(bs4Dash)
library(fresh)
library(waiter)
library(shinyWidgets)
library(Guerry)
library(sf)
library(tidyr)
library(dplyr)
library(RColorBrewer)
library(viridis)
library(leaflet)
library(plotly)
library(jsonlite)
library(ggplot2)
library(GGally)
library(datawizard)
library(parameters)
library(performance)
library(ggdark)
library(modelsummary)


# 3 UI ----

ui <- dashboardPage(
  title = "The Guerry Dashboard",

  ## 3.1 Header ----
  header = dashboardHeader(
    
    span(style = "display: inline-block; width: 100%;"),
    a(
      class = "logo",
      href = "https://gesis.org/",
      img(src = "gesis-logo.png", style = "height: 1.8em;")
    ),
    title = tagList(
      img(src = "workshop-logo.png", width = 35, height = 35),
      span("The Guerry Dashboard", class = "brand-text")
    ),
    skin = "light",
    sidebarIcon = tags$i(class = "fa fa-bars", style = "color: black;")
  ),
  ## 3.2 Sidebar ----
  sidebar = dashboardSidebar(
    id = "sidebar",
    sidebarMenu(
      id = "sidebarMenu",
      menuItem(tabName = "tab_intro", text = "Introduction", icon = icon("home")),
      menuItem(tabName = "tab_tabulate", text = "Tabulate data", icon = icon("table")),
      menuItem(tabName = "tab_model", text = "Model data", icon = icon("chart-line")),
      menuItem(tabName = "tab_map", text = "Map data", icon = icon("map")),
      flat = TRUE
    ),
    minified = TRUE,
    collapsed = TRUE,
    fixed = FALSE,
    skin = "light"
  ),
  ## 3.3 Body ----
  body = dashboardBody(
    tabItems(
      ### 3.1.1 Tab: Introduction ----
      tabItem(
        tabName = "tab_intro",
        jumbotron(
            title = "The Guerry Dashboard",
            lead = "A Shiny app to explore the classic Guerry dataset.",
            status = "info",
            btnName = NULL
        ),
        fluidRow(
            column(width = 1),
          column(
            width = 6,
            box(
              title = "About",
              status = "primary",
              width = 12,
              blockQuote(HTML("André-Michel Guerry was a French lawyer and
                          amateur statistician. Together with Adolphe
                          Quetelet he may be regarded as the founder of
                          moral statistics which led to the development
                          of criminology, sociology and ultimately,
                          modern social science. <br>— Wikipedia: <a href='https://en.wikipedia.org/wiki/Andr%C3%A9-Michel_Guerry'>André-Michel Guerry</a>"),
                                 color = "primary"),
              p(HTML("Andre-Michel Guerry (1833) was the first to 
              systematically collect and analyze social data 
               on such things as crime, literacy and suicide 
               with the view to determining social laws and the 
               relations among these variables. The Guerry data 
               frame comprises a collection of 'moral variables' 
               (cf. <i><a href='https://en.wikipedia.org/wiki/Moral_statistics'>moral statistics</a></i>) 
               on the 86 departments of France around 1830. 
               A few additional variables have been added 
               from other sources. In total the data frame has 
               86 observations (the departments of France) on 23 variables <i>(Source: <code>?Guerry</code>)</i>. 
               In this app, we aim to explore Guerry’s data
                using spatial exploration and regression modelling.")),
              hr(),
              accordion(
                id = "accord",
                accordionItem(
                    title = "References",
                    status = "primary",
                    solidHeader = FALSE,
                    "The following sources are referenced in this app:",
                    tags$ul(
                        class = "list-style: none",
                        style = "margin-left: -30px;",
                        p("Angeville, A. (1836). Essai sur la Statistique de la Population française Paris: F. Doufour."),
                        p("Guerry, A.-M. (1833). Essai sur la statistique morale de la France Paris: Crochard. English translation: Hugh P. Whitt and Victor W. Reinking, Lewiston, N.Y. : Edwin Mellen Press, 2002."),
                        p("Parent-Duchatelet, A. (1836). De la prostitution dans la ville de Paris, 3rd ed, 1857, p. 32, 36"),
                        p("Palsky, G. (2008). Connections and exchanges in European thematic cartography. The case of 19th century choropleth maps. Belgeo 3-4, 413-426.")
                    )
                ),
                accordionItem(
                    title = "Details",
                    status = "primary",
                    solidHeader = FALSE,
                    p("This app was created as part of a Shiny workshop held in July 2023"),
                    p("Last update: June 2023"),
                    p("Further information about the data can be found",
                        a("here.", href = "https://www.datavis.ca/gallery/guerry/guerrydat.html"))
                )
              )
            )
          ),
          column(
            width = 4,
            box(
              title = "André Michel Guerry",
              status = "primary",
              width = 12,
              tags$img(src = "guerry.jpg", width = "100%"),
              p("Source: Palsky (2008)")
            )
          )
        )
      )
    ) # end tabItems
  ),

  ## 3.4 Footer (bottom)----
  footer = dashboardFooter(
    left = span(
        "This dashboard was created by Jonas Lieth and Paul Bauer. Find the source code",
        a("here.", href = "https://github.com/paulcbauer/shiny_workshop/tree/main/shinyapps/guerry"),
        "It is based on data from the",
        a("Guerry R package.", href = "https://cran.r-project.org/web/packages/Guerry/index.html")
    )
  ),
  ## 3.5 Controlbar (top)----
  controlbar = dashboardControlbar(
    div(class = "p-3", skinSelector()),
    skin = "light"
  )  
)


# 4 Server ----

server <- function(input, output, session) {}

shinyApp(ui, server)

7 Summary

  • UI Layout: fluidPage() and dashBoardPage() most common (we use the latter!)
  • Image can be included using img(src = "...", , width = ..., height = ...) function
  • *Input() functions: Used to generate input UI widgets
    • input values are stored in list input$... with particular name, e.g., input$tab_tabulate_select
  • *Output() functions: Used to display output, dataTableOutput()
    • output is sent from server
  • Both input/output functions have IDs the connect them to the server
  • HTML tags can be used through tags$name() function, e.g., tags$br()
  • Not covered here:
    • Dynamic UI makes it possible to change UI as a function of input values

References

Wickham, Hadley. 2021. Mastering Shiny. " O’Reilly Media, Inc.".

Footnotes

  1. Bootstrap 4 shinydashboard using AdminLTE3: Website↩︎