3.2 The Building Blocks of Graphs: Edges and Nodes
There is a mathematical definition of a graph which is slightly more technical. A graph is a set, usually represented by the capital letter G. From high school math, you may remember that the mathematical definition of a set is simply a collection of entities, some of which may be ordered and some of which may themselves be other sets (a set can have sets as its members). In the case of graphs, the entities inside the collection are nodes and edges A graph is thus a set containing two sets as its members: a set of nodes (usually represented by the capital letter V) and a set of edges (usually represented by the capital letter E). In formal notation:
\[\begin{equation} G = {V, E} \tag{2.1} \end{equation}\]
The set of nodes usually represents actors in the real world social network. Point and line diagrams (such as the ones shown in Figure 1) are used to represent graphs, these in their turn represent the real social network. In these diagrams nodes (representing actors) are drawn as a circle. In social network analysis, actors are often either an individual or an organization, but in wider applications of the network imagery in the physical and biological sciences (usually going under the banner of network science) nodes can represent anything that links up to other similar entities in a larger system. These include power generation stations and homes, servers and computers, animals in an ecosystem, towns, really anything of substance that we can define some kind of relation on, or from which some type of content can be said to be exchanged.
Edges represent the presence of a connection or relationship between two nodes. In social network analysis these are usually some type of social tie. We will define what social ties are, how many types exist, and what their properties are in a later chapter. For now, we can say that in social network analysis, these connections are relationships between nodes, and edges in a graph are meant to represent them. In graph theory, edges are best thought of as a collection of pairs of nodes, where the two members of the pair are the nodes involved in the focal relationship. So if node A is related to node B via some relationship R, then AB is an edge in the relevant graph.
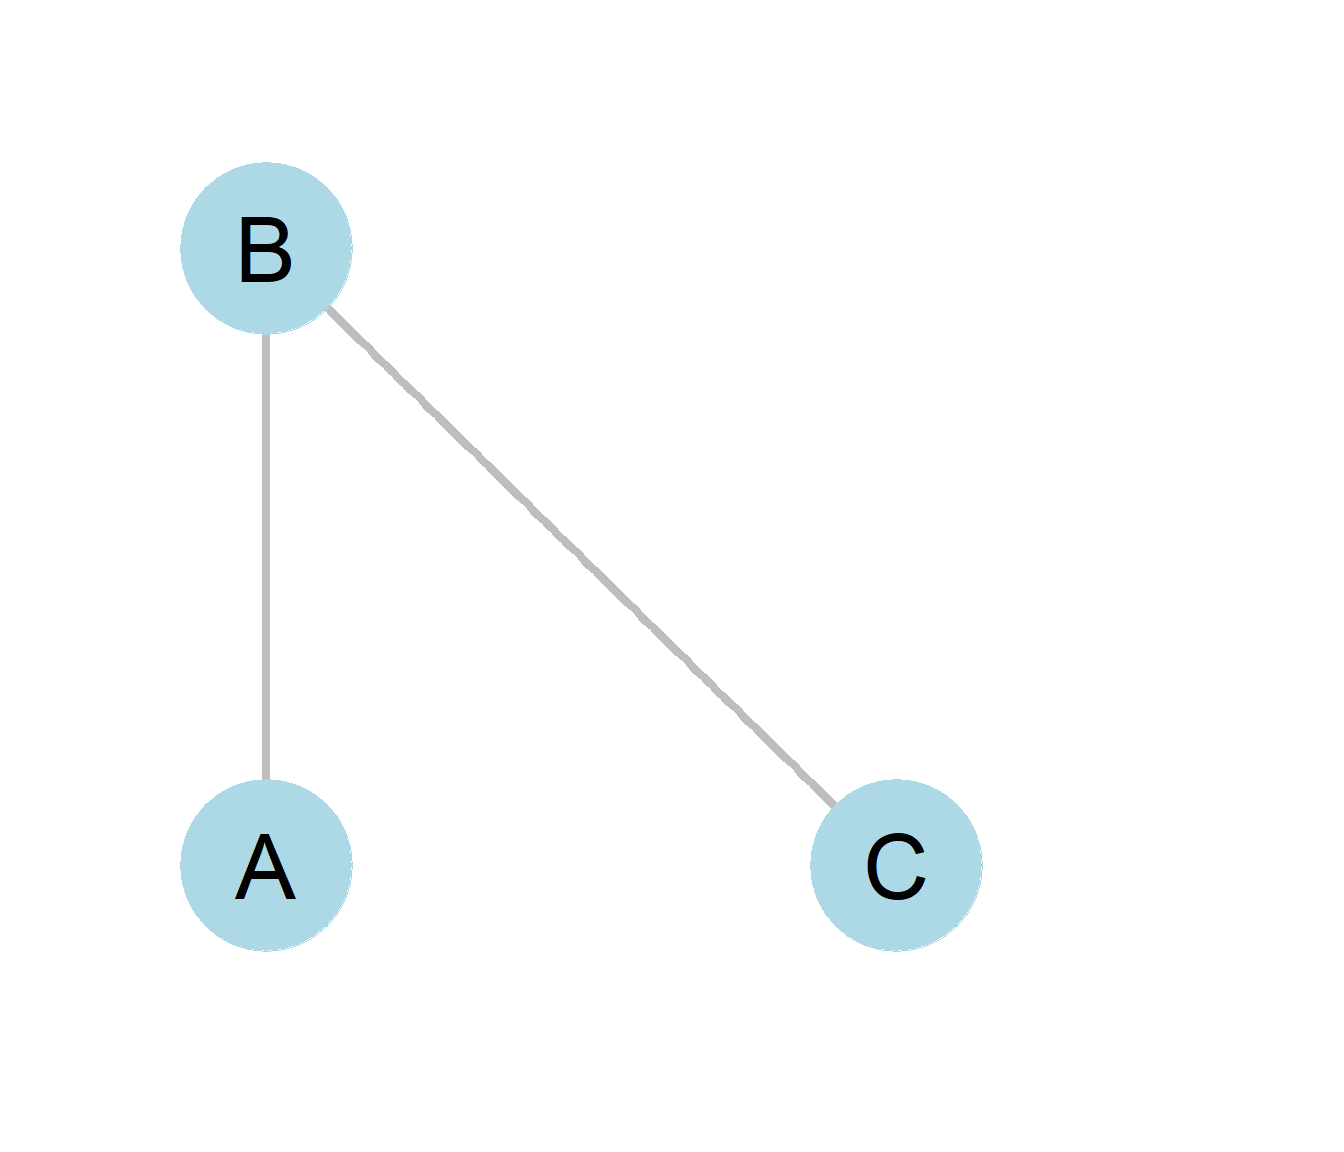
 Figure 2.3: A simple network.
In the case of power generation stations and homes, the edges can represent power lines. Meanwhile, servers and computers are connected by internet cables and wi-fi access, while towns are connected by roads. The existence of edges signal the potential for content to flow, whether that’s power, computer data, or people in cars. In the case of social networks, the content that flows between two nodes are a relationship of some type.
Figure 2.3 shows an example of a graph with three nodes and two edges. Nodes A, B, and C are circles representing actors A, B, and C whose real world social relationships we are interested in studying. The simple lines drawn between A and B and likewise between B and C are edges indicating the presence of a relationship and the edges, AB and BC in the graph. The lack of an edge between nodes A and C reflects the absence of a relationship between actors named A and C in the real world.
While this book will mostly use the terms node and edge when referring to graphs, these are not the only terms in use amongst those who use network analysis techniques. Additional names for nodes include, vertex or point. Relationships between two nodes are, in addition to being called edges, are referred to as ties or links.
| Academic Origin | Social Actor | Relationship |
|---|---|---|
| Mathematics | Vertex | Edge |
| Sociometry | Node | Tie/Link |