9 Manuscript figures
9.1 Country Level Hazard
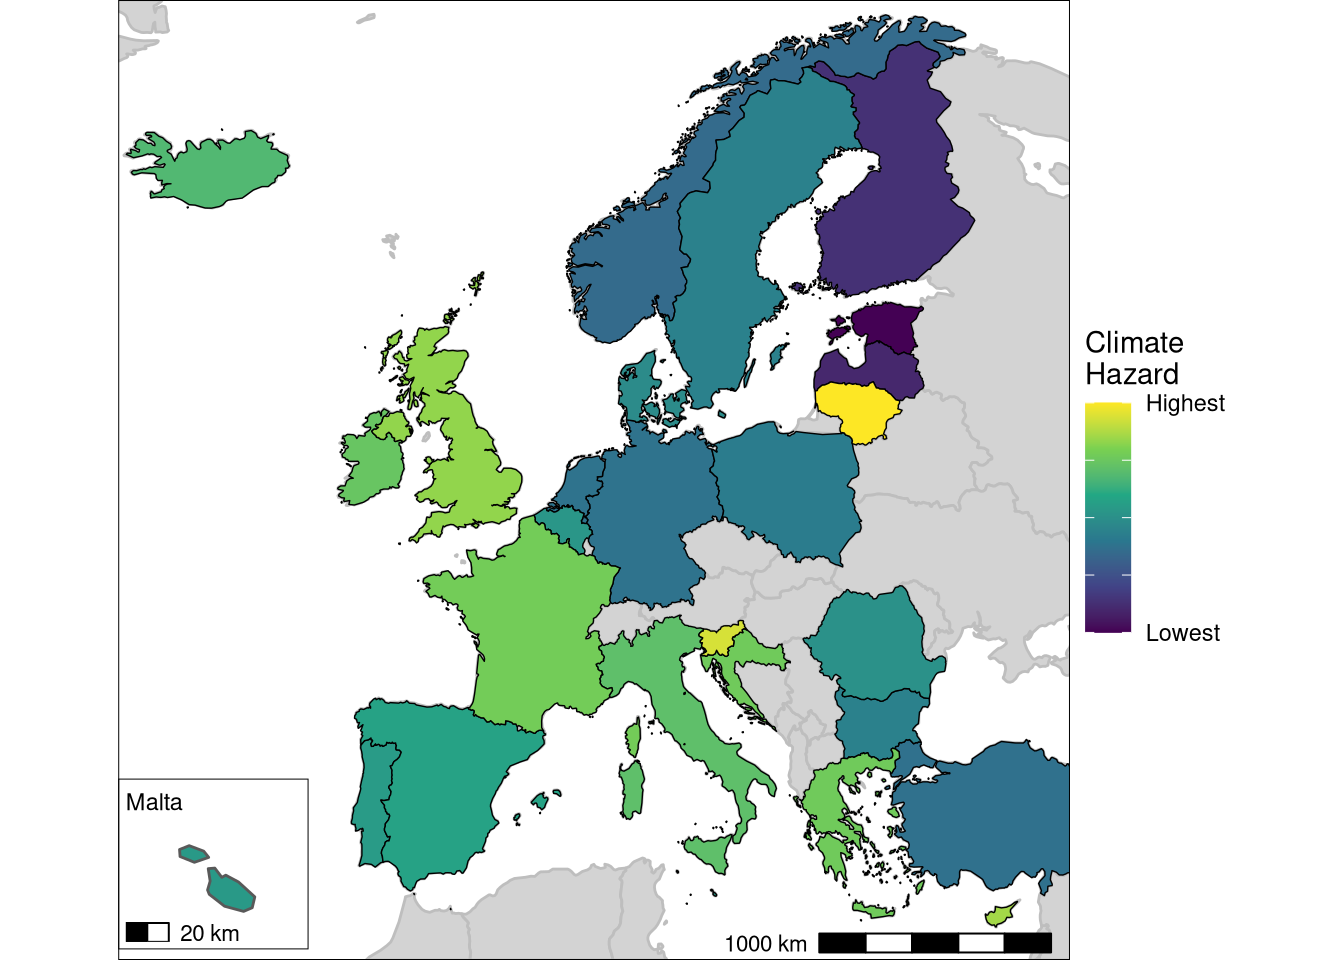
9.2 Fleet Analysis
Firstly, the top and bottom 10
| Fleet segement | Value of landings | Hazard rank | Exposure rank | Vulnerability rank | Risk rank |
|---|---|---|---|---|---|
| DNK A27 TM40XX | 363359393 | 20 | 190 | 8 | 1 |
| ITA A37 PGP0006 | 5721462 | 209 | 8 | 16 | 2 |
| PRT A27 DFN1012 | 356623 | 161 | 14 | 56 | 3 |
| PRT A27 DTS0010 | 381875 | 177 | 54 | 10 | 4 |
| ESP A37 DFN0612 | 630329 | 211 | 12 | 30 | 5 |
| ESP A37 DRB1218 | 167984 | 38 | 140 | 77 | 6 |
| PRT A27 PGP0010 | 9661098 | 114 | 66 | 83 | 7 |
| ESP A27 PS2440 | 34961230 | 51 | 119 | 93 | 8 |
| PRT A27 TBB0010 | 263508 | 131 | 56 | 90 | 9 |
| ITA A37 PMP1218 ° | 449076 | 66 | 158 | 54 | 10 |
| Fleet segement | Value of landings | Hazard rank | Exposure rank | Vulnerability rank | Risk rank |
|---|---|---|---|---|---|
| BGR A37 HOK0006 | 987 | 198 | 310 | 343 | 349 |
| DNK A27 DTS0010 | 461395 | 311 | 244 | 292 | 350 |
| LTU A27 DFN1012 ° | 254828 | 308 | 338 | 212 | 351 |
| FRA A27 FPO1824 ° | 3387456 | 348 | 304 | 205 | 352 |
| PRT A27 DRB1012 | 1071358 | 341 | 226 | 289 | 353 |
| BGR A37 FPO0006 | 1451 | 207 | 326 | 343 | 354 |
| ESP A27 DRB1012 | 293883 | 355 | 350 | 178 | 355 |
| BEL A27 PMP1824 ° | 495885 | 351 | 313 | 252 | 356 |
| GBR A27 HOK1012 ° | 355039 | 349 | 303 | 285 | 357 |
| ESP A27 DRB1218 | 2285575 | 356 | 358 | 267 | 358 |
| Caption: Fleet segme | nts with the top and | bottom 10 cli | mate risk scores | . |
In total, we have been able to assess risk for 358 fleet segments.
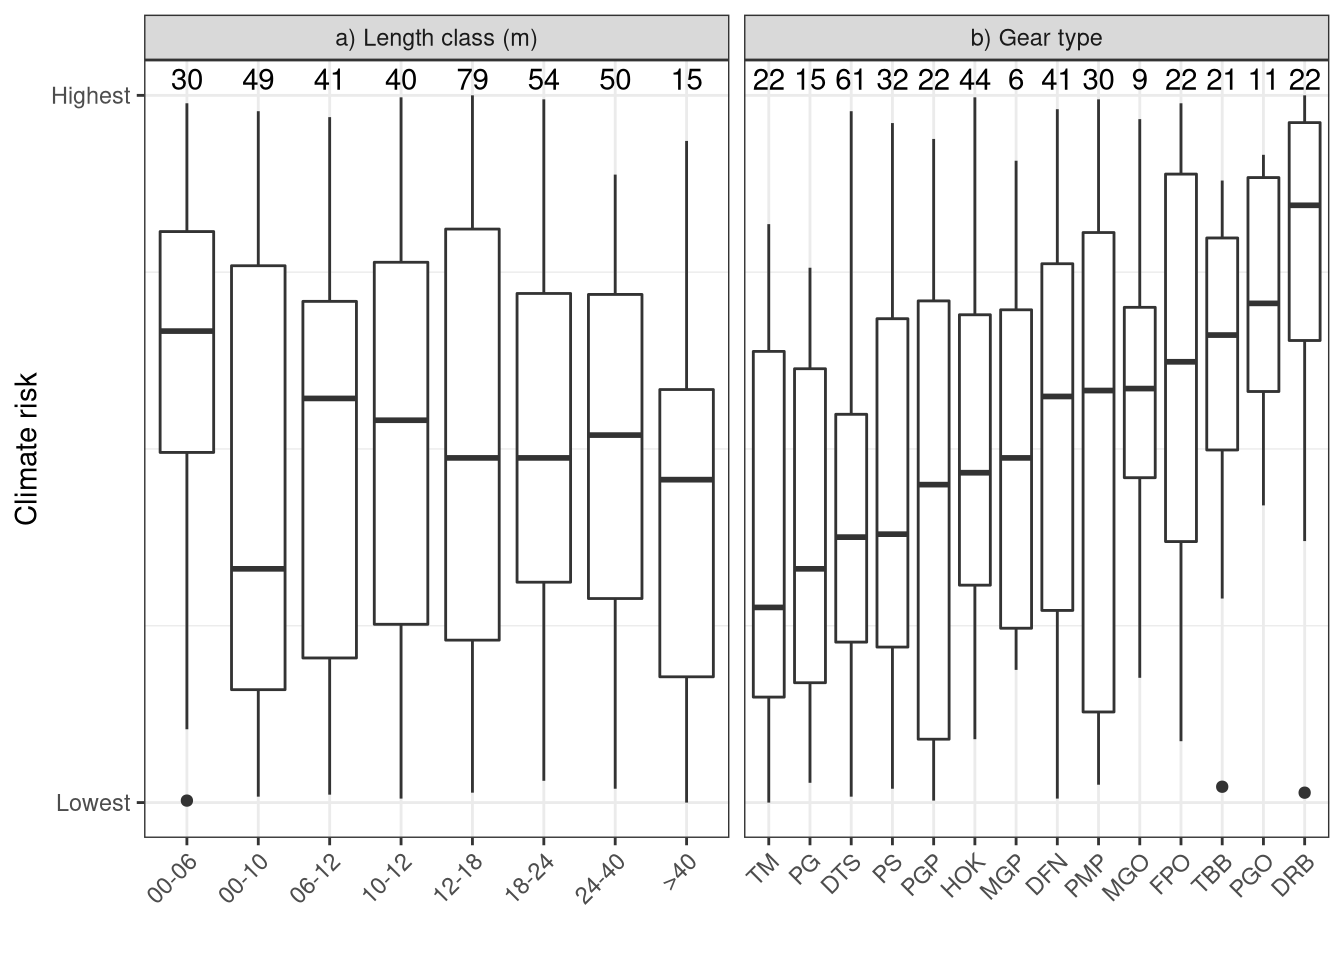 Caption: Climate risk as a function of the size range of vessels in each fleet segment. Note that the STECF definitions of length range vary between country and therefore have a degree of overlap. The distribution of risk is represented on a linear scale from highest to lowest: the absolute values are not shown, as they have little direct meaning. Risk is shown as a boxplot, where the horizontal line is the median, the box corresponds to the interquartile range (IQR), and the whiskers cover all points less than 1.5 times the IQR from the box. Outliers are plotted as points. The number of fleet segments in each class is shown at the top: in total there are 358 fleet segments in the analysis.
DFN: Drift and/or fixed netters, DRB: Dredgers, DTS: Demersal trawlers and/or demersal seiners, FPO: Vessels using pots and/or traps, HOK: Vessels using hooks, MGO: Vessel using other active gears, MGP: Vessels using polyvalent active gears only, PG: Passive Gears, PGO: Vessels using other passive gears, PGP: Vessels using polyvalent passive gears only, PMP: Vessels using active and passive gears, PS: Purse seiners, TBB: Beam trawlers, TM: Pelagic trawlers
QUESTION: I’m not quite sure how whether to retain the other fishing region fleets, or just keep it to the FAO27 and FAO37 areas - we don’t have very much biological information outside these regions.
QUESTION: I can also plot this as a map, based on the median value…
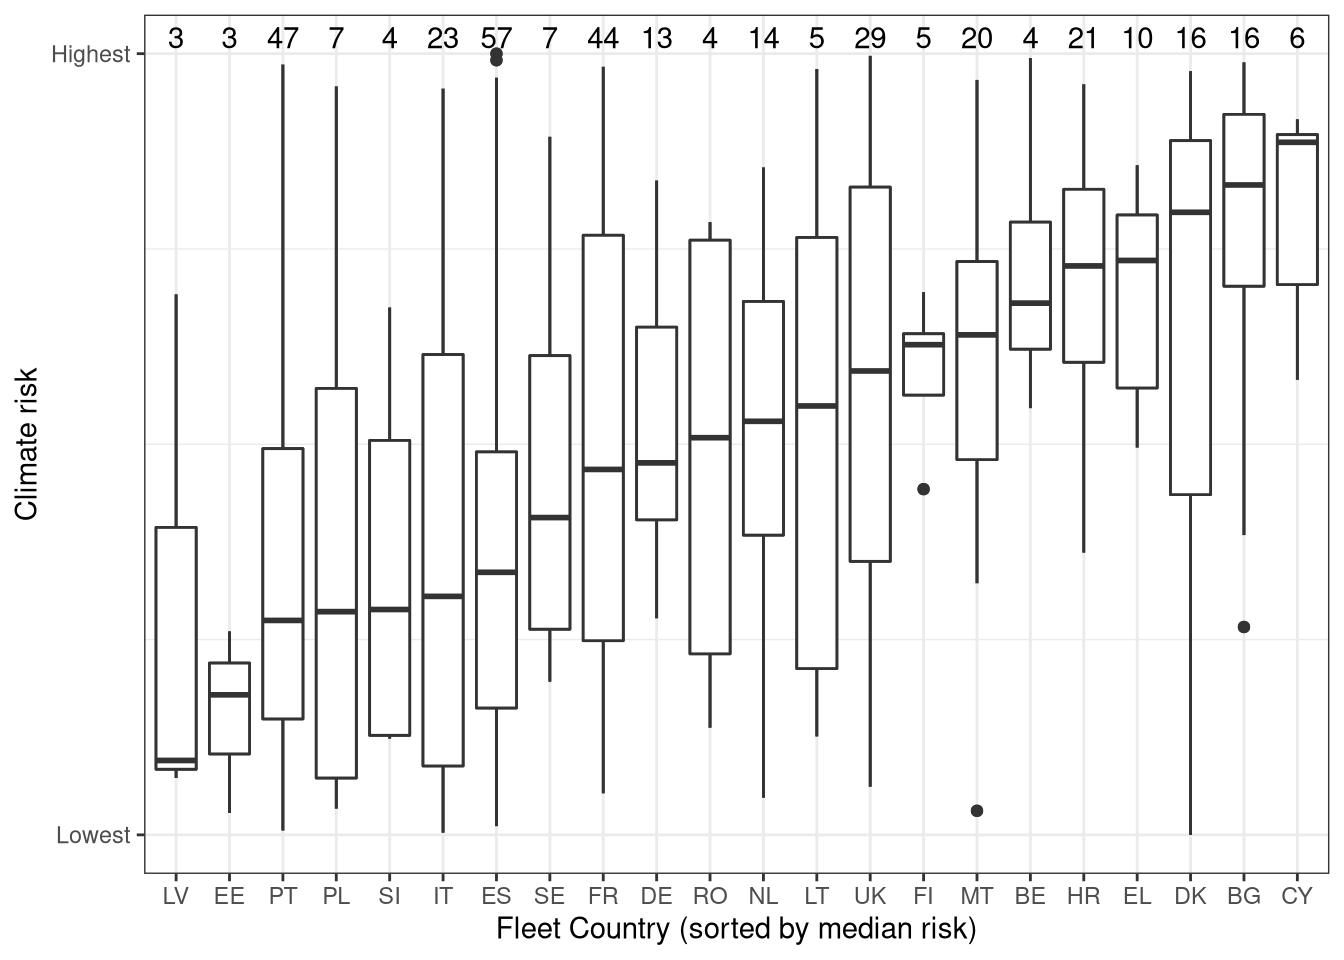 CAPTION:
9.3 Regional Analysis
9.3.1 Components
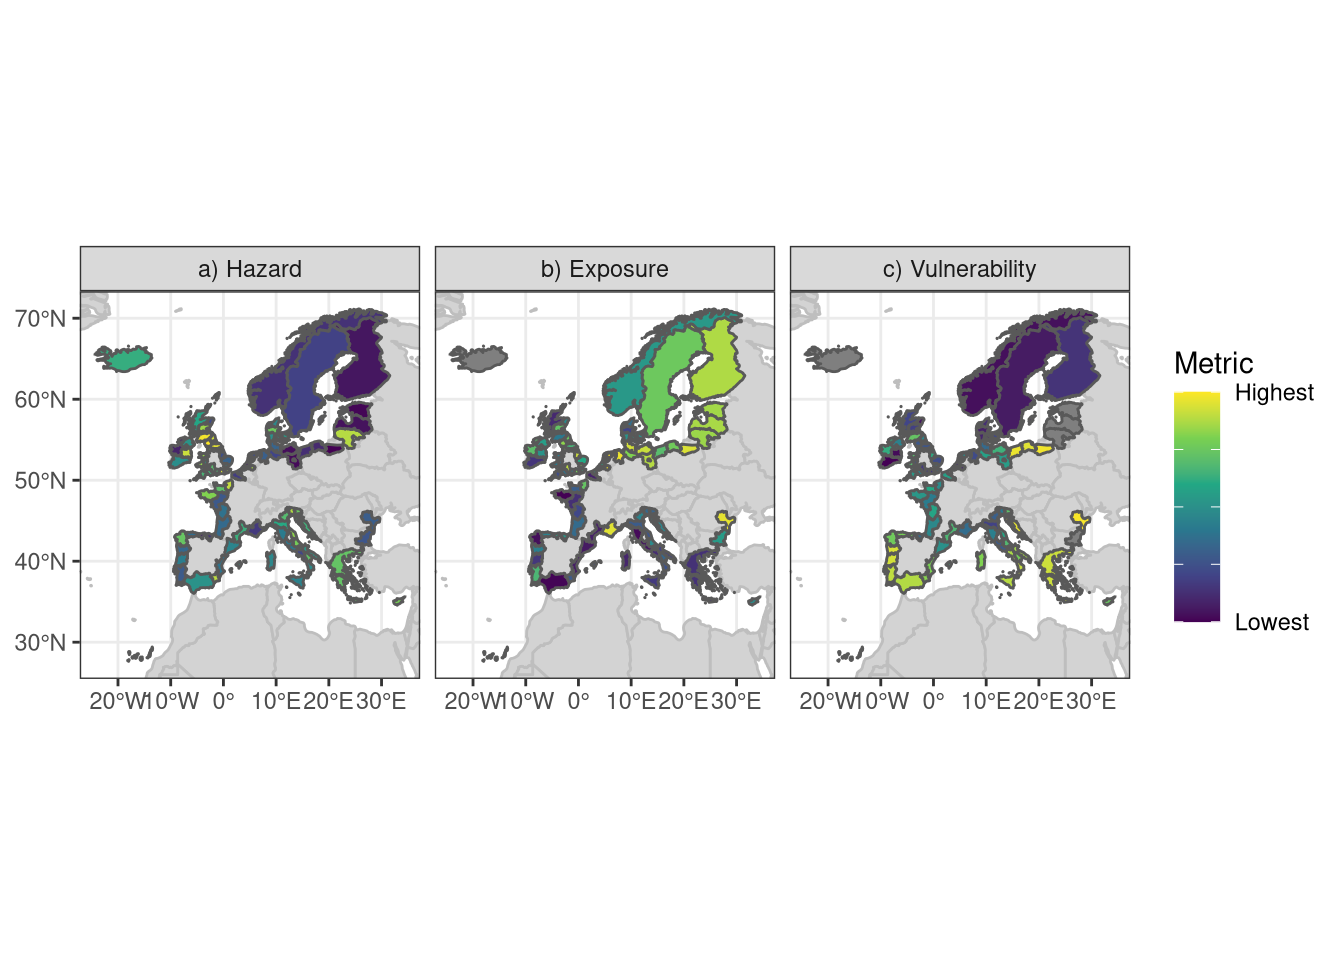
Caption: Map of the individual elements of the regional risk analysis. a) Hazard b) Exposure and c) Vulnerability are plotted for each of the regions in the analysis. Each metric is rescaled so that the range between panels is identical. Colour scale is linear in the value of the corresponding score,but is presented without values as they have little direct meaning. National-level borders are shown for reference.
TODO:
- Reproject to a Lambert Azimuthal Equal-area projections
- Check Iceland problems
- Map inserts for Malta and other small countries
- Could be merged with the overall figure for regional risk, but I think it makes more sense to have it separate.
9.3.2 Regional Risk
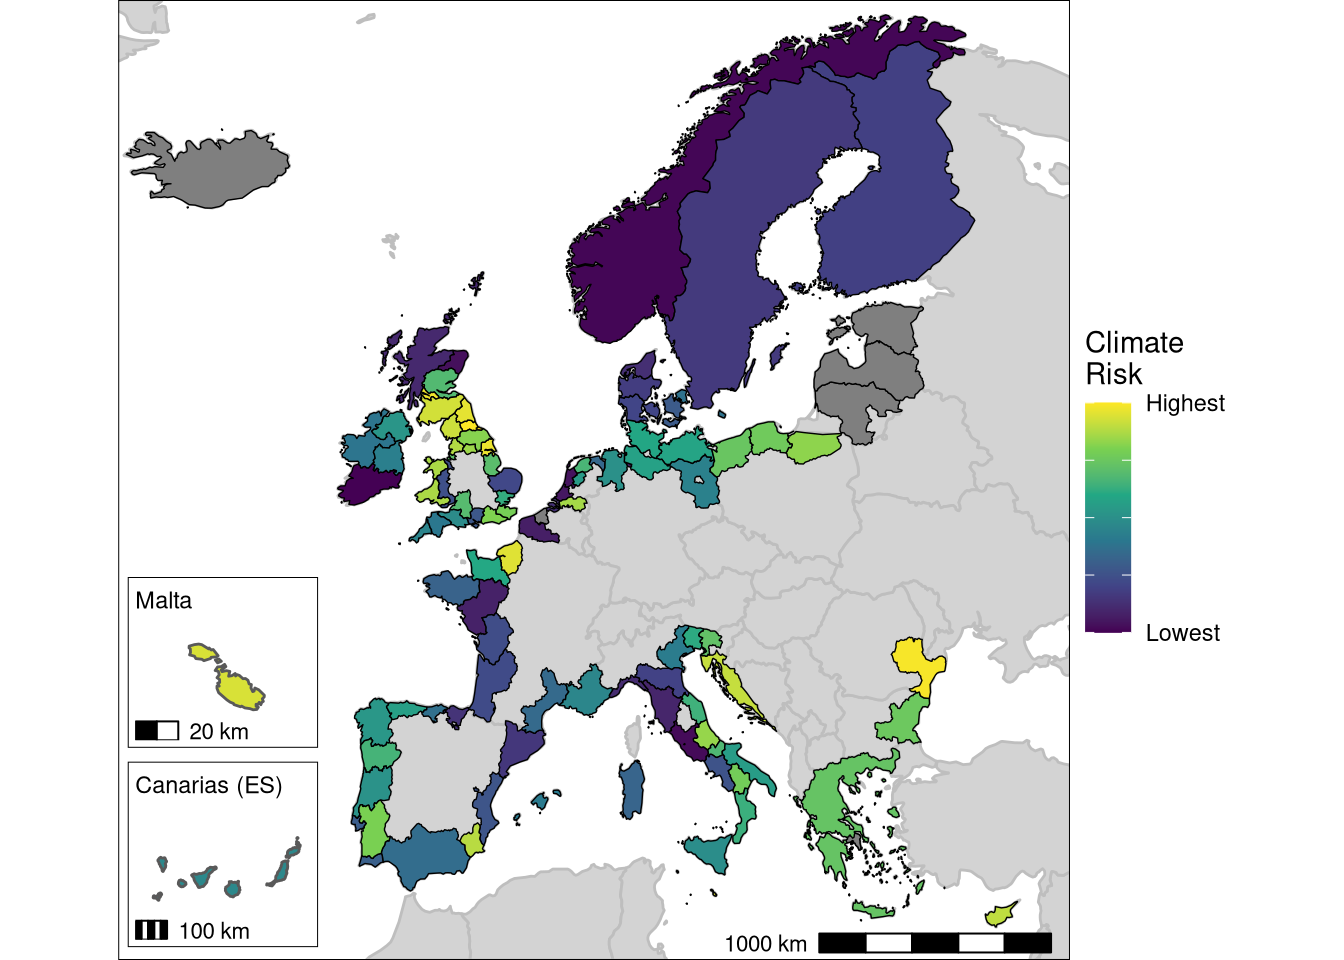
Caption: Map of the regional climate risk. Colour scale is linear in the value of the corresponding score, but is presented without values, as they have little direct meaning. National-level borders are shown for reference.
TODO: * Reproject to a Lambert Azimuthal Equal-area projections
9.4 Combined analysis
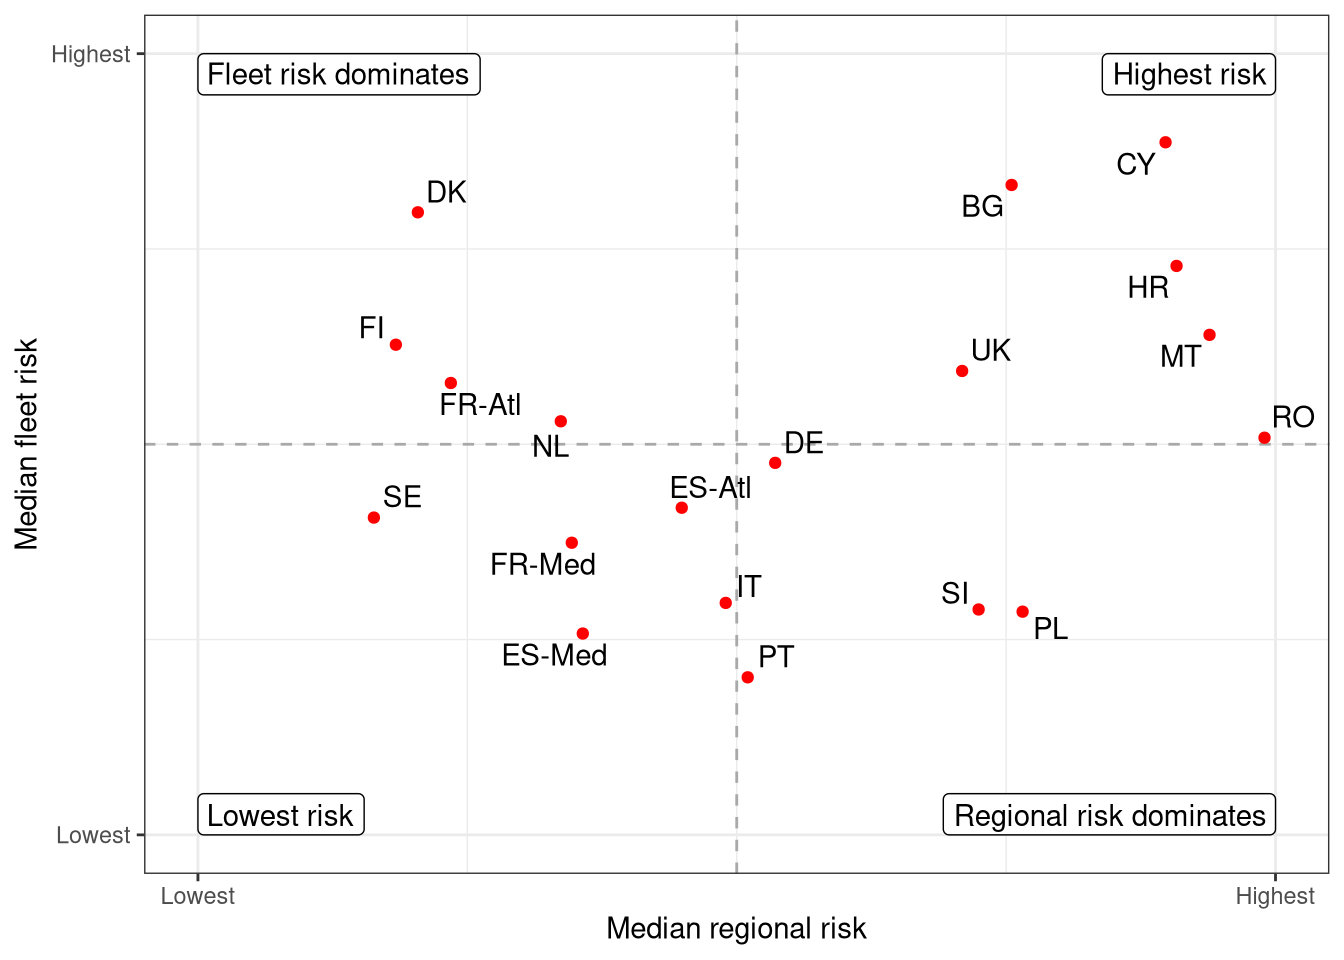
Caption: Note that Iceland and Norway are not shown, as there is no fleet data available for these countries. Note that we use straight medians, rather than weighted medians, as there is no clear value-of-fisheries data available for the regions. Or maybe there is in EUMOFA. Check this.