7 Archive
Analyses and text that are currently not being used, but that are included here for reference
7.1 Stock-specific warming rate
The Aquamaps environmental database also contains temperature projections, based on the IPSL model under IPCC scenario A2. We can use this to calculate the rate of warming for each pixel within the habitat of cod over the period (1999-2050).
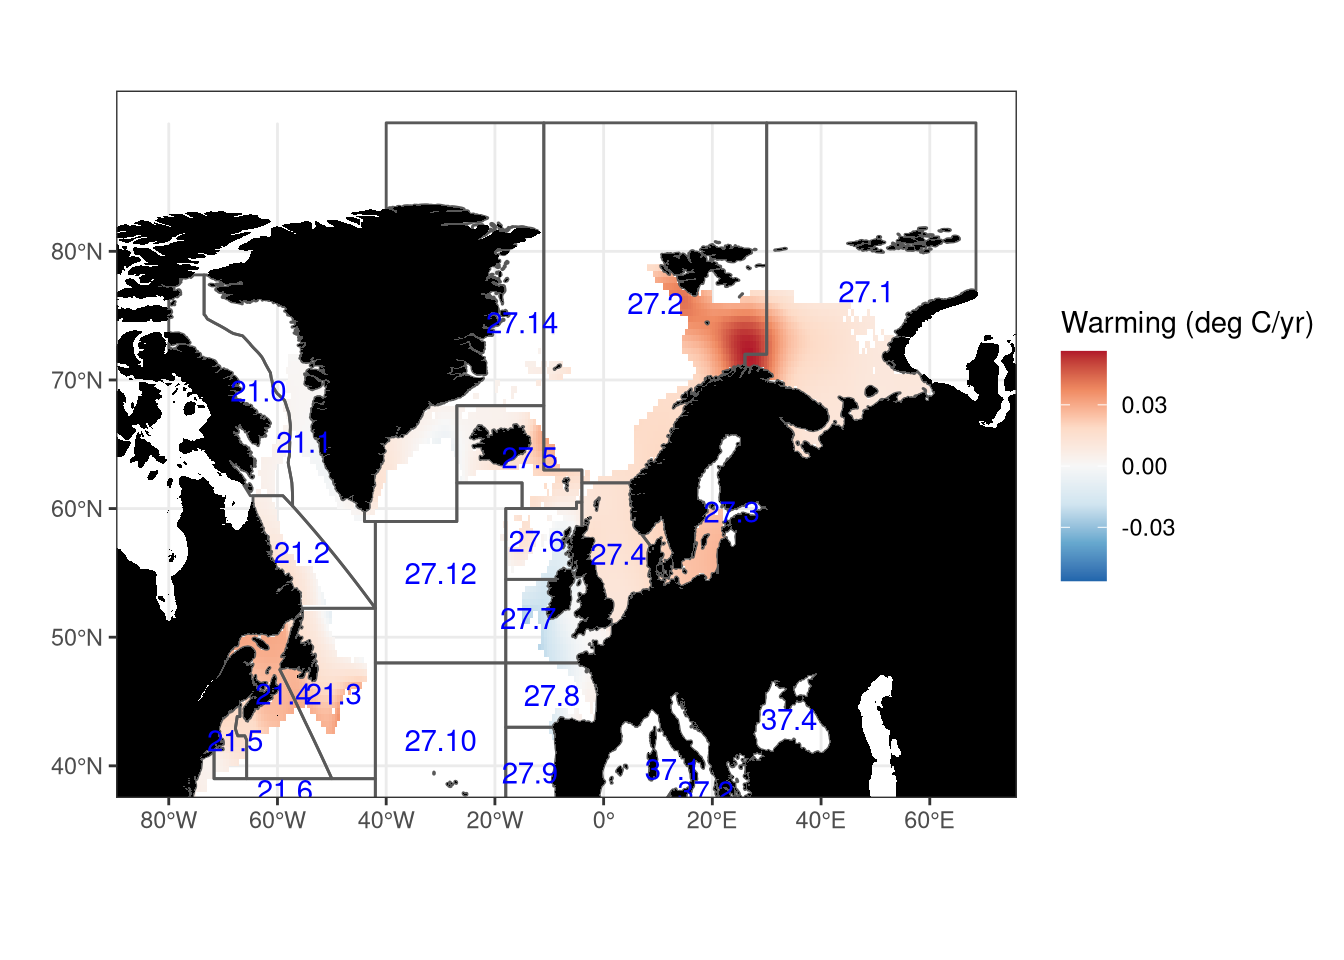
Figure 19: Average rate of warming derived from Aquamaps
This clearly shows that not all areas are warming, or equally.
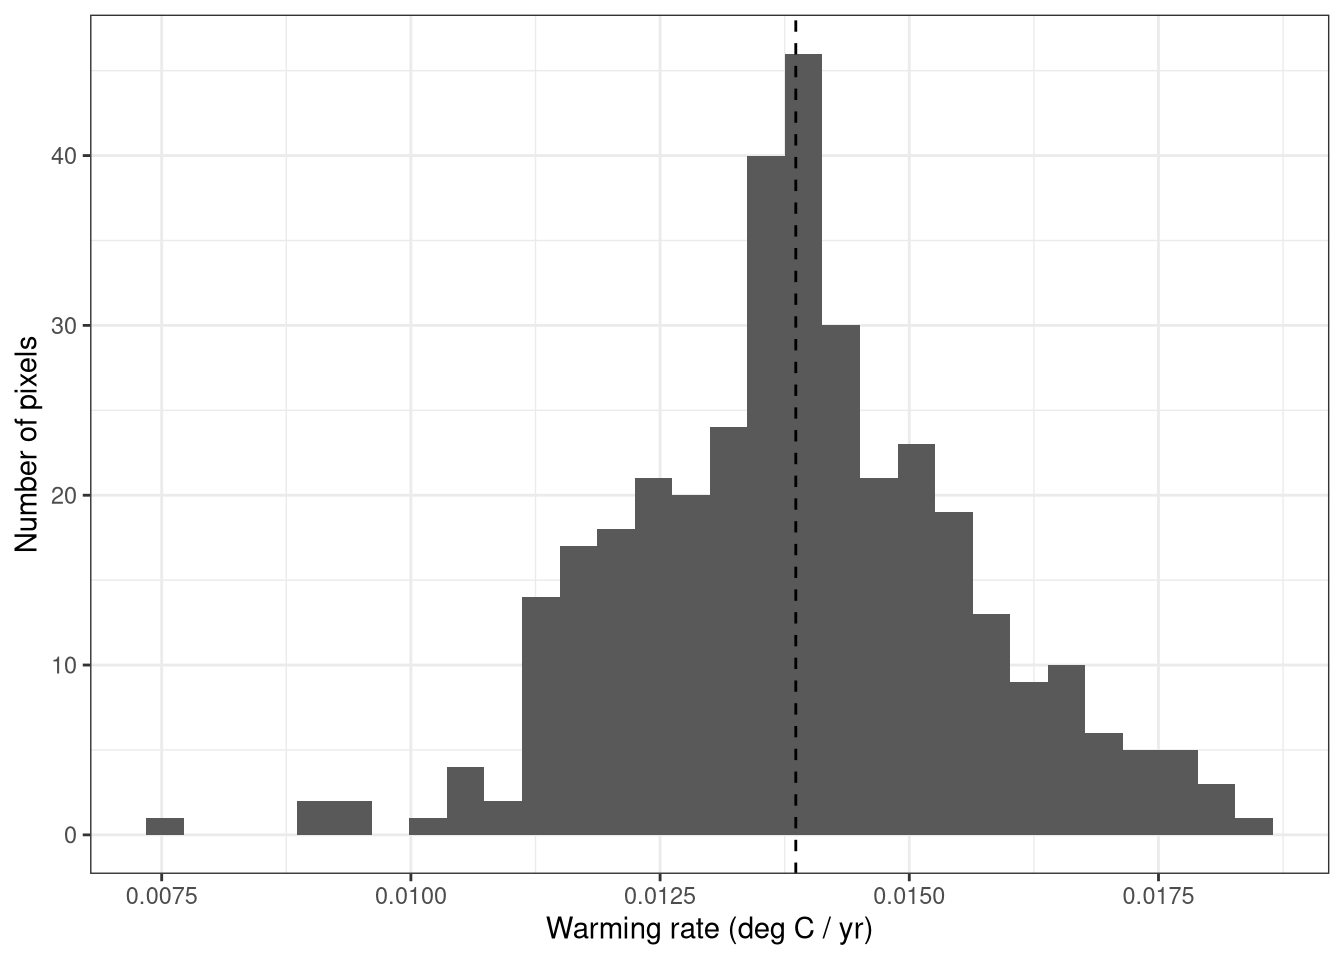
Figure 20: Distribution of warming rate values for FAO region 27.4 The dashed vertical line indicates the median value.
Now, we can repeat the exercise for all FAO areas for this species, and plot the two median values of the metrics against each other.
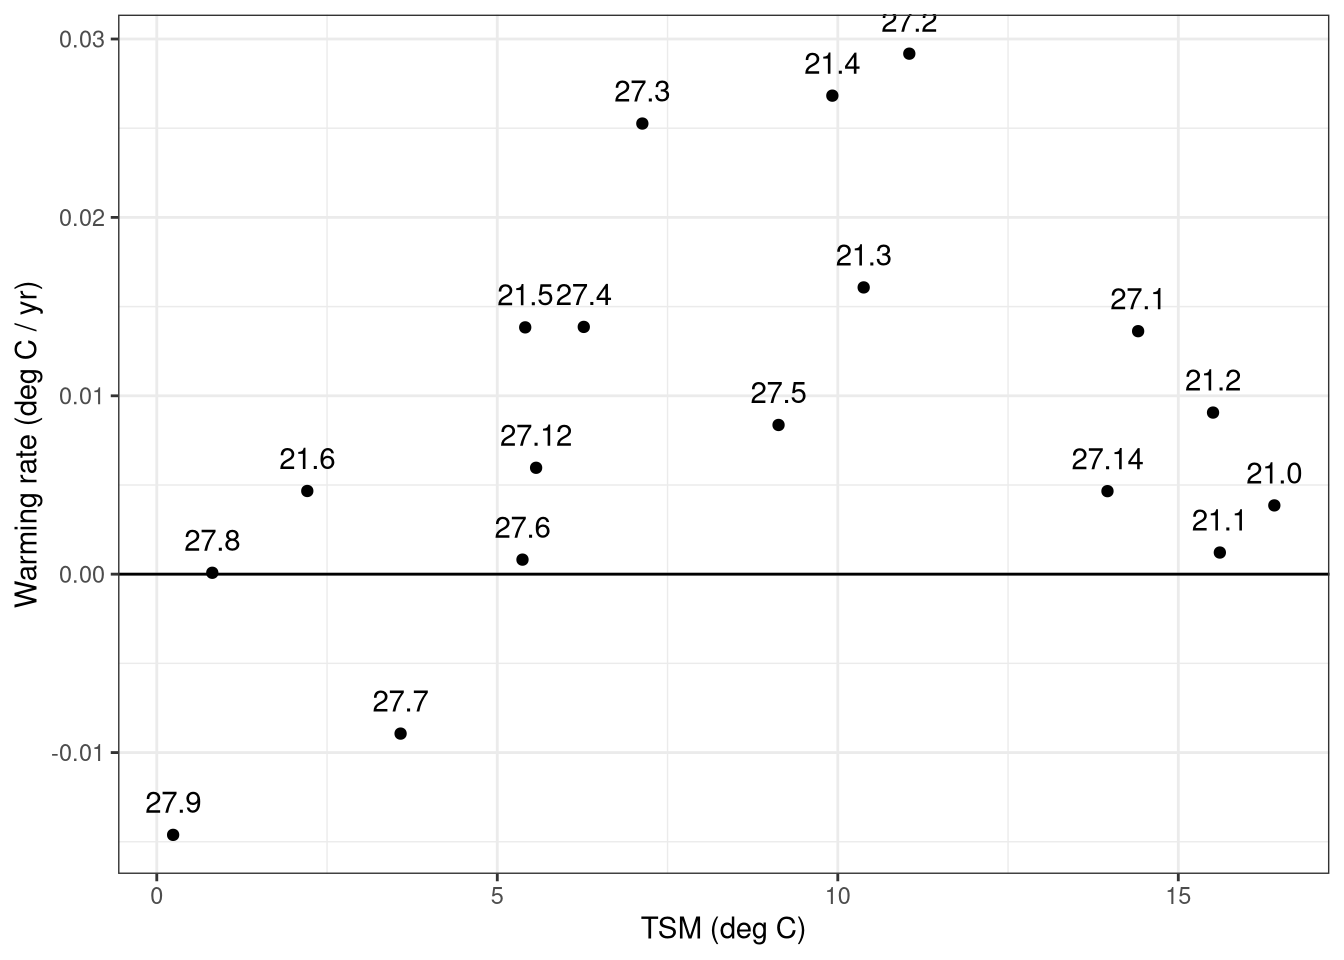
This figure could forms the basis for defining exposure and sensitivity metrics for Atlantic cod. The region with the highest vulnerability is that in the top-left i.e. where the TSM is low and the warming rate is high. Regions with negative warming rates are essentially cooling and therefore should have the lowest vulnerability score.
However, John and I have also had a long discussion about this, and decided in the end to leave the spatial context of warmnig out ot the analysis, as
- we are unsure how to incorporate it into the climate-risk framework
- we are not particularly happy with the Aquamaps warming projections - they are fairly old and based on a single model - some of the results projecting cooling in this model are not consistent with out understanding. To do this properly we would need to consider either a multi-model ensemble, preferably with downscaling to capture the shelf effects and the baltic properly
Instead, we choose to say that everything is captured by the TSM.
7.2 Relative TSM
As an aside, I also considered defining a relative TSM, by normalising the TSM by the rate of warming. i.e.
\[RTSM_i=\frac{T_{90^{th}}-T_{i}}{r_{warm}}\] where \(r_{warm}\) is the rate of warming, in degrees C per year - RTSM therefore has units of years, and could be interpreted as the number of years until the TSM was exceeded. However, although this seemed like a good idea at the time, it didn’t really workout in practice very well - the negative and zero warming rates lead to many RTSMs that were extremely large.