Chapter 5 Using R as a GIS
5.1 Introduction
5.2 Spatial Intersection and Clip Operations
library(tmap)
library(sf)
# convert to sf objects
torn_sf <- st_as_sf(torn)
us_states_sf <- st_as_sf(us_states)
# plot extent and grey background
tm_shape(us_states_sf) +
  tm_polygons("grey90") +
  # add the torn points
  tm_shape(torn_sf) +
    tm_dots(col = "#FB6A4A", size = 0.04, shape = 1, alpha = 0.5) +
  # map the state borders
  tm_shape(us_states_sf) +
    tm_borders(col = "black") +
tm_layout(frame = F) 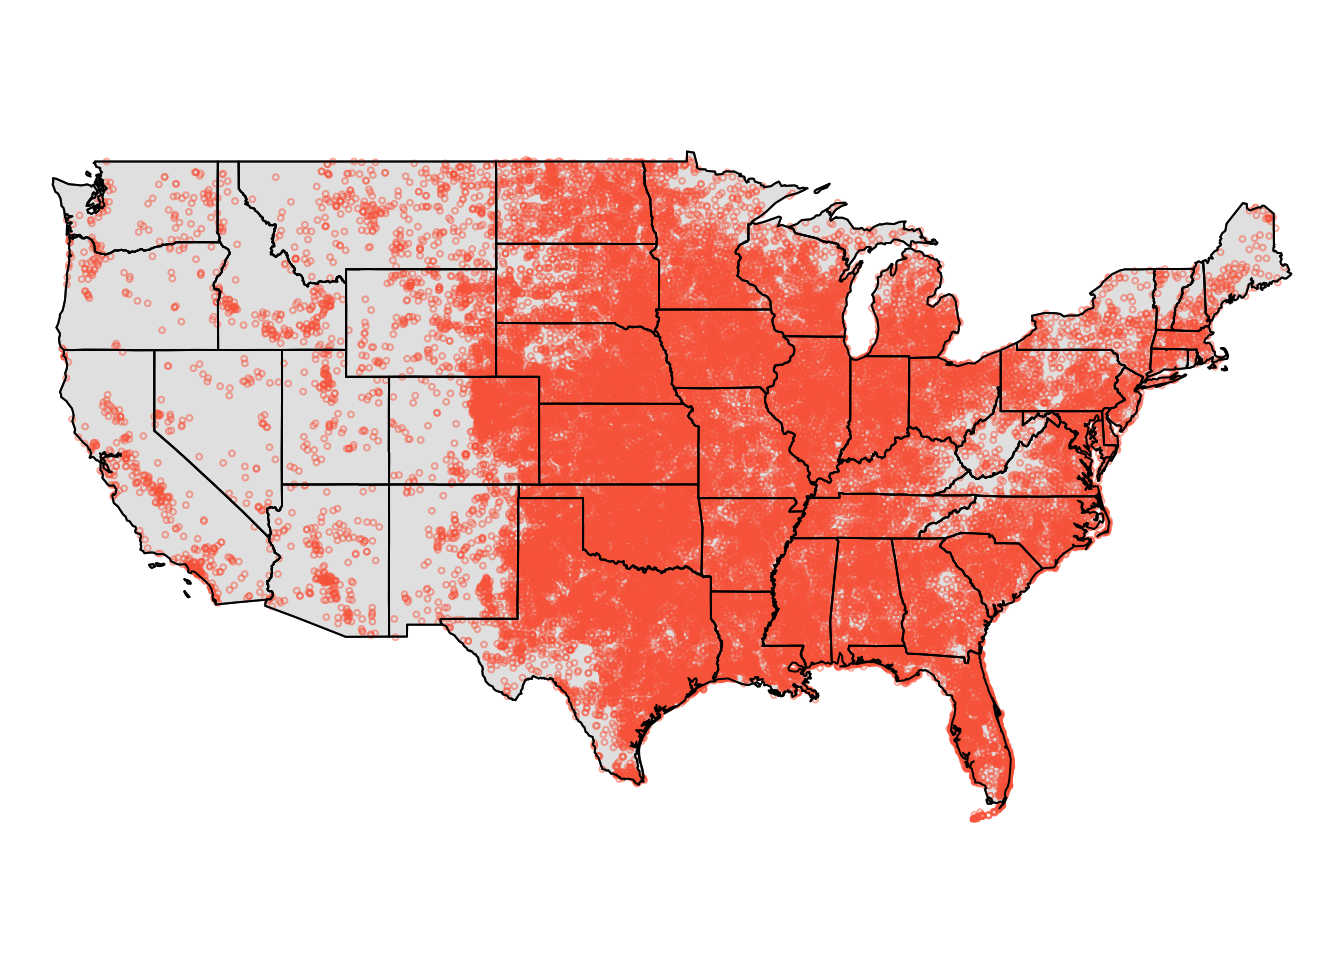
Figure 5.1: The tornado data
plot(us_states, col = "grey90")
plot(torn, add = T, pch = 1, col = "#FB6A4A4C", cex = 0.4)
plot(us_states, add = T)index <- us_states$STATE_NAME == "Texas" |
us_states$STATE_NAME == "New Mexico" |
us_states$STATE_NAME == "Oklahoma" |
us_states$STATE_NAME == "Arkansas"
AoI <- us_states[index,]
# OR....
AoI_sf <- us_states_sf[index,]tm_shape(AoI_sf) +
tm_borders(col = "black") +
tm_layout(frame = F) +
# add the torn points
tm_shape(torn_sf) +
tm_dots(col = "#FB6A4A", size = 0.2, shape = 1, alpha = 0.5)
# OR in sp
plot(AoI)
plot(torn, add = T, pch = 1, col = "#FB6A4A4C")tm_shape(torn_clip_sf) +
tm_dots(col = "#FB6A4A", size = 0.2, shape = 1, alpha = 0.5) +
tm_shape(AoI_sf) +
tm_borders()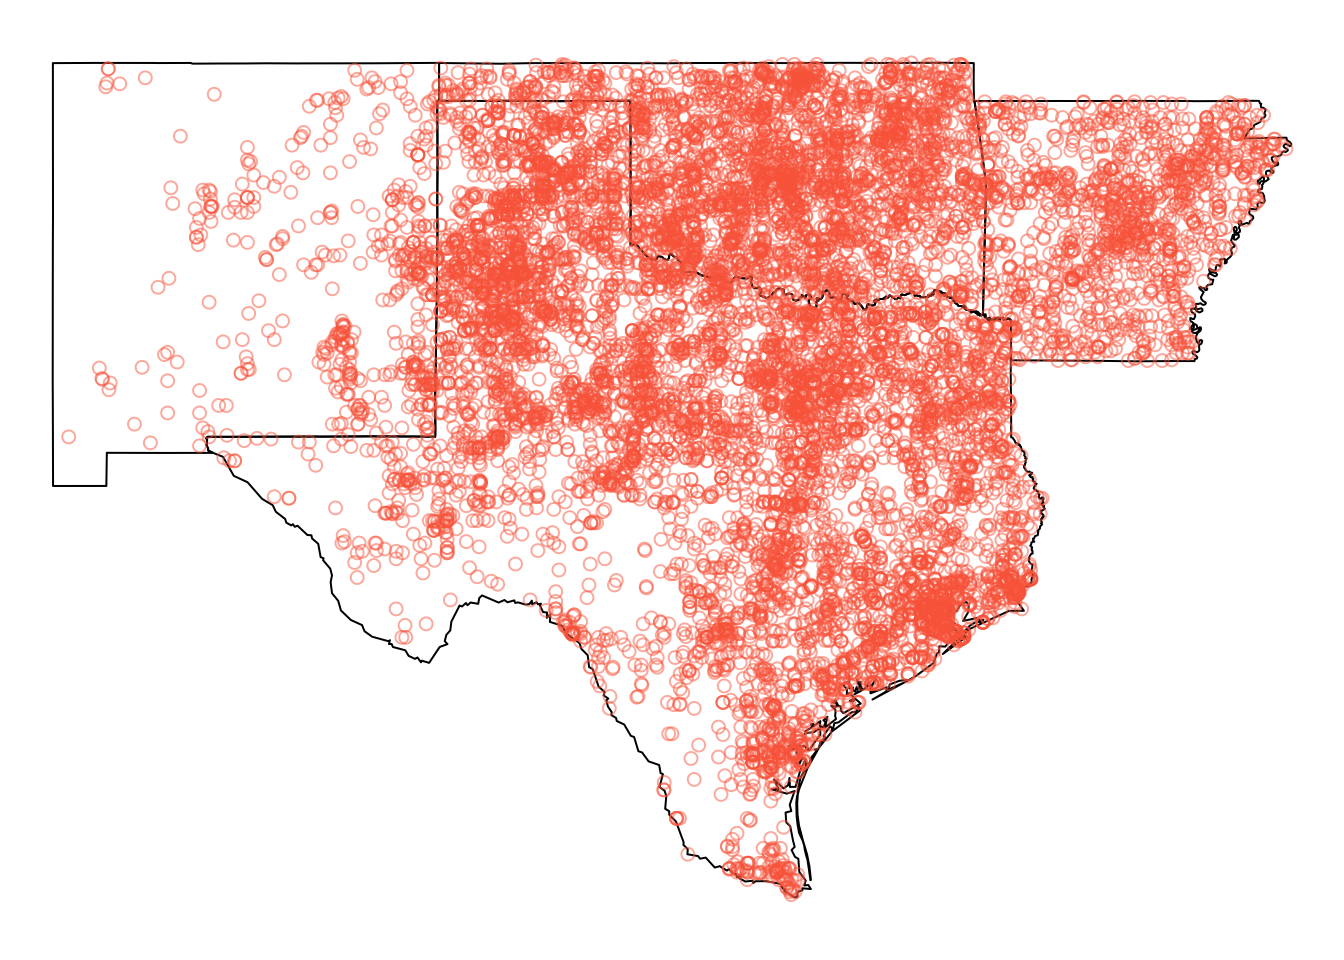
Figure 5.2: The tornado data in the defined Area of Interest
AoI_torn_sf <- st_intersection(AoI_sf, torn_sf)
tm_shape(AoI_sf) + tm_borders(col = "black") + tm_layout(frame = F) +
  # add the torn points
  tm_shape(AoI_torn_sf) +
tm_dots(col = "#FB6A4A", size = 0.2, shape = 1, alpha = 0.5)5.3 Buffers
# select an Area of Interest and apply a buffer
# in rgeos
AoI <- us_states2[us_states2$STATE_NAME == "Texas",]
AoI.buf <- gBuffer(AoI, width = 25000)
# in sf
us_states2_sf <- st_as_sf(us_states2)
AoI_sf <- st_as_sf(us_states2_sf[us_states2_sf$STATE_NAME == "Texas",])
AoI_buf_sf <- st_buffer(AoI_sf, dist = 25000)
# map the buffer and the orginal area
# sp format
par(mar=c(0,0,0,0))
plot(AoI.buf)
plot(AoI, add = T, border = "blue")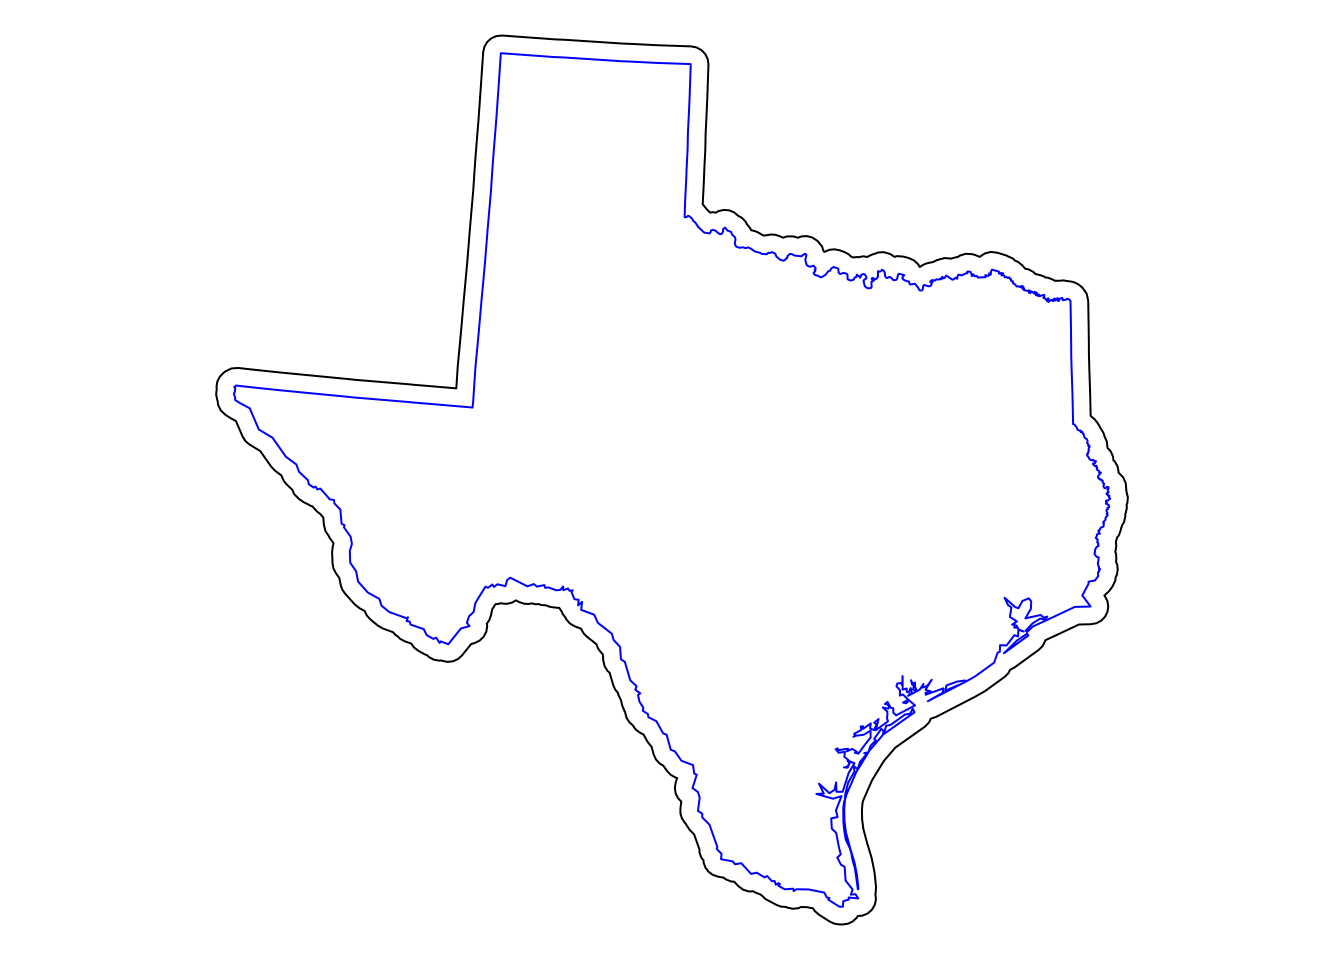
Figure 5.3: Texas with a 25km buffer
# tmap: commented out!
# tm_shape(AoI_buf_sf) + tm_borders("black") +
#   tm_shape(AoI_sf) + tm_borders("blue") +
# tm_layout(frame = F)data(georgia)
georgia2_sf <- st_as_sf(georgia2)
# apply a buffer to each object
# sf
buf_t_sf <- st_buffer(georgia2_sf, 5000)
# rgeos
buf.t <- gBuffer(georgia2, width = 5000, byid = T, id = georgia2$Name)
# now plot the data
# sf
tm_shape(buf_t_sf) +
tm_borders() +
tm_shape(georgia2) +
tm_borders(col = "blue") +
tm_layout(frame = F)
# rgeos
plot(buf.t)
plot(georgia2, add = T, border = "blue")5.4 Merging spatial features
library(tmap)
###  with rgeos and sp - commented out
# AoI.merge <- gUnaryUnion(us_states)
# plot(us_states, border = "darkgreen", lty = 3)
# plot(AoI.merge, add = T, lwd = 1.5)
### with sf and tmap
us_states_sf <- st_as_sf(us_states)
AoI.merge_sf <- st_sf(st_union(us_states_sf))
tm_shape(us_states_sf) + tm_borders(col = "darkgreen", lty = 3) +
  tm_shape(AoI.merge_sf) + tm_borders(lwd = 1.5, col = "black") +
  tm_layout(frame = F)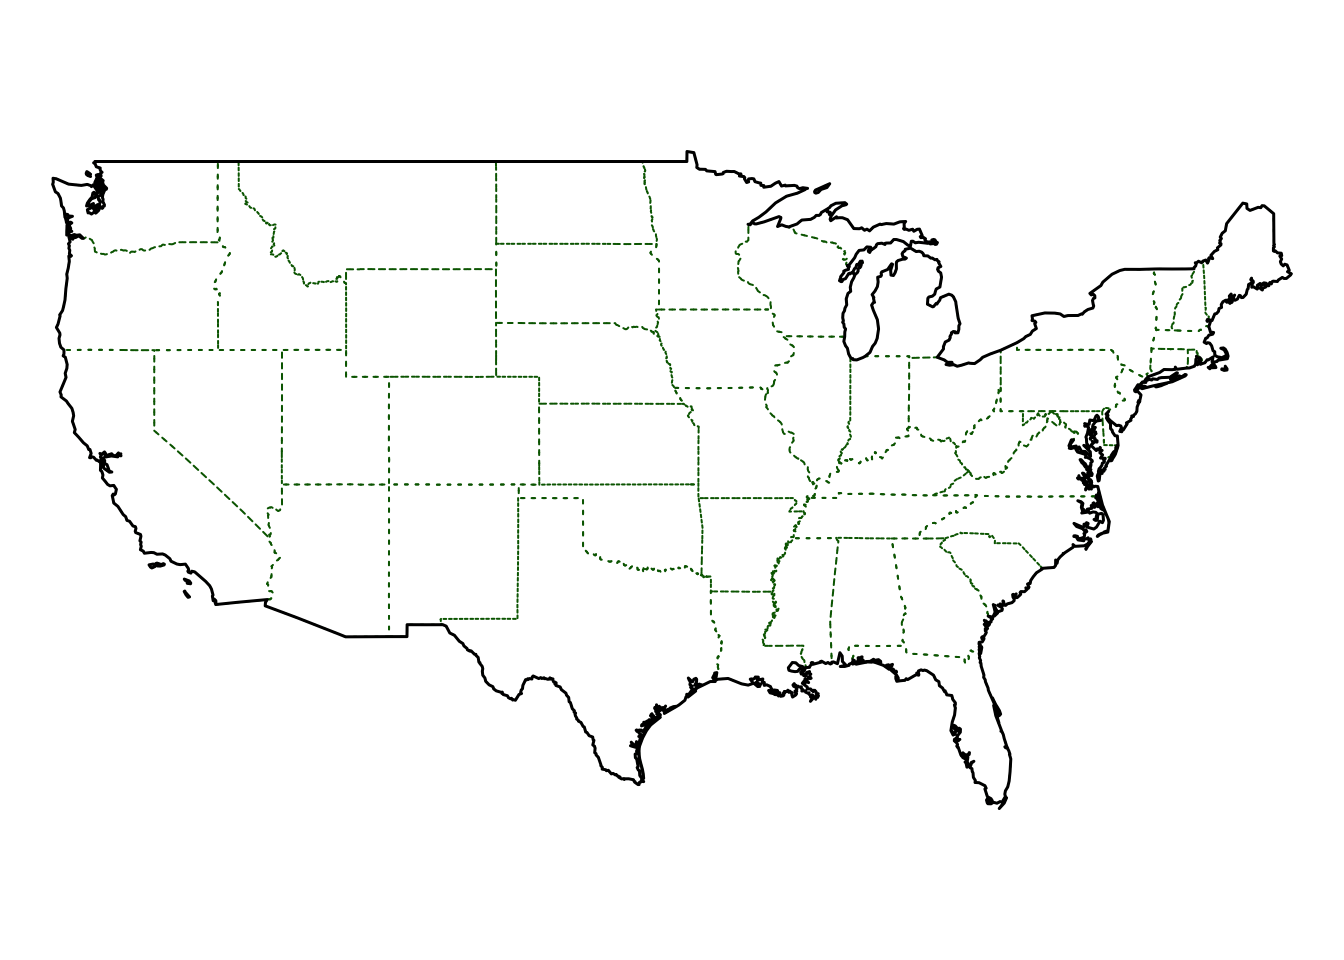
Figure 5.4: The outline of the merged US states created by gUnaryUnion, with the orginal state outlines in green
5.5 Point-in-polygon and Area calculations
5.5.1 Point-in-polygon
   1    2    3    4    5    6
79 341 87 1121 1445 549 5.5.2 Area calculations
5.5.3 Point and Areas analysis exercise
data(newhaven)
blocks$densities= poly.counts(breach,blocks) /
 ft2miles(ft2miles(poly.areas(blocks)))
cor(blocks$P_OWNEROCC,blocks$densities)
[1] -0.2038463# load and attach the data
data(newhaven)
attach(data.frame(blocks))
# calculate the breaches of the peace in each block
n.breaches = poly.counts(breach,blocks)
area = ft2miles(ft2miles(poly.areas(blocks)))
# fit the model
model1=glm(n.breaches~P_OWNEROCC,offset=log(area),family=poisson)
# detach the data
detach(data.frame(blocks))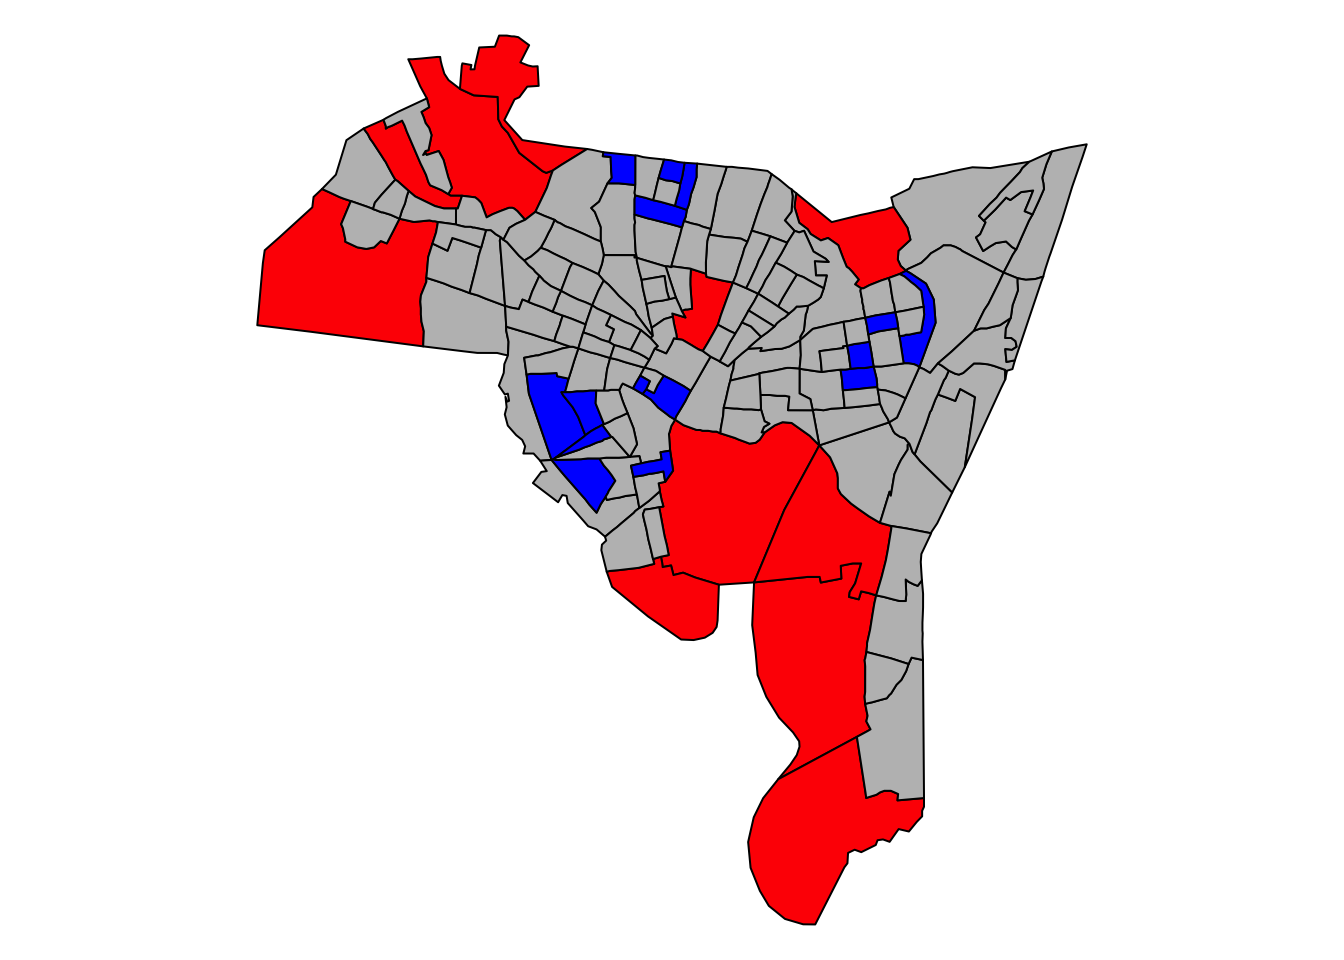
Figure 5.5: The distribution of the model1 residuals , describing the relationship between breaches of the peace and owner occupancy
attach(data.frame(blocks))
n.breaches = poly.counts(breach,blocks)
area = ft2miles(ft2miles(poly.areas(blocks)))
model2=glm(n.breaches~P_OWNEROCC+P_VACANT,
  offset=log(area),family=poisson)
s.resids.2 = rstandard(model2)
detach(data.frame(blocks))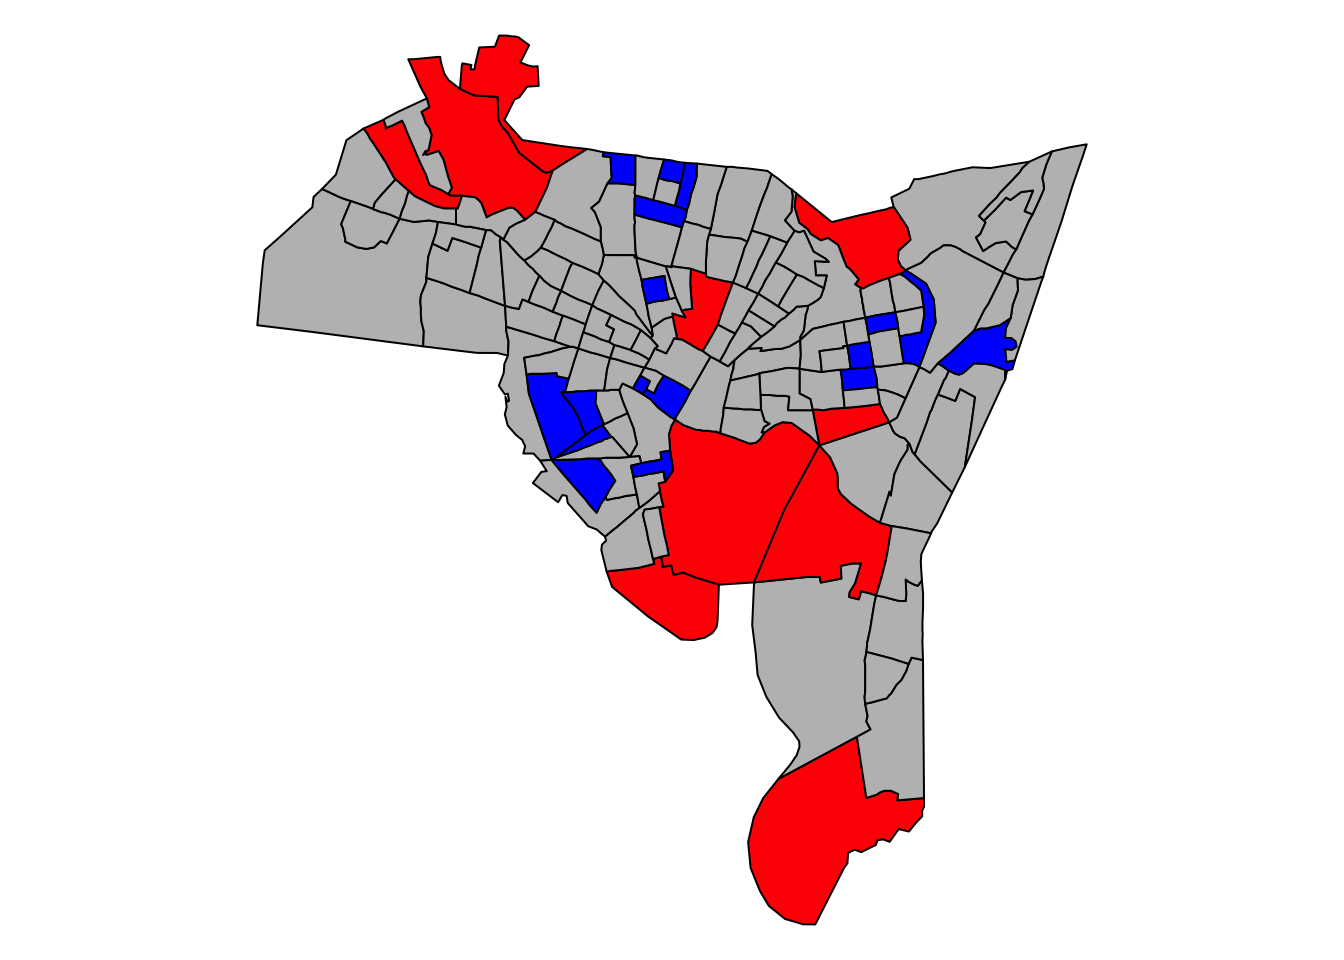
Figure 5.6: The distribution of the model2 residuals, describing the relationship between breaches of the peace with owner occupancy and vacant proprties
5.6 Creating distance attributes
# this will not work
gDistance(georgia[1,], georgia[2,])
# this will!
gDistance(georgia2[1,], georgia2[2,])
# convert to sf
georgia2_sf <- st_as_sf(georgia2)
georgia_sf <- st_as_sf(georgia)
st_distance(georgia2_sf[1,], georgia2_sf[2,])
st_distance(georgia_sf[1,], georgia_sf[2,])
# with points
sp <- st_as_sf(SpatialPoints(coordinates(georgia)))
st_distance(sp[1,], sp[1:3,])data(newhaven)
proj4string(places) <- CRS(proj4string(blocks))
cents <- SpatialPoints(coordinates(blocks),
proj4string = CRS(proj4string(blocks)))
# note the use of the ft2miles function to convert to miles
distances <- ft2miles(gDistance(places, cents, byid = T))5.6.1 Distance analysis / Accessibility exercise
distances <- ft2miles(gDistance(places, cents, byid = T))
min.dist <- as.vector(apply(distances,1, min))
blocks$access <- min.dist < 1
# and this can be mapped
# qtm(blocks, "access")
# extract the enthicity data from the blocks variable
ethnicity <- as.matrix(data.frame(blocks[,14:18])/100)
ethnicity <- apply(ethnicity, 2, function(x) (x * blocks$POP1990))
ethnicity <- matrix(as.integer(ethnicity), ncol = 5)
colnames(ethnicity) <- c("White", "Black",
"Native American", "Asian", "Other")# use xtabs to generate a cross tabulation
mat.access.tab = xtabs(ethnicity~blocks$access)
# then transposes the data
data.set = as.data.frame(mat.access.tab)
#sets the column names
colnames(data.set) = c("Access","Ethnicity", "Freq") modelethnic = glm(Freq~Access*Ethnicity,
data=data.set,family=poisson)
# the full model can be printed to the console
# summary(modelethnic)tab <- 100*(exp(mod.coefs[,1]) - 1)
tab <- tab[7:10]
names(tab) <- colnames(ethnicity)[2:5]
round(tab, 1) Black Native American Asian
-35.1 -11.7 -29.8
Other
256.3 mosaicplot(t(mat.access.tab),xlab='',ylab='Access to Supply',
main="Mosaic Plot of Access",shade=TRUE,las=3,cex=0.8)5.7 Combining spatial datasets and their attributes
data(newhaven)
## define sample grid in polygons
bb <- bbox(tracts)
grd <- GridTopology(cellcentre.offset=
    c(bb[1,1]-200,bb[2,1]-200),
    cellsize=c(10000,10000),  cells.dim = c(5,5))
int.layer <- SpatialPolygonsDataFrame(
    as.SpatialPolygons.GridTopology(grd),
    data = data.frame(c(1:25)), match.ID = FALSE)
ct <- proj4string(blocks)
proj4string(int.layer) <- ct
proj4string(tracts) <- ct
names(int.layer) <- "ID"int.layer_sf <- st_as_sf(int.layer)
tracts_sf <- st_as_sf(tracts)
int.res_sf <- st_intersection(int.layer_sf, tracts_sf)# plot and label the zones
p1 <- tm_shape(int.layer_sf) + tm_borders(lty = 2) +
tm_layout(frame = F) +
tm_text("ID", size = 0.7) +
# plot the tracts
tm_shape(tracts_sf) + tm_borders(col = "red", lwd = 2)
# plot the intersection, scaled by int.later_sf
p2 <- tm_shape(int.layer_sf) + tm_borders(col="white") +
tm_shape(int.res_sf) + tm_polygons("HSE_UNITS", palette = blues9) +
tm_layout(frame = F, legend.show = F)
library(grid)
grid.newpage()
pushViewport(viewport(layout=grid.layout(1,2)))
print(p1, vp=viewport(layout.pos.col = 1))
print(p2, vp=viewport(layout.pos.col = 2))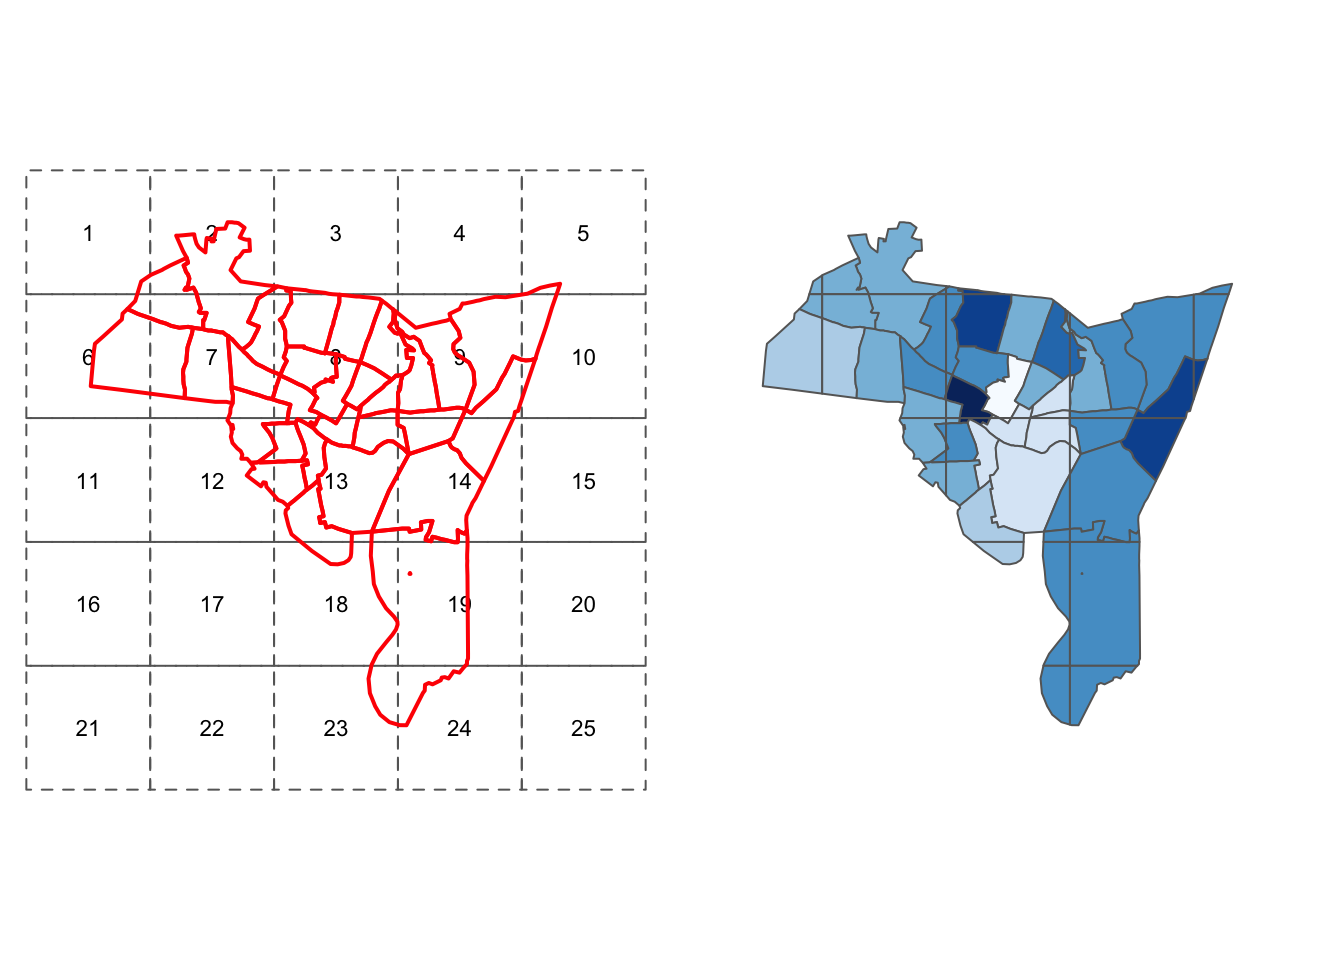
Figure 5.7: The zones and census tracts data before and after intersection
# generate area and proportions
int.areas <- st_area(int.res_sf)
tract.areas <- st_area(tracts_sf)
# match tract area to the new layer
index <- match(int.res_sf$T009075H_I, tracts$T009075H_I)
tract.areas <- tract.areas[index]
tract.prop <- as.vector(int.areas)/as.vector(tract.areas)library(tidyverse)
houses <- summarise(group_by(int.res_sf, ID), count = sum(houses))
# create an empty vector
int.layer_sf$houses <- 0
# and populate this using houses$ID as the index
int.layer_sf$houses[houses$ID] <- houses$counttm_shape(int.layer_sf) +
tm_polygons("houses", palette = "Greens",
style = "kmeans", title = "No. of houses") +
tm_layout(frame = F, legend.position = c(1,0.5)) +
tm_shape(tracts_sf) + tm_borders(col = "black")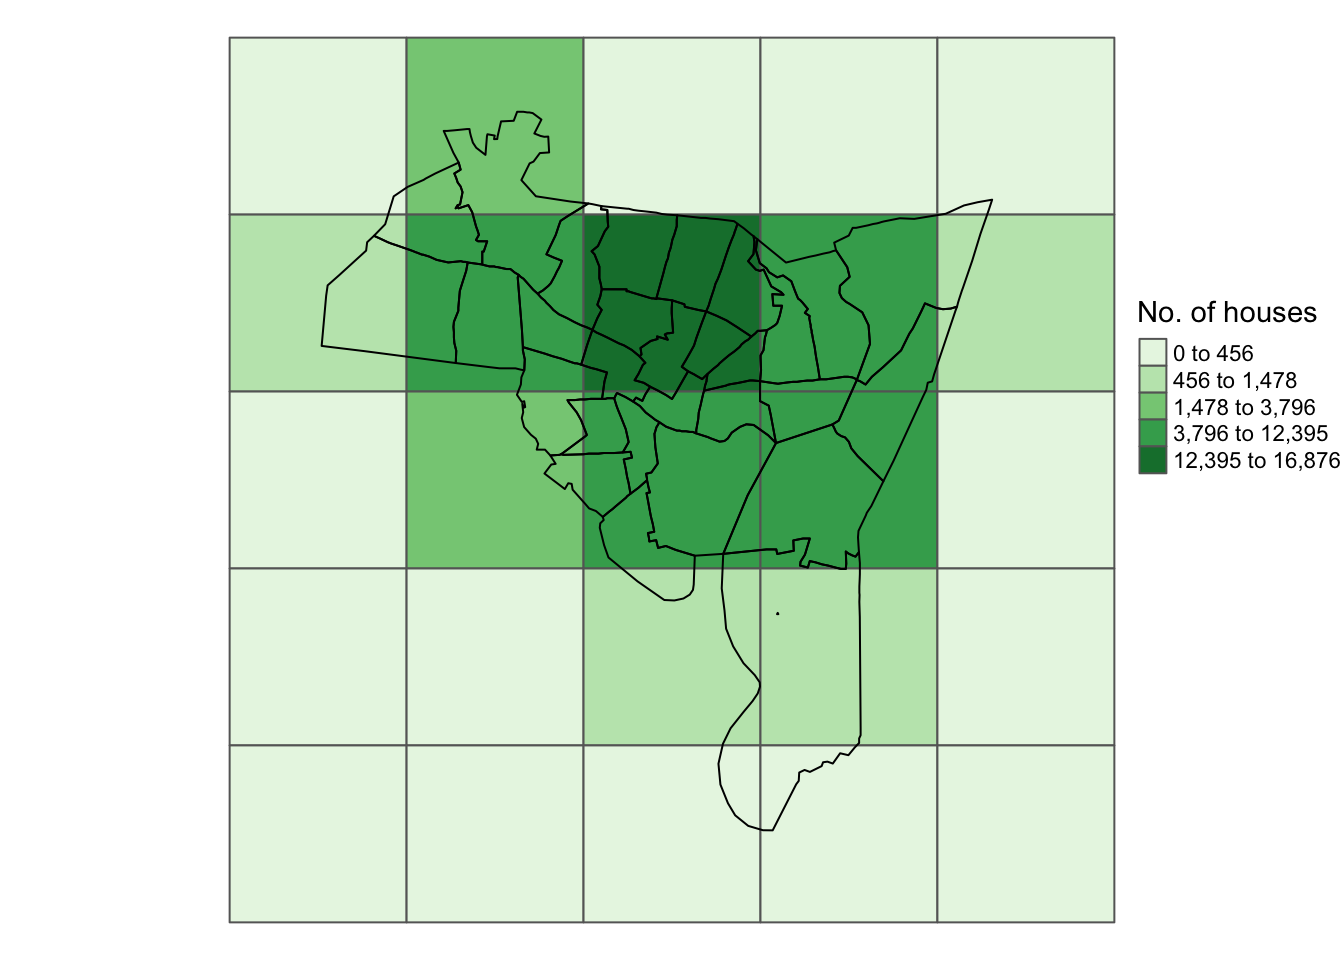
Figure 5.8: The zones shaded by the number of households after intersection with the census tracts
## in rgdal
library(rgdal)
ct <- proj4string(blocks)
proj4string(int.layer) <- CRS(ct)
blocks <- spTransform(blocks, CRS(proj4string(int.layer)))
## in sf
library(sf)
st_transform` (`sf`) functions to put the data into the same projection.
ct <- st_crs(blocks_sf)
st_crs(int.layer_sf) <- (ct)
blocks_sf <- st_transform(blocks_sf, st_crs(int.layer_sf))
# Use the IDs to assign ID variables to both inputs
# this makes the processing easier later on
int.ID <- "ID"
layer.ID <- "T009075H_I"
int_sf$IntID <- int_sf[,int.ID]
layer_sf$LayerID <- layer_sf[, layer.ID]
# do the same for the target.var
target.var <- HSE_UNITS
layer_sf$target.var <- layer_sf[, target.var]# directly from the data frame
as.vector(data.frame(int.res_sf[,"T009075H_I"])[,1])
as.vector(unlist(select(as.data.frame(int.res_sf), T009075H_I)))
# set the geometry to null and then extract
st_geometry(int.res_sf) <- NULL
int.res_sf[,"T009075H_I"]
# using select from dplyr
as.vector(unlist(select(as.data.frame(int.res_sf), T009075H_I)))5.8 Converting between Raster and Vector
5.8.1 Vector to Raster
5.8.1.1 Converting Points to Raster
# rasterize a point attribute
r <- raster(nrow = 180 , ncols = 360, ext = extent(us_states2))
r <- rasterize(torn2, r, field = "INJ", fun=sum)
# rasterize count of point dataset
r <- raster(nrow = 180 , ncols = 360, ext = extent(us_states2))
r <- rasterize(as(torn2, "SpatialPoints"), r,  fun=sum)
# set the plot extent by specify the plot colour 'white'
tm_shape(us_states2)+
tm_borders("white")+
tm_shape(r) +
tm_raster(title = "Injured", n= 7) +
tm_shape(us_states2) +
tm_borders() +
tm_layout(legend.position = c("left", "bottom"))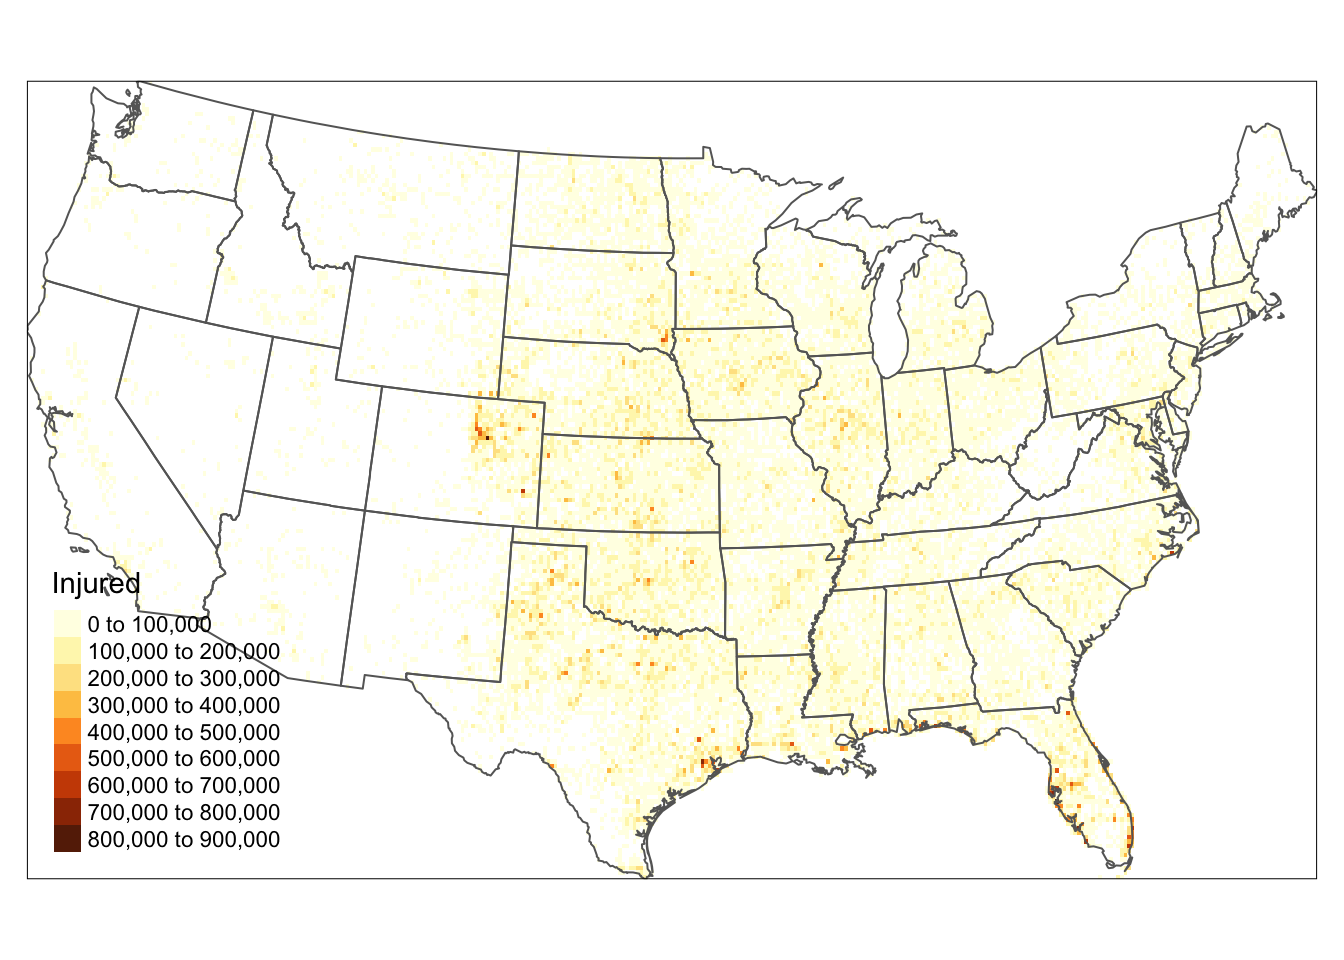
Figure 5.9: Converting Points to raster format.
5.8.1.2 Converting Lines to Raster
# Lines
us_outline <- as(us_states2 , "SpatialLinesDataFrame")
r <- raster(nrow = 180 , ncols = 360, ext = extent(us_states2))
r <- rasterize(us_outline , r, "AREA") tm_shape(r) +
tm_raster(title = "State Area", palette = "YlGn") +
tm_style_albatross() +
tm_layout(legend.position = c("left", "bottom"))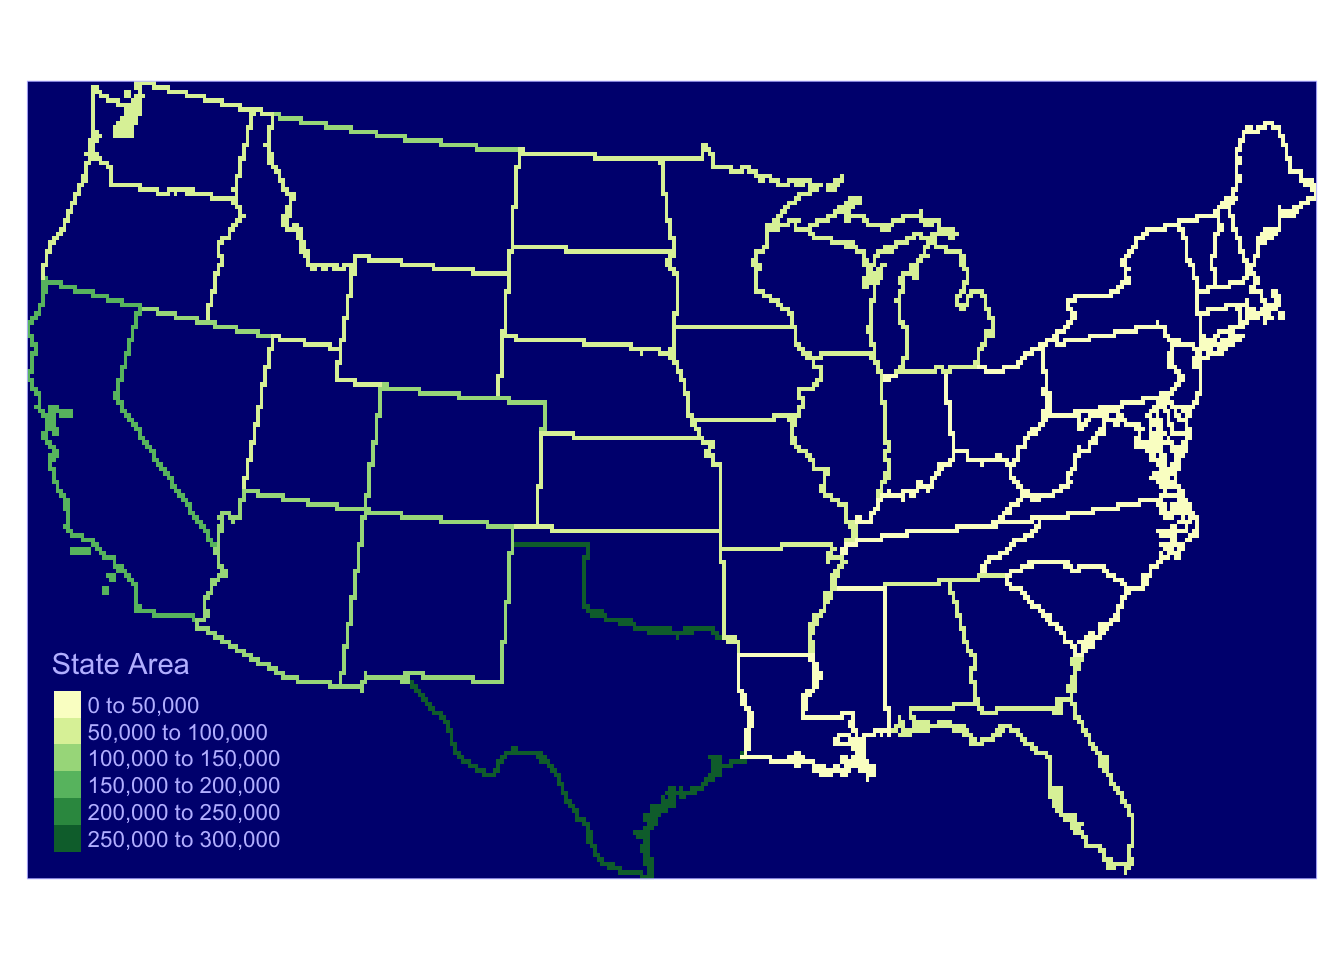
Figure 5.10: Converting Lines to raster format
5.8.1.3 Converting Polygons or Areas to Raster
# Polygons
r <- raster(nrow = 180 , ncols = 360, ext = extent(us_states2))
r <- rasterize(us_states2, r, "POP1997")
tm_shape(r) +
  tm_raster(title = "Population", n=7, style="kmeans", palette="OrRd") +
    tm_layout(legend.outside = T,
              legend.outside.position = c("left"),
              frame = F)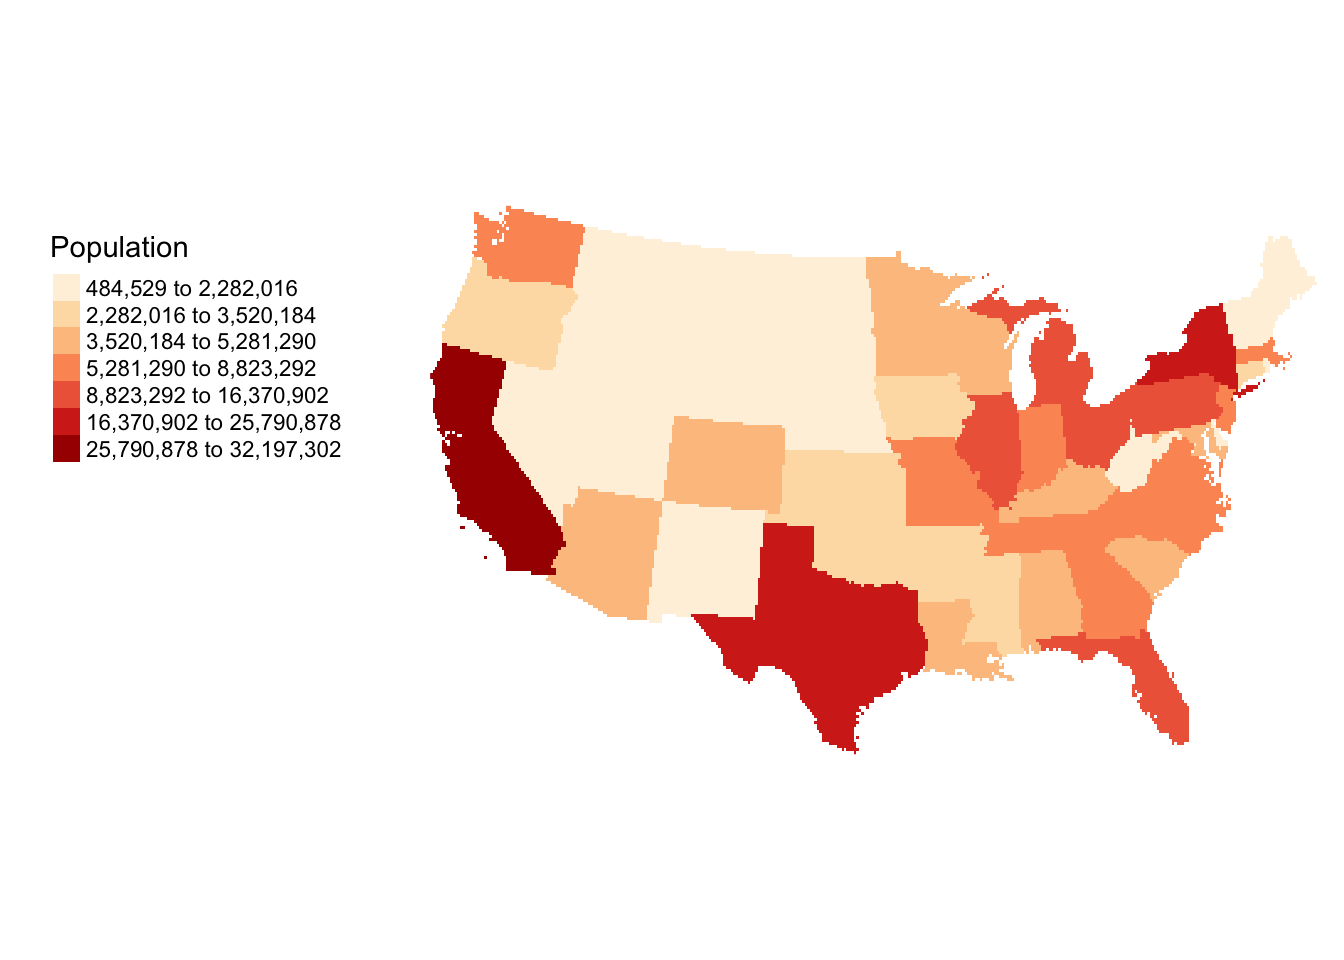
Figure 5.11: Converting Polygons to raster format.
# specify a cell size in the projection units
d <- 50000
dim.x <- d
dim.y <- d
bb <- bbox(us_states2)
# work out the number of cells needed
cells.x <- (bb[1,2]-bb[1,1]) / dim.x
cells.y <- (bb[2,2]-bb[2,1]) / dim.y
round.vals <- function(x){
    if(as.integer(x) < x) {
        x <- as.integer(x) + 1
    } else {x <- as.integer(x)
      }}
# the cells cover the data completely
cells.x <- round.vals(cells.x)
cells.y <- round.vals(cells.y)
# specify the raster extent
ext <- extent(c(bb[1,1], bb[1,1]+(cells.x*d),
    bb[2,1],bb[2,1]+(cells.y*d)))
# now run the raster conversion
r <- raster(ncol = cells.x,nrow =cells.y)
extent(r) <- ext
r <- rasterize(us_states2, r, "POP1997")
# and map
library(tmap)
tm_shape(r) +
  tm_raster(col = "layer", title = "Populations",
    palette = "Spectral", style = "kmeans") +
  tm_layout(frame = F, legend.show = T,
    legend.position = c("left","bottom"))
5.8.2 Converting to sp raster classes
r <- raster(nrow = 60 , ncols = 120, ext = extent(us_states2))
r <- rasterize(us_states2 , r, "BLACK")
g <- as(r, 'SpatialGridDataFrame')
p <- as(r, 'SpatialPixelsDataFrame')
# image(g, col = topo.colors(51))# set up and create the raster
r <- raster(nrow = 60 , ncols = 120, ext = extent(us_states2))
r <- rasterize(us_states2 , r, "POP1997")
r2 <- r
# subset the data
r2[r < 10000000] <- NA
g <- as(r2, 'SpatialGridDataFrame')
p <- as(r2, 'SpatialPixelsDataFrame')
# not run
# image(g, bg = "grey90")
tm_shape(r2) +
tm_raster(col = "layer", title = "Pop",
palette = "Reds", style = "cat") +
tm_layout(frame = F, legend.show = T,
legend.position = c("left","bottom")) +
tm_shape(us_states2) + tm_borders()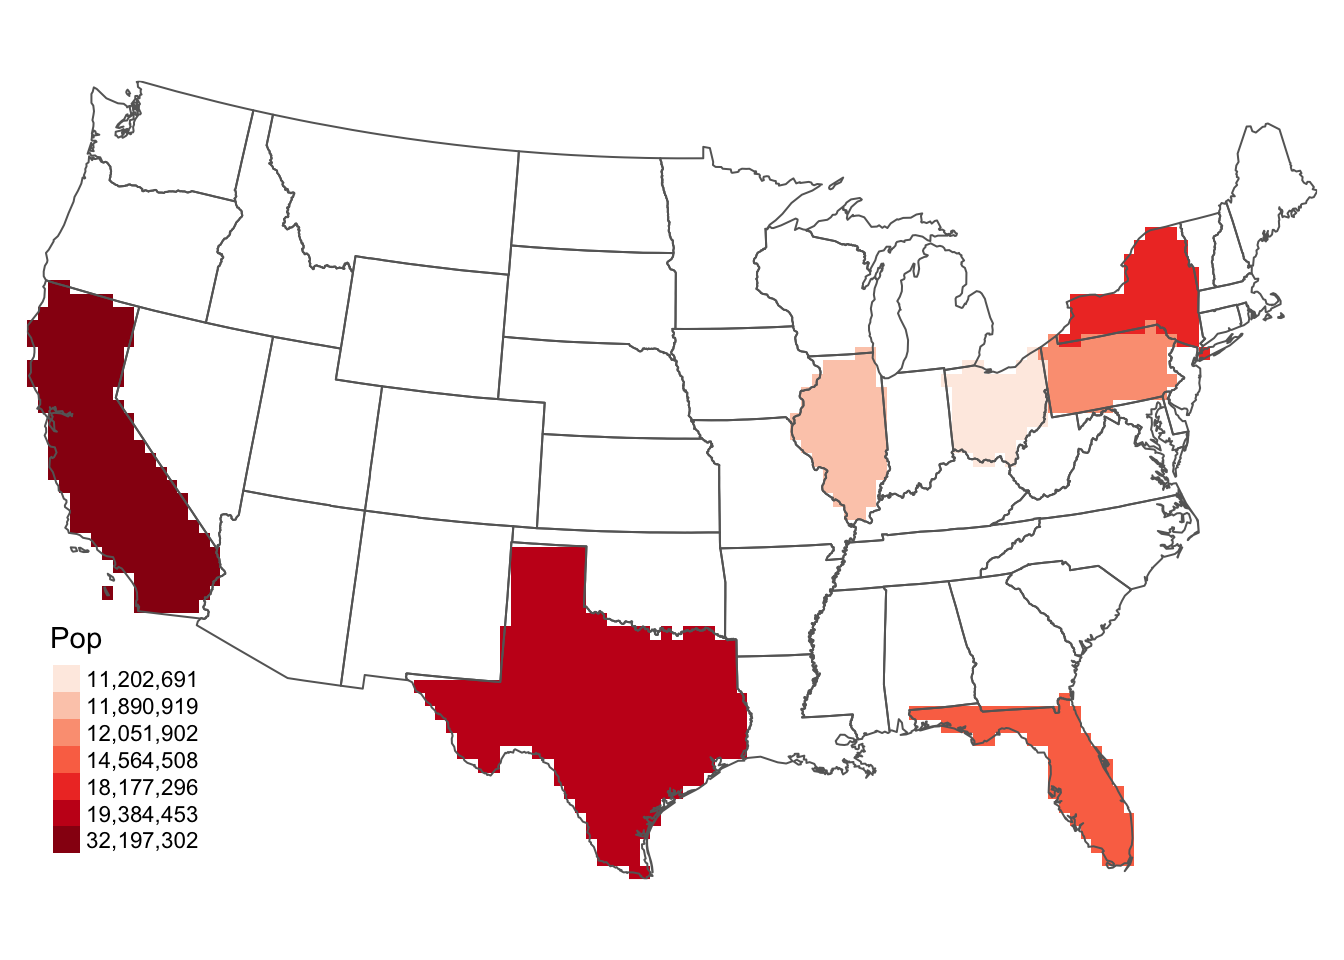
Figure 5.12: Selecting data in a raster object
5.8.2.1 Raster to Vector
# load the data and convert to raster
data(newhaven)
# set up the raster, r
r <- raster(nrow = 60 , ncols = 60, ext = extent(tracts))
# convert polygons to raster
r <- rasterize(tracts , r, "VACANT")
poly1 <- rasterToPolygons(r, dissolve = T)
# convert to points
points1 <- rasterToPoints(r)
# plot the points, rasterized polygons & orginal polygons
par(mar=c(0,0,0,0))
plot(points1, col = "grey", axes = FALSE, xaxt='n', ann=FALSE, asp= 1)
plot(poly1, lwd = 1.5, add = T)
plot(tracts, border = "red", add = T)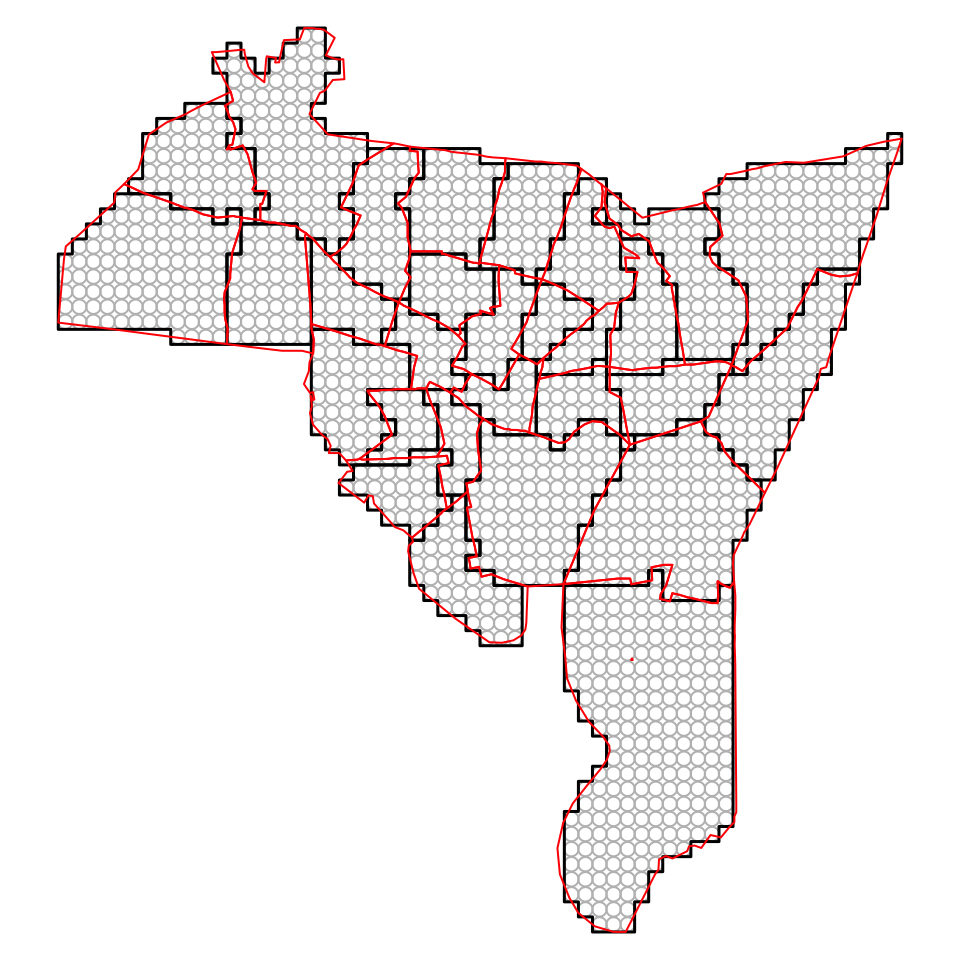
Figure 5.13: Converting from Rasters to Polygons and Points, with the original polygon data in red
# first convert the point matrix to sp format
points1.sp <- SpatialPointsDataFrame(points1[,1:2],
    data = data.frame(points1[,3]))
# then pplot
tm_shape(poly1) + tm_borders(col = "black") +
  tm_shape(tracts) + tm_borders(col = "red") +
  tm_shape(points1.sp) + tm_dots(col = "grey", shape = 1) +
  tm_layout(frame = F)
5.9 Introduction to Raster Analysis
5.9.1 Raster Data Preparation
library(GISTools)
library(raster)
library(sp)
# load the meuse.grid data
data(meuse.grid)
# create a SpatialPixels DF object
coordinates(meuse.grid) <- ~x+y
proj4string(meuse.grid) <- CRS("+init=epsg:28992")
meuse.grid <- as(meuse.grid, "SpatialPixelsDataFrame")
# create 3 raster layers
r1 <- raster(meuse.grid, layer = 3) #dist
r2 <- raster(meuse.grid, layer = 4) #soil
r3 <- raster(meuse.grid, layer = 5) #ffreq5.9.2 Raster Reclassification
 11  12  13  21  22  23  31  32  33
535 242 2 736 450 149 394 392 203 tm_shape(Raster_Result) + tm_raster(col = "layer", title = "Values",
palette = "Spectral", style = "cat") +
tm_layout(frame = F)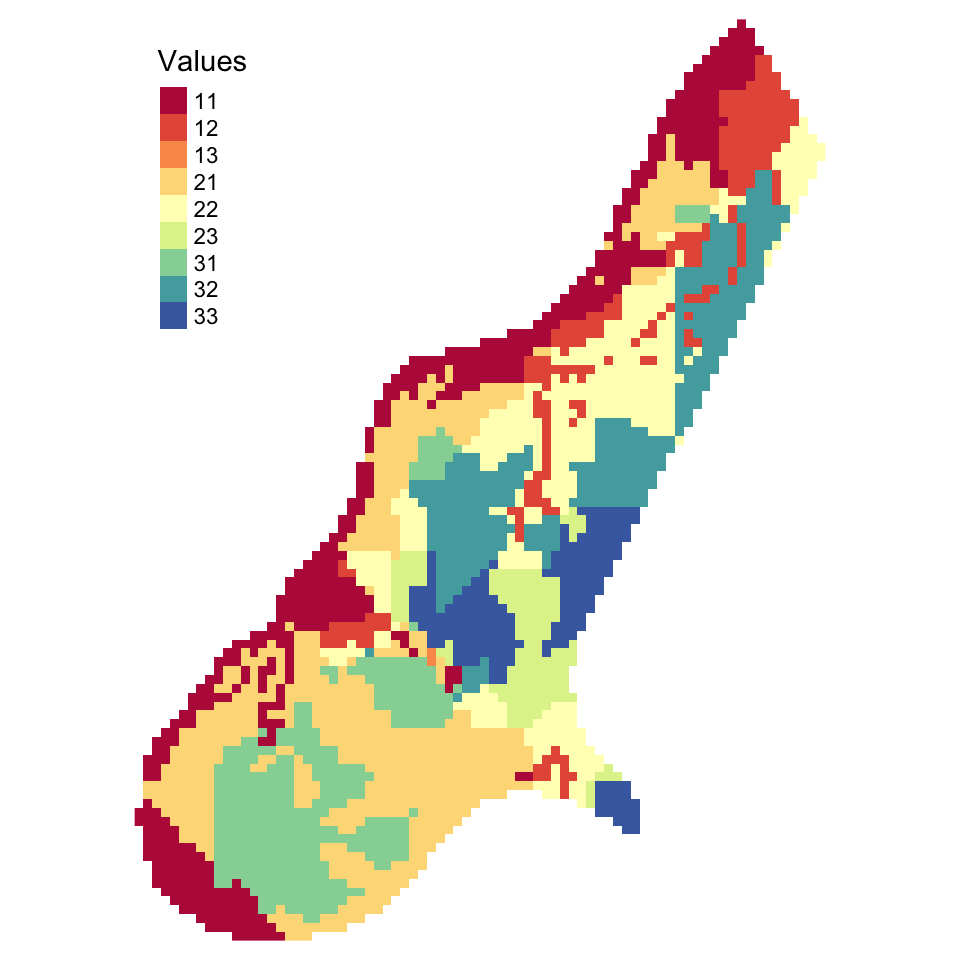
Figure 5.14: The result of a simple raster overlay
   0    1
2924 179 tm_shape(Raster_Result) +
tm_raster(col = "layer", title = "Values", style = "cat") +
tm_style_cobalt()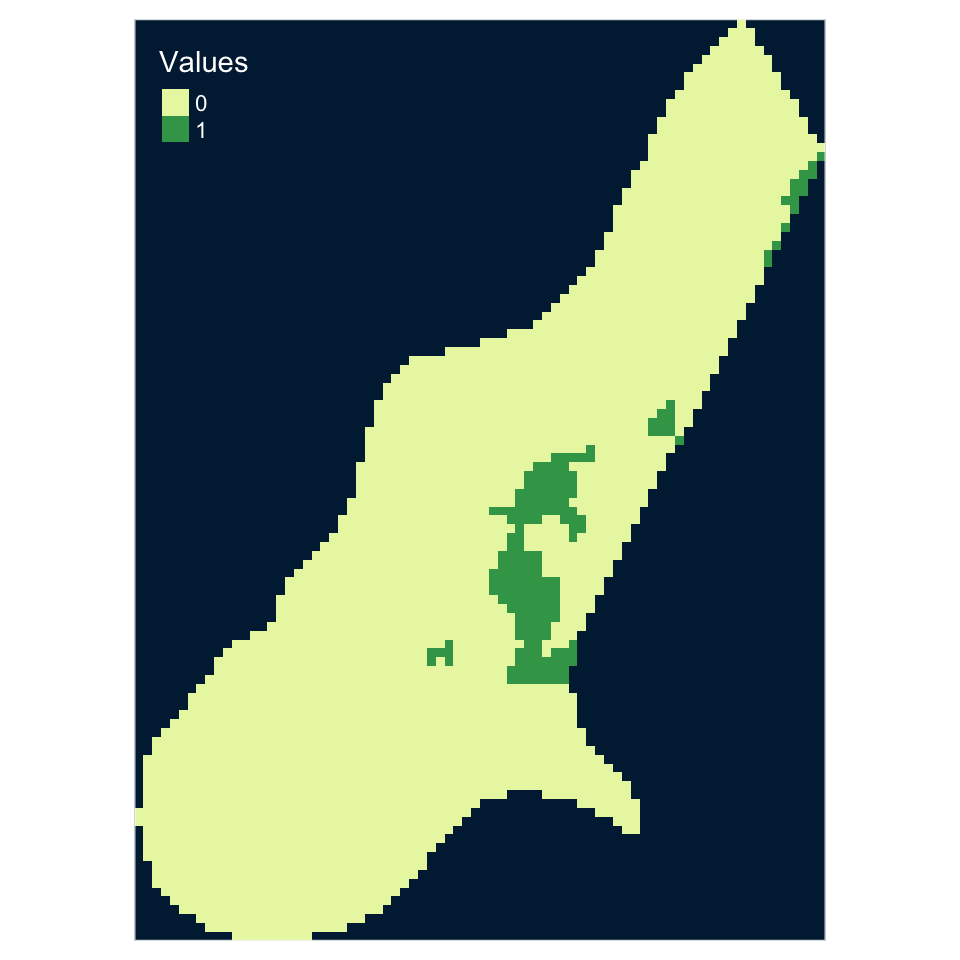
Figure 5.15: A raster overlay using a combinatorial AND
   0    1    2    3
 386 1526 1012  179
# plot the result and add a legend
tm_shape(Raster_Result) + tm_raster(col="layer",title ="Conditions", style = "cat") +
#tm_layout(frame = F, bg.color = "grey85")
tm_style_col_blind()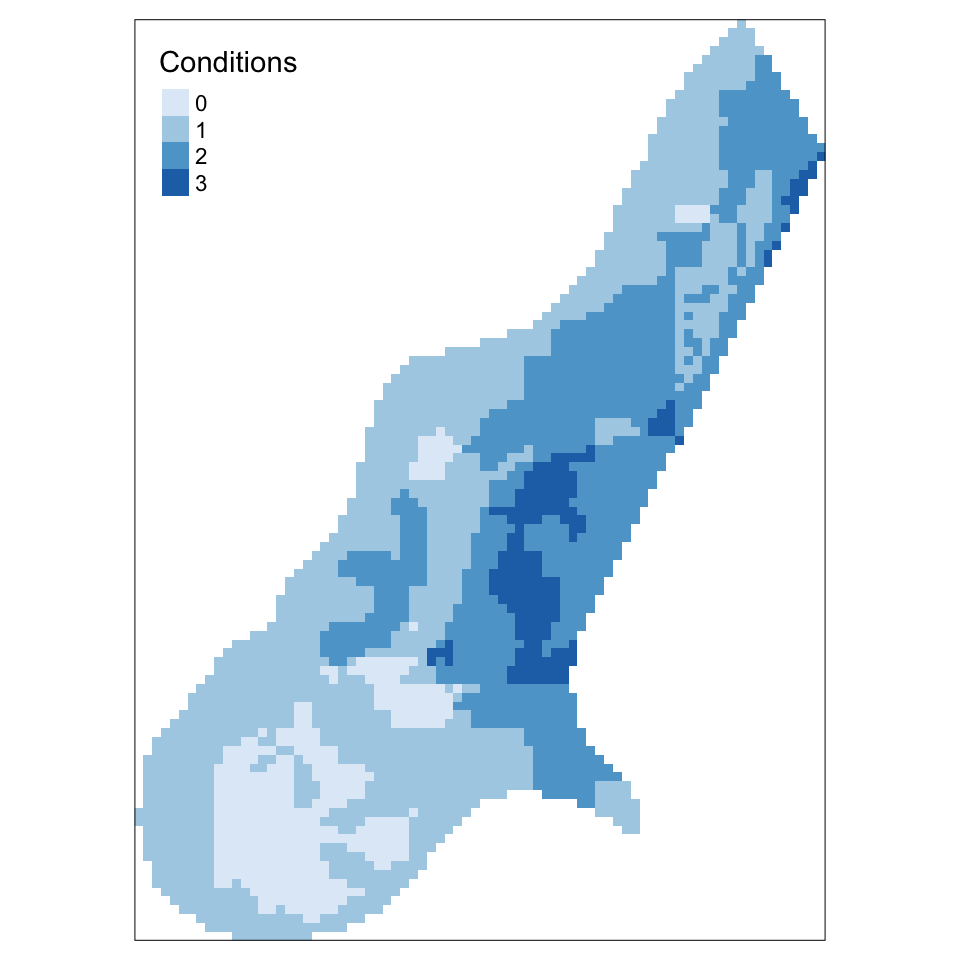
Figure 5.16: A raster overlay using a combinatorial OR
5.9.3 Other Raster Calculations
Raster_Result <- sin(r3) + sqrt(r1)
Raster_Result <- ((r1 * 1000 ) / log(r3) ) * r2
tmap_mode('view')
tm_shape(Raster_Result) + tm_raster(col = "layer", title = "Value")my.func <- function(x) {log(x)}
Raster_Result <- calc(r3, my.func)
# this is equivalent to
Raster_Result <- calc(r3, log) Raster_Result <- overlay(r2,r3,
fun = function(x, y) {return(x + (y * 10))} )
# alternatively using a stack
my.stack <- stack(r2, r3)
Raster_Result <- overlay(my.stack, fun = function(x, y) (x + (y * 10)) )# load meuse and convert to points
data(meuse)
coordinates(meuse) <- ~x+y
# select a point layer
soil.1 <- meuse[meuse$soil == 1,]
# create an empty raster layer
# this is based on the extent of meuse
r <- raster(meuse.grid)
dist <- distanceFromPoints(r, soil.1)
plot(dist,asp = 1,
xlab='',ylab='',xaxt='n',yaxt='n',bty='n', axes =F)
plot(soil.1, add = T)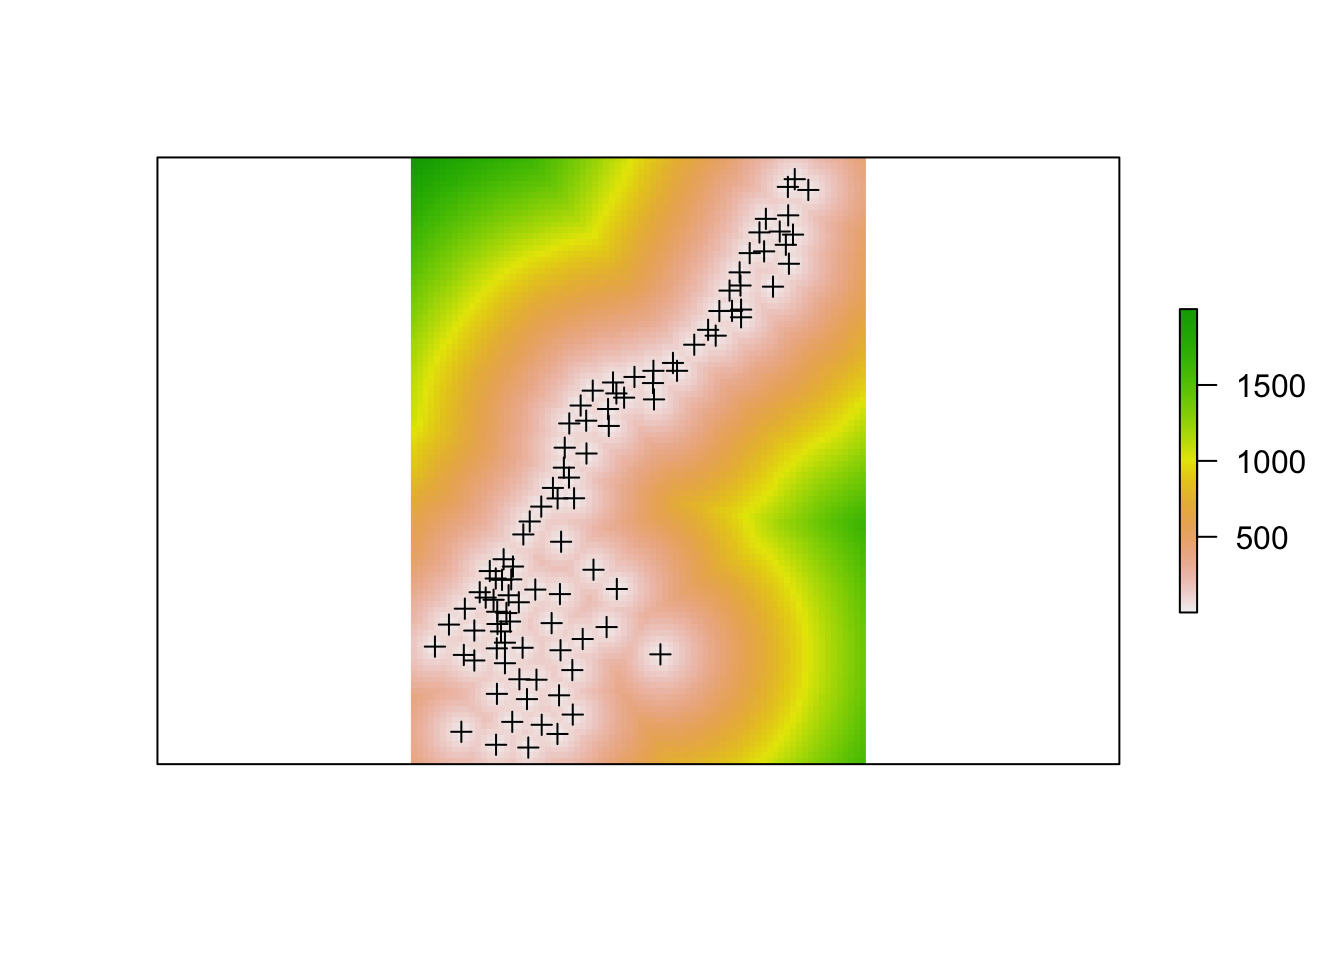
Figure 5.17: A raster analysis of distance to points
5.10 Answers to self-test questions
Q1
First, using sf formats:
# convert to sf
breach_sf <- st_as_sf(breach)
blocks_sf <- st_as_sf(blocks)
# point in polygon
b.count <-  rowSums(st_contains(blocks_sf,breach_sf,sparse = F))
# area calulation
b.area <- ft2miles(ft2miles(st_area(blocks_sf)))   * 2.58999
# combine and assign to the blocks data
blocks_sf$b.p.sqkm <- as.vector(b.count/b.area)
# map
tm_shape(blocks_sf) +
  tm_polygons("b.p.sqkm", style = "kmeans", title ="")
Second, using sp formats:
# point in polygon
b.count <-  poly.counts(breach, blocks)
# area calulation
b.area <- ft2miles(ft2miles(gArea(blocks, byid = T)))   * 2.58999
# combine and assign to the blocks data
blocks$b.p.sqkm <- b.count/b.area
tm_shape(blocks) +
  tm_polygons("b.p.sqkm", style = "kmeans", title ="")
Q2
blocks$s.resids.2 <- s.resids.2
tm_shape(blocks) +
  tm_polygons("s.resids.2", breaks = c(-8,-2,2,8),
    auto.palette.mapping = F,
    palette = resid.shades$cols)
Q3
# Analysis with blocks
blocks2 = blocks[blocks$OCCUPIED > 0,]
attach(data.frame(blocks2))
forced.rate = 2000*poly.counts(burgres.f,blocks2)/OCCUPIED
notforced.rate = 2000*poly.counts(burgres.n,blocks2)/OCCUPIED
model1 = lm(forced.rate~notforced.rate)
coef(model1)
(Intercept) notforced.rate
5.4667222 0.3789628 # from the model
coef(model1)
# or in a formatted statement
cat("expected(forced rate)=",coef(model1)[1], "+",
coef(model1)[2], "* (not forced rate)")# Analysis with tracts
tracts2 = tracts[tracts$OCCUPIED > 0,]
# align the projections
ct <- proj4string(burgres.f)
proj4string(tracts2) <- CRS(ct)
# now do the analysis
attach(data.frame(tracts2))
forced.rate = 2000*poly.counts(burgres.f,tracts2)/OCCUPIED
notforced.rate = 2000*poly.counts(burgres.n,tracts2)/OCCUPIED
model2 = lm(forced.rate~notforced.rate)
detach(data.frame(tracts2))# from the model
coef(model2)
# or in a formatted statement
cat("expected(forced rate) = ",coef(model2)[1], "+",
coef(model2)[2], "* (not forced rate)")cat("expected(forced rate) = ",coef(model1)[1], "+",
coef(model1)[2], "* (not forced rate)")
cat("expected(forced rate) = ",coef(model2)[1], "+",
coef(model2)[2], "* (not forced rate)")expected(forced rate) = 5.466722 + 0.3789628 * (not forced rate)expected(forced rate) = 5.243477 + 0.4132951 * (not forced rate)Q4
int.count.function <- function(
  int_sf, layer_sf, int.ID, layer.ID, target.var) {
  # Use the IDs to assign ID variables to both inputs
  # this makes the processing easier later on
  int_sf$IntID <- as.vector(data.frame(int_sf[, int.ID])[,1])
  layer_sf$LayerID <- as.vector(data.frame(layer_sf[, layer.ID])[,1])
  # do the same for the target.var
  layer_sf$target.var <-as.vector(data.frame(layer_sf[, target.var])[,1])
  # check projections
  if(st_crs(int_sf) != st_crs(layer_sf))
    print("Check Projections!!!")
  # do intersection
  int.res_sf <- st_intersection(int_sf, layer_sf)
  # generate area and proportions
  int.areas <- st_area(int.res_sf)
  layer.areas <- st_area(layer_sf)
  # match tract area to the new layer
  v1 <- as.vector(data.frame(int.res_sf$LayerID)[,1])
  v2 <- as.vector(data.frame(layer_sf$LayerID)[,1])
  index <- match(v1, v2)
  layer.areas <- layer.areas[index]
  layer.prop <- as.vector(int.areas/as.vector(layer.areas))
  # create a variable of intersected values
  int.res_sf$NewVar <-
    as.vector(data.frame(layer_sf$target.var)[,1][index]) * layer.prop
  # sumamrise this and link back to the int.layer_sf
  NewVar <- summarise(group_by(int.res_sf, IntID), count = sum(NewVar))
  # create an empty vector
  int.layer_sf$NewVar <- 0
  # and populate this using ID as the index
  int.layer_sf$NewVar[NewVar$IntID] <- NewVar$count
  return(int.layer_sf)
}