Chapter 3 Summer Educator Workshop
The Sci-I Project each year kicked off with a one-week workshop for all participating teachers that we held during the summer prior to the project year.
3.1 Preparation & Logistics for Workshop
In preparation for the workshop each summer, we reviewed feedback from the previous year’s workshop, revisited the project objectives and desired outcomes, and reviewed the pre-workshop survey results from the incoming cohort. We used this information to tweak and finalize the agenda (for details of the agenda see the Workshop Schedule & Daily Goals section). As we finalized the agenda, we organized field trips and scientist visits (more details below) as well as determined the staffing needs to run the workshop. We typically found that two full-time facilitators was helpful to conduct the workshop. Also during the Summer 2017 workshop we asked 1-2 co-lead educators (or master peer lead educators), who successfully participated in a prior cohort, to co-facilitate the workshop with members of the Sci-I Project team.
Another aspect of workshop preparation that we focused on ahead of time was lining up the necessary travel, accommodations, meeting locations, and food requirements for the group (Table 2). We found it easiest for participants to book their own travel and then to collect their travel details ahead of the workshop in order to facilitate ride sharing among the participants. Each year we provided on-site (or as close as possible) overnight accommodations for those traveling more than an hour to reach the workshop location. Again we found it easiest to pay for these accommodations directly out of the project budget, rather than having the participants pay for the accommodations pay out of pocket. Because we paid for the accommodations we made sure to provide the participants the information that they needed in order to check-in to their accommodations.
Table 1. Breakdown of budgetary aspects of workshop components for roughly 20 participating teachers and 2-3 staff members.
| Component | Range |
|---|---|
| Travel (air, mileage, etc.) of participants and staff | $10,000-15,000 |
| Hotel accommodations of participants and staff | $5,000-7,500 |
| Room rental for the workshop | $2,000-3,000 |
| Food for participants and staff | $3,000-7,500 |
| Workshop materials | $500-1,000 |
3.2 Logistics
We prioritized finding a workshop facility that could accommodate a range of activities during the workshop (ideally all in one building) and had on-site parking. We used a classroom that could comfortably fit 25 people in various table arrangements including for multiple small group pods. Ideally there was a lobby or additional classroom close by that we could use for Gallery Walks and breakout sessions. A small conference room or dining area to stage buffets for the meals as well as areas to enjoy the meals was very helpful to not disrupt the flow of the workshop as caterers were setting up or breaking down meals. Finally, we used a large space (often outdoors) to conduct some of the team building initiatives of the workshop.
Each year we worked with our local partners to find reliable high-quality caterers to provide 2 meals (breakfast and lunch) and 2 break snacks per day during the workshop. Also, we provided dinner on the first and third evenings of the workshop to foster community building among the participating teachers. Through these meals and snacks we prioritized providing a range of healthy and varied food items during the week to keep participants happy and focused on the work at hand. The vareity was appreciated by many.
A final logistical component in preparing for the workshop was acquiring the range of both consumable supplies (e.g., large sticky flip chart paper, post-it notes) and re-usable materials (hula hoops and markers) that we used during the workshop. We printed or acquired the following hard copy materials of the following items for each participating teacher at the workshop:
- 1 inch binder side labels (June 2017 version)
- Binder cover sheets (June 2017 version)
- Divider labels
- Name tags (only used on Sunday and Monday of workshop)
- Ice breaker write-ups for facilitator (June 2017 version)
- Group initiative write-ups for facilitator (June 2017 version)
- Copies of all quotes and Purchase Orders for food and room space
- Hotel room lists (who was assigned to which room)
- Sign in sheet for each day (to track attendance for grant reporting purposes June 2017 version)
- Photo release form (needed to be completed by each participant based on our home University requirements)
- Daily Feedback Forms (to receive feedback in the moment to adjust the approach and agenda going forward to best meet the needs of the cohort)
- Staff agendas (printed each day following the post day staff debrief and review of the Daily Feedback Forms; June 2017 pre-workshop version)
We also tried to provide reference books for the educators as additional resources. We year we tried to provide 1-3 data literacy / process of science focused resources that teachers would potentially find to be helpful in implementing the project and beyond in their classrooms. During the 2017-18 implementation we provided each school a copy of:
- The Basics of Data Literacy: Helping Your Students (and You!) Make Sense of Data by: Michael Bowen and Anthony Bartley (2013, NSTA Press)
- STEM Student Research Handbook by: Darci J. Harland (2011, NSTA Press).
Just prior to the workshop, we finalized the documents pertaining to the logistical, pedagogical, and practical resources for completing the project. Printed, copied, and compiled everything into binders for each educator. The materials we provided in the 2017-18 implementation teacher binders included (copies of each can be found through the category links):
- Logistics:
- Teacher agenda
- List of participants
- Who we are (Sci-I Project staff)
- Pre-workshop information
- Overview of Palmer Research Station LTER (PAL-LTER) project
- NGSS Science & Engineering Practices Write-Ups
- Testable Questions:
- Starts of Science Investigation Questions
- Science Investigation Examples Broad and Testable Question
- Characteristics of Testable Questions
- Finding Data:
- Accessing PAL-LTER Datazoo instructions
- Cheat Sheet for PAL-LTER data sets
- PAL-LTER Data Files Summary
- List of other polar science data portals
- Making Sense of Data:
- Open-ended science investigation checklist
- Step by step guide to using Excel
- How to draw in Google Sheets
- Tips for making graphs easy to read
- Communication:
- Request for Proposal for student mini-proposals
- Mini-proposal guideline document
- Mini-proposal feedback form
- Student science investigations write up
- Scientific poster resources
- Investigation rubric
- Discussion maps
- Investigation discussion reflection
- Project Components:
- Work components and expectations
- SPRS dates and background
- SPRS sample agenda and layout
- The learning cycle (2016)
- UC Berkeley how science works
- Three levels of engagement
- Evaluation:
- Evaluation plan
- FAQs for pre-surveys
- Note pages
As a note, some of these resources were handed out during the session on an as needed basis, rather than placing them in the educator binders before the start of the week.
3.3 Approach to Educator Workshop - Desired Outcomes & Strategy of Agenda
This project was designed to support the Next Generation Science Standards (NGSS) science education reform efforts, especially around the integration of the Science and Engineering Practices into classroom instruction.
A goal was to change students’ perception of scientists and how they viewed a scientific career. Focus was on breaking down the stigma of what a traditional scientist is and provide an environment where students were able to place themselves in the shoes of a researcher and conduct their own investigative projects. By doing so, the students were able to directly experience what it was like to participate in a project by obtaining, analyzing, and interpreting data. This helped to introduce the diversity of scientific fields as well as the roles (e.g., field technician, laboratory manager, student mentor, principle investigator) that a scientist fills in their profession.
One intended outcome of the Sci-I project was to underscore for students the nonlinear characteristics and cyclical nature of the scientific method based off of the How Science Really Works flowchart. Instead, we worked to present science as a process that continually moves between researching previous literature, testing ideas, analyzing results, and drawing conclusions or understanding of the implications of the work. A goal was to sharpen students’ critical thinking, collaboration, problem solving, and communication skills. We thus based the agenda and approach to the workshop around these intended outcomes and goals.
3.4 Work with Scientists
Local scientists and graduate students were a invaluable resource during the workshop as they shared their real world experiences of the scientific process. Having scientist-educator partnership provided synergistic relationships that were win-wins for all involved. The scientists provided unique insights into the true nature and process of science while the educators provided scientists with insight on how they can improve their communication of the societal benefits of their research and better connect in their communities. We felt that fostering opportunities for two way dialogue was critical to helping with the the long-term success of scientists as they build the required broader impact potential of their work.
One of the ways that we facilitated such communications between scientists and educators at the workshop was by hosting scientist panels. Scientists were asked to prepare a short presentation (at most 2 slides to share over 3 minutes) in which they succinctly explained their process of doing science and how the processes discussed in the workshop applied to their research (data management, figure development, etc.). Furthermore, we hoped that including scientists in the workshop would create opportunities for relationships with the teachers so that local scientists could visit their classrooms (if desired), providing opportunities for students to interact directly with scientists in their community.
Note - some scientists may love to talk about their research and could easily turn a three-minute talk into a 10-minute talk! It was useful to have a panel of scientists that specialized in different areas (both in research topics and techniques) to provide a larger variety of experiences to bring to the workshop and create stronger boundaries on the time asks. We wanted to prioritizing share about the process of science and providing opportunities for the teachers to ask questions.
Recognizing that everyone has busy schedules, we tried to first contact collaborating scientists for these panels at least 1-2 months in advance of the workshop to provide them enough time to commit to assisting with the workshop. A description of the workshop and asks for the scientists participating in the 2017 Teacher Workshop can be found here. We shared a version of this with all of the scientists ahead of the workshop to help provide them with a better sense of the project overall, the goals of the workshop, what we were hoping they would add to the workshop, and how their session fit into the broader picture.
3.5 Workshop Schedule & Daily Goals
The workshop was spread across five work days, each focusing on a different part of the year-long project (this schedule can be easily adapted to fit the needs of your educators and/or project). Throughout the workshop we found it especially important to promote active teaching and learning strategies to create an interactive learning environment and facilitate cohort bonding between the educators and scientists.
Below is a description of each day of the workshop as well as the power point slide materials from each day and links to specific activities that we developed and used during the 2017 workshop. Again in 2017 our content focus was polar regions, but the materials can be easily adatped to any content area.
3.5.1 Day 1 - Slidedeck & Agenda
The first day of the program was designed to be a half-day (4 hours) to allow for travel to the site. Agenda items included: introductions, both of participants/staff and of the Polar-ICE program itself, review of the goals of the Polar-ICE project, and brainstorming time for the educators to start thinking about topics for their investigation.
We used an interactive activity to quickly break the ice and start building peer relationships within the cohort. We spent about 30 minutes in different activities for introductions and icebreakers. These activities helped to release some of the tension of being in a new place with new people and helped create a fun learning atmosphere for those attending. The Sci-I Project 2017 Educator Workshop - Introductions & Simply Paper outlines the activities we used.
Information on the goals and objectives of Sci-I Project can be found at the beginning of this document in the [What Did the Sci-I Project Focus On?] section. The educators had already been introduced to some of this information during the selection process, however we used time during the first day to link how the goals and agenda were tied together. Finally, the educators formed their small groups and began to brainstorm research topics to explore during the workshop. We focused on polar data ranging from temperature, bacterial abundance, phytoplankton assemblage, to penguin census data during the 2017 workshop. You are welcome to continue the polar theme for the project or choose something more related to the ecosystem in your own backyard or other non-ecological datasets.
3.5.2 Day 2 - Slidedeck & Agenda
In the second day of the workshop we began to introduce the idea of the scientific method being a process rather than the more simplistic, linear scientific method of:
- ask a question,
- form a hypothesis,
- run an experiment,
- observe and record results,
- interpret findings, and
- share the discovery. While this method shows the basics, it can create misconceptions for students. Instead we wanted to realistically illustrate science being a process that feeds back in on itself for students within the project.
We also introduced the educators to the study site where the data were collected. For our implementation we focused on polar data, and more specifically, data collected from the Palmer Long Term Ecological Research project at Palmer Research Station on the Western Antarctic Peninsula. We provided information about the study site early on in the workshop to help make the data more relevant to the participants by connecting the data with the ecosystem to investigate. The introduction to the study area also helped to make connections between the different datasets that could be investigated to make it easier for educators to choose their research topics.
After the educators chose what topics they wanted to investigate during the workshop, we discussed how to authenticate data to ensure that the data being used was reliable. We created an Accessing & Using Data – Activity to help with explaining the topic. We first presented the educators with a data table and used it to help orient them to how data tables are organized. While this may seem like a remedial task, we found that not all of our participating educators had thought much explicitly about all the parts of a data table or how to help their students orient to a data table, including the metadata (data about the data). One important piece of information that we wanted to convey was that many of online datasets to use in the investigative process contain copious amounts of data, and not all of it will be needed to answer their research question.
After the educators were comfortable with looking at datasets and determining which information they would need for their research questions, we explored the Request for Proposals and the Mini-Proposal Guidelines to review what information they were expected to provide along with the general timeline and plan for the duration of their work on this during the workshop. (As a note, the Request for Proposals can easily be edited to fit your location, institution, and participating schools.) Before the lunch break we conveyed our first scientist panel, providing a break from working with data and a chance for the scientists to share the work that they do and how they develop their questions and find appropriate data. We always planned for a break to follow the panel to allow for the educators to approach the scientists with additional questions following the panel as well as invited the scientists to stay for snack or lunch to continue their interactions with the educators.
After the lunch break, educators began to brainstorm potential testable questions for the topic areas of their choice. We reviewed “SMART (Specific, Measurable, Achievable, Relevant, and Temporal) questions” and then had the educators develop their own SMART questions. After each group had their question, we used the Refining Questions – Activity in conjunction with the Revising Science Investigation Questions Activity to help narrow the teachers questions down to a more specific question that could be tested with the data they had available during the workshop.
We spent the rest of the afternoon doing a small group challenge scavenger hunt. This got us all up and moving as well as a chance to get to know one another in a fun and relaxing setting. Each group competitively acquired pictures from as many locations along the scavenger hunt as possible. Each group set about the task differently which provided a useful metaphor and reflection point about how we work with and make sense of data. Just like there was not one way to complete the scavenger hunt, there was no one correct way to work with a dataset. A copy of the June 2017 Scavenger Hunt can be found here.
3.5.3 Day 3 - Slidedeck & Agenda
Educators exchanged their questions and provided peer feedback to assist in reframing and narrowing down their testable questions. The goal was to make the questions specific enough so that they qualified as ‘testable questions’. We then had the educators use the testable question activity to review and edit past student questions. Educators put on their ‘student hats’ to help get in the mindset of how their students would see the questions and how they as educators could provide feedback to their students. Educators provided a review using the SMART guidelines to the sample student questions and suggested how the questions could be improved. We went through a couple iterations of this, making sure that each of the questions included the topic of the study (specifically which variable(s)), the location that was being studied, and the timeframe of the data being looked at).
After everyone was more confident on refining their testable questions we began discussing how they could access data that would help them to answer their questions. We started off with the thinking about data activity to show how different datasets are collected, and how the collection of the data and the kinds of data influence the kinds of questions that you can ask from the data. During the activity, the educators were asked how they thought the data were collected, based on the data tables, and sketched out sampling plans based on their inferences. The sketches were then hung up on the walls for a ‘gallery walk’ and the sampling plans were compared between the different groups. This enabled us to dive deeper into thinking about how what kinds of questions you can ask and how the answers are going to be influenced by how the data were collected and what data you have.
The next step was to introduce the participating educators to data repositories that they could use to procure datasets for their investigations. Since our iteration of the project focused on polar data, we used the Palmer LTER data repository Datazoo. We explained how the repository worked and provided examples on how to search through the available data to find datasets that would be relevant to their questions using the Datazoo example document. We also provided examples on how to search for data in other repositories related to polar data. The educators were then given time to explore the repositories and find datasets that they could use to answer the testable questions they had previously developed.
To reduce data fatigue and try to hold off too much data frustration, we provided an opportunity to use our minds and bodies in a different way in the middle of sorting through data. We have found that group team building exercises provide a great way to continue to build a community of practice, and also provide good conversation starters about how to help facilitate our students in group work and through frustrations. Descriptions of the group initiatives that we used in June 2017 can be accessed here.
For the final part of the day we had the educators write out a Mini-Proposal for their workshop investigation. We provided a template for them to follow that had directions on what we wanted to see in each part of the proposal. This enabled them to experience the process of taking an idea, refining the question to be testable, finding an available dataset to use, and to articulate their plan for the investigation.
3.5.4 Day 4 - Slidedeck & Agenda
We started the fourth day with the nonsense data activity (originally developed by Kate Florio while at the Liberty Science Center). In this activity the educators worked in groups and were assigned a dataset that they then used to answer two different sets of questions. The goal of this activity is to demonstrate that it can be easy to answer questions about what is on data visualizations, like a graph, without understanding the data itself. However, it is much more difficult to synthesize information and make large scale interpretations from the data when you don’t understand it or have the context for the data. Following this activity, we brainstormed what that meant for how we could help our students make sense of data through this project and beyond.
During the next activity we reviewed the 3 Levels of Engagement handout that presented the educators with a line graph and went over how to scaffold students understanding and analysis of the figure (adapted from Hotaling et al. 2019). We found that this can be a useful teaching tool for helping students who are not used to figures learn how to orient themselves to the figure and begin to understand information on the graph. Additionally, it shows how to extrapolate information that is not on the page to gain a deeper understanding of the data that is presented.
We then discussed the process in which professional science figures are produced by providing an example of how a figure often evolves from a simple graph to see what data are there into a complex graph to tell the story from the data. We used the Evolution of a Data Figure activity to showcase this process. During the activity, we discussed how information can be displayed in different figures and how each type of graph can show a different story with the data. We also discussed how scientists use data visualizations to both explore and explain their data. When reading and looking at the published literature we see the final product once scientists have found the story within their data and determined how best to present it. But scientists make numerous iterations of those graphs as they explore the data to make meaning of it. Following this activity, the educators spent time thinking about which type of graph could best showcase the story they wanted to show with their data, as the graph type we use is dependent upon our question and our data.
Field Trip! At this point we provided a break and offered the opportunity to tour the local area where we were hosting the workshop. This provided an excellent opportunity for the educators to not only experience their local surroundings, but also to get to know one another more. If possible, we tried to arrange for a science- and/or technology-oriented field trip. In such cases we asked a few volunteer scientists to help with the tour so that the teachers were able to ask questions about how they performed their research, how they looked at their data, and what tools they used to help analyze the data they collected.
After the tour we returned the previous day’s the mini-proposals to each group with the completed feedback forms, as filled out by the project team the night before. We had the educators take some time and review the comments that we had given them and share in groups to provide more feedback to each other. Then, we explained our methods of providing feedback on the proposals to provide more information on what the students should be expected to include in their proposals and the type of material they should be able to understand. After the mini-proposals were reviewed, we shared with the educators the poster presentation rubric that would be used to review their students work at the end of the year (and the educators’ final presentations on the last day of the workshop). We briefly went over the type of material that they were expected to cover in their presentations and gave them time to discuss with their groups how they were going to achieve those tasks.
Finally, we returned to the data figures activity and had them discuss in groups what type of figures their students use in the classroom. We used the Choosing Data Visualizations Activity to discuss the types of figures that are commonly used to show data and how each one tells a different story. The educators were given some student work examples with the data, question, and chosen graphs. We asked the educators to work in groups to see if the graphs were appropriate to show the data at hand or if the students could have chosen a better figure to represent their data. We closed the day by reflecting on strategies to help students develop better data visualizations to explore and explain their data.
3.5.5 Day 5 - Slidedeck & Agenda
Day five was spent reviewing the goals of the Polar-ICE Sci-I project for the students in the classroom during the academic year. These goals included having the students have a level of inquiry between 1-3 in their investigations (Figure 2), aiming to think more critically about their investigation, and begin to think about the problems, procedures, and conclusion of the investigation on their own.
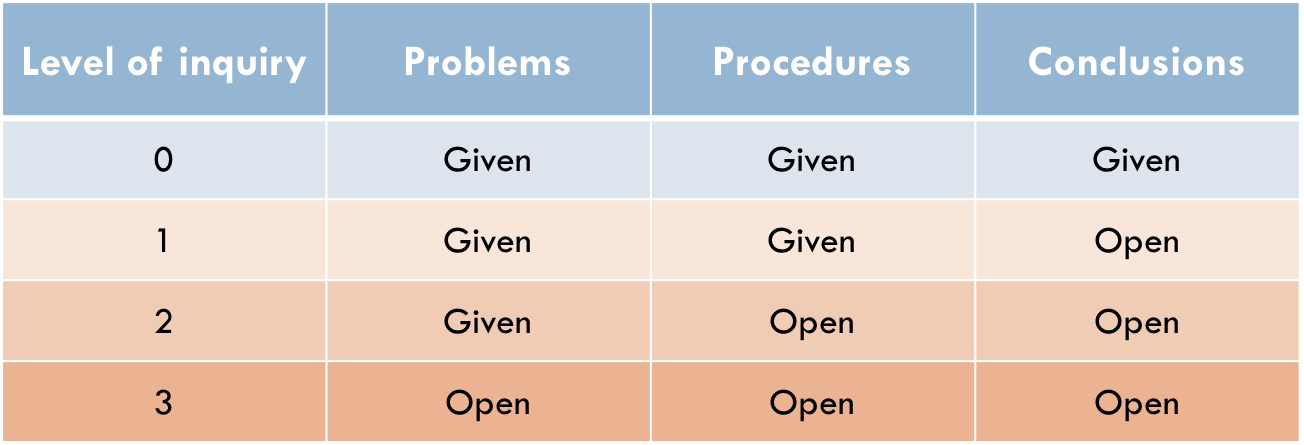
Figure 2. Levels of inquiry in terms of whether the teachers provide the problem, procedures, and conclusions..
We hoped that the students would begin to discern information on their own more rapidly rather than having to be supported the whole way through the investigation. Furthermore, by participating in a Descriptive Investigation through the Sci-I Project (see [What did the Sci-I Project focus on?] section), the students would be exposed to a more advanced learning style that requires them to do more research on their own instead of strictly following directions like in a laboratory protocol. The characteristics of this style of inquiry-based science instruction are summarized in Figure 3.
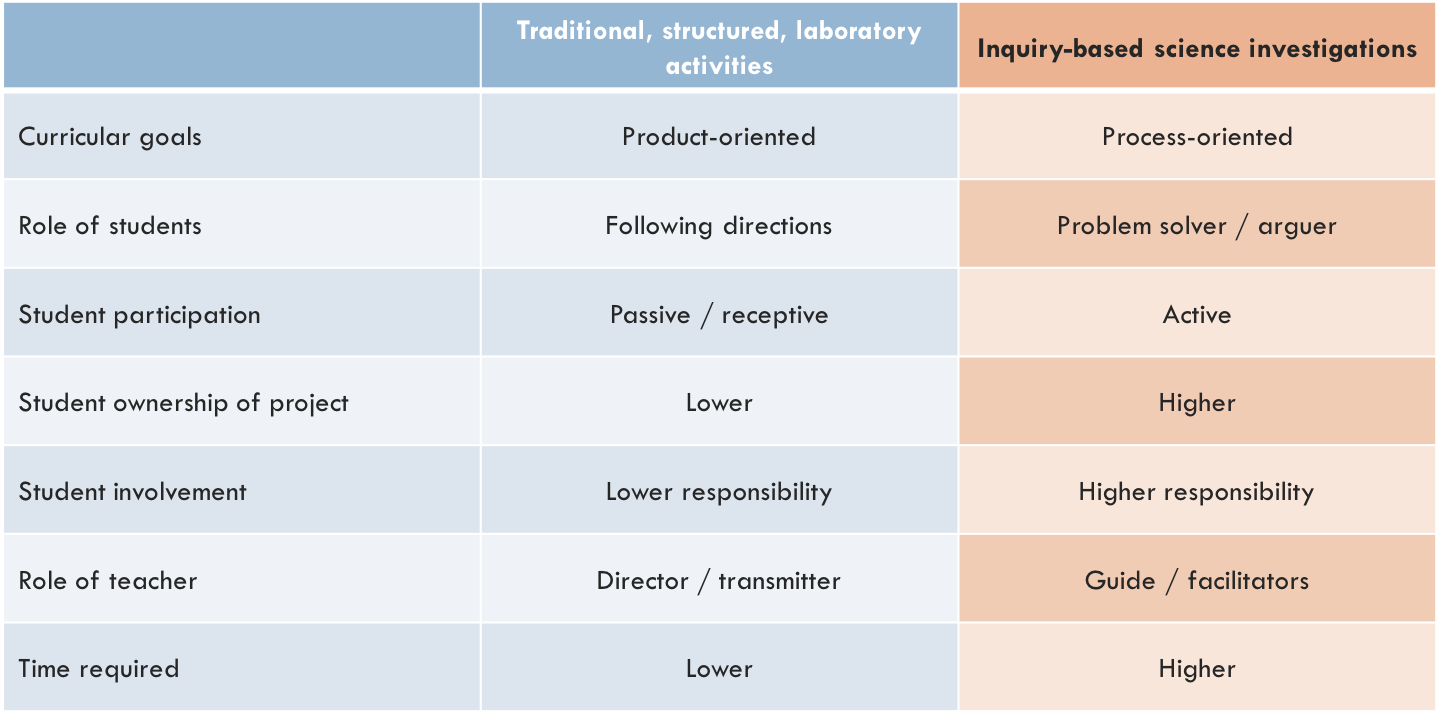
Figure 3. Comparison of science investigations that are traditional, structured laboratory experiences and inquiry-based approaches in terms of approach and structure.
To better prepare the educators for the mini-proposals assignment with their students, we had them participate in the Mini-Proposal Activity where they were presented with examples of mini-proposals submitted by students and had them draft completed feedback forms that they could give to the students. After reviewing a few proposals, we did a share-out and discussed as a group what the educators could do to help the students to be successful in writing their mini-proposals.
We then had each group present the results of their project via one projected slide with their testable question and data visualization. The rest of the educators and scientists provided feedback for each presenting group. After everyone presented, the educators discussed in groups how well each figure represented the data, what it was like to present their data, and why we have the students present their data at the end of the project.
A large portion of the final day of the workshop was spent helping educators feel prepared to implement the project in their classrooms during the up coming year. This included discussing logistics of the project and key points we expected the educators to do during the year, including:
Assisting students in: * Designing open-ended, polar-related Descriptive Investigations, * Writing & submitting mini-proposals, * Reviewing mini-proposal feedback, * Conducting investigations, * Interpreting and analyzing data, * Developing and presenting scientific conference posters, and * Selecting representative posters at your school. Enabling the students to: * Be in groups with no more than 4 students for their projects. * Focus on polar topics accessible via online polar data (For our iteration, this was necessary. For your iteration it is up to your discretion.) * Develop testable questions, design a Descriptive Investigation, conduct it, analyze the data, and compile results into scientific poster. * Submit mini-proposal to Sci-I Project team for review.
To prepare for what this would look like in their classrooms in the fall, we dedicated time for implementation planning within school partner groups and across grade bands, we also provided an Educator Checklist for the project. During this time the Sci-I staff checked in with each partner group to see how the planning was going and offered suggestions. We also used this time in the workshop to finalize on the dates for the Student Research Symposiums within each state, to find a time that worked best around state testing and teacher preferences. We hosted previous implementations of the project on the university campus allowing the students to travel to a local university and experience what a college campus is like. If a school/class cannot make it to the symposium, they may be able to host a smaller symposium at their home campus, however, it may be more difficult to bring in scientists to be reviewers for the posters.
We culminated the workshop by reviewing the evaluation plan for the project and discussing the evaluative components we would be asking all educators and students to participate in during the year. The educators completed their post-workshop evaluation instrument prior to the final workshop reflective discussion. We took time at the end of the workshop to reflect on all that we had covered as learners ourselves with data as well as educator facilitators of the project for our students going forward. This provided a great opportunity for educators to celebrate their successes together and continue to build community of practice engaged in a common project before dispersing back to each school.