Chapter 4 RESULTS OF THE ELABORATION
The following chapter is organized to show in chronological sequence, analysis, and results obtained during the development of this thesis work. Therefore the articulation of the chapter will be given by three paragraphs concerning the acquisition of lithological and structural data collected during the survey phase between September 2021 and December 2021 (subsequently processed through software), and the microstructural analysis obtained during the activity of the laboratory carried out in February 2022, after having cut and prepared the fault samples collected in the form of a thin section.
4.1 Geological Map of the study area
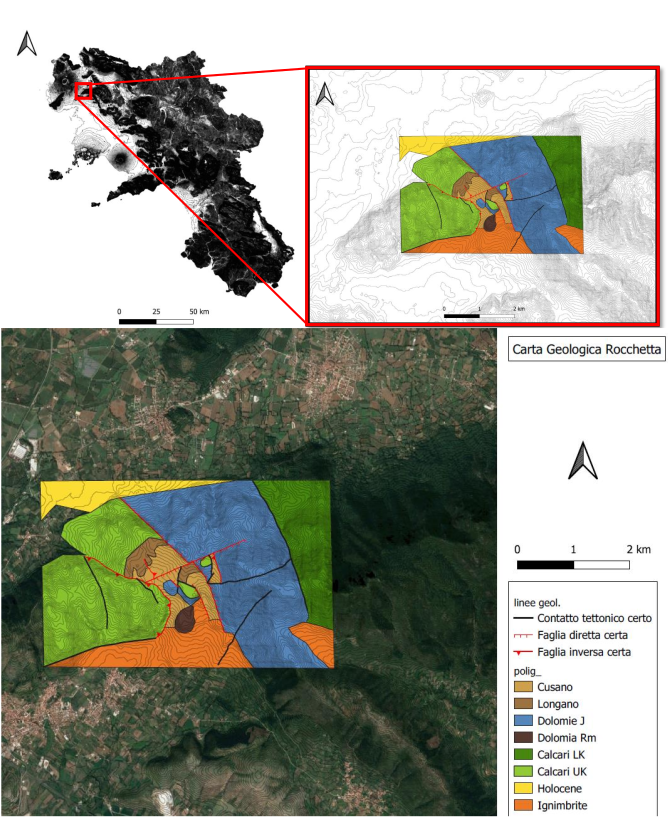
For the creation of the geological map of Rocchetta area, the field activity was made with the geo-referenced Fieldmove app to obtain geological and geo-structural survey data. Through the functionality of the program relating to the entry of punctual, linear, polygonal, bedding and photographic data, I was able to carry out the field survey and process the data. By exporting the file created in the field in .shp format, the map was created on Qgis platform. Working At the same time with the orthophoto and the topography layers (scale 1: 5000) it was possible to trace vector data that simulate the lithologies and the tectonic structures of faults found on field. I used the same colors of Sheet 172 “Caserta.”
4.2 Rocchetta-Bellona Fault Stereo Plots
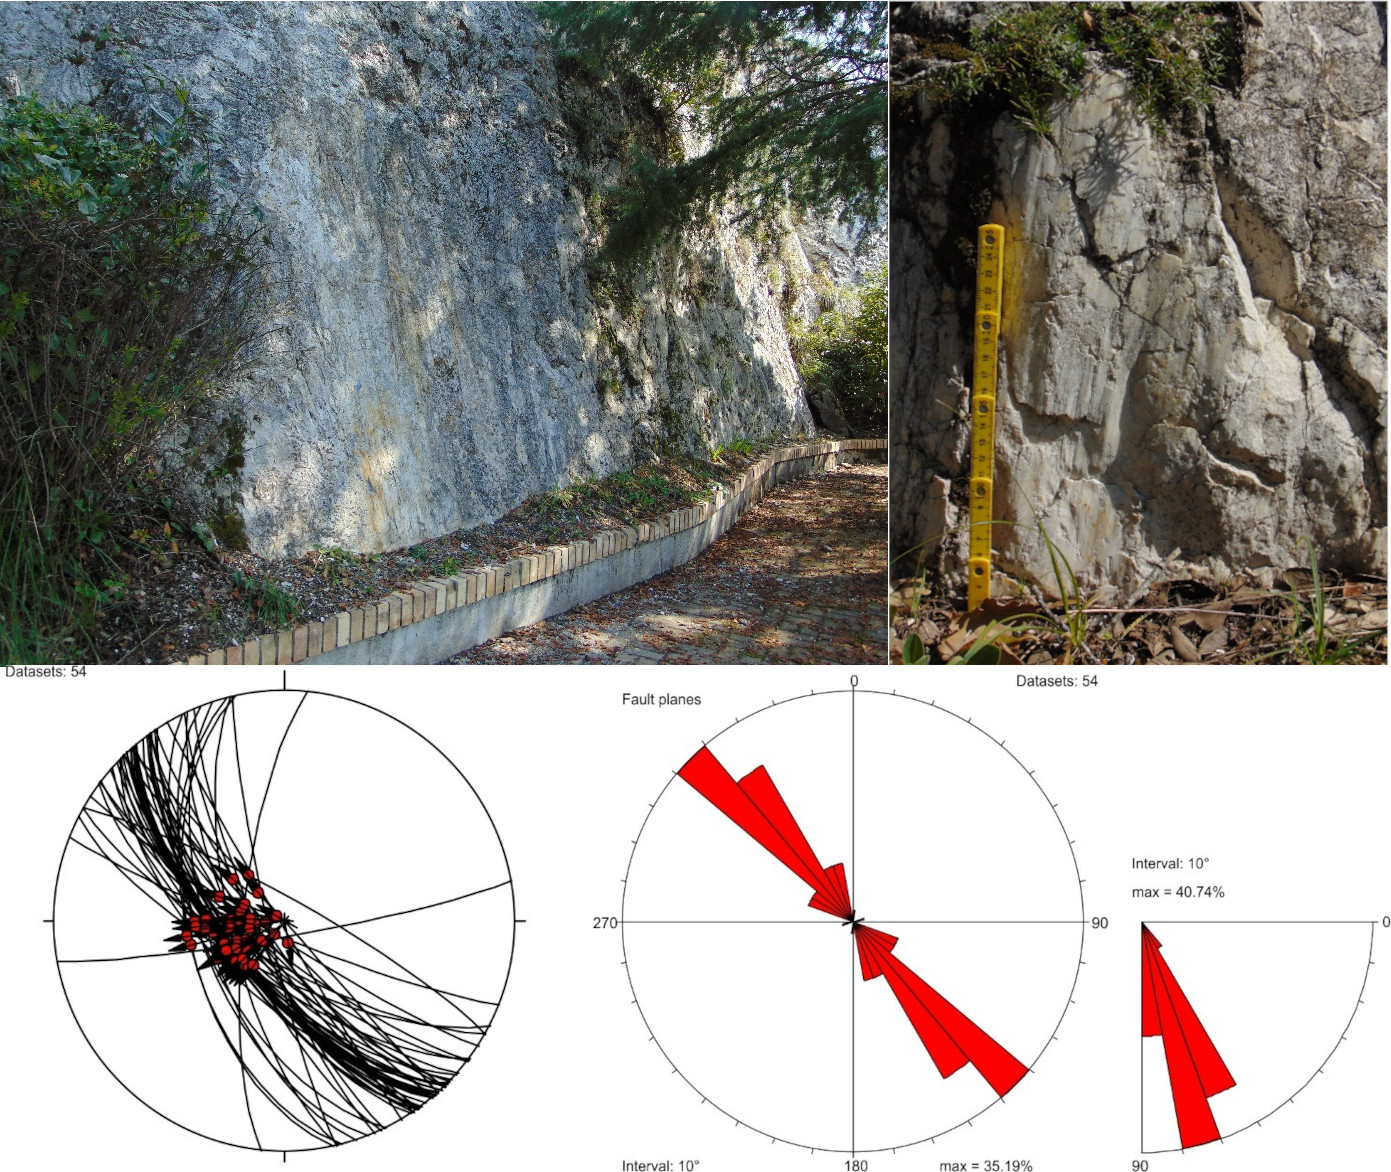
Figure 4.1: Up: mirror fault zone on the left and associated striaes on the right. Down: stereoplot and istogram results of data.
Part of the field activity was dedicated to the RBF fault data collection. The measurements were collected with the GeoID application, which allows you to measure the attitude and position of different measured structures (planes and lineations), categorize them into project folders, and send the data offline in a text file. 108 measurements were taken, 54 of planes and 54 of striations (Fig. 4.1) and the result was transferred, processed and displayed with the Tectonics FP software.
4.3 Microstructural Analysis of samples
During the field activity, 6 samples were taken from the fault transept of the RBF outcropping in the Rocchetta. The aforementioned samples were processed in the Federico II University of Naples laboratory to be rendered in thin sections and analyzed under an optical microscope. 4 consequential phases characterized microstructural analysis. The first phase of the microscopic description of samples is based on the microscope images and on identifying microstructures for the definition of fabric and general texture for each sample. The second phase of image analysis through ImageJ software made it possible to carry out the fractal analysis of the distribution of clasts, determining the Dr parameter. Finally, the frequency analysis of clasts determined the third phase through MATLAB to identify the Ds parameter. The two parameters have been related in the PSD (particle size distribution Ds-Dr) graph. The following paragraph has therefore been divided into the 4 sub-paragraphs mentioned above.
4.3.1 Presentation of Samples
Sample ROC_1 (0 m)
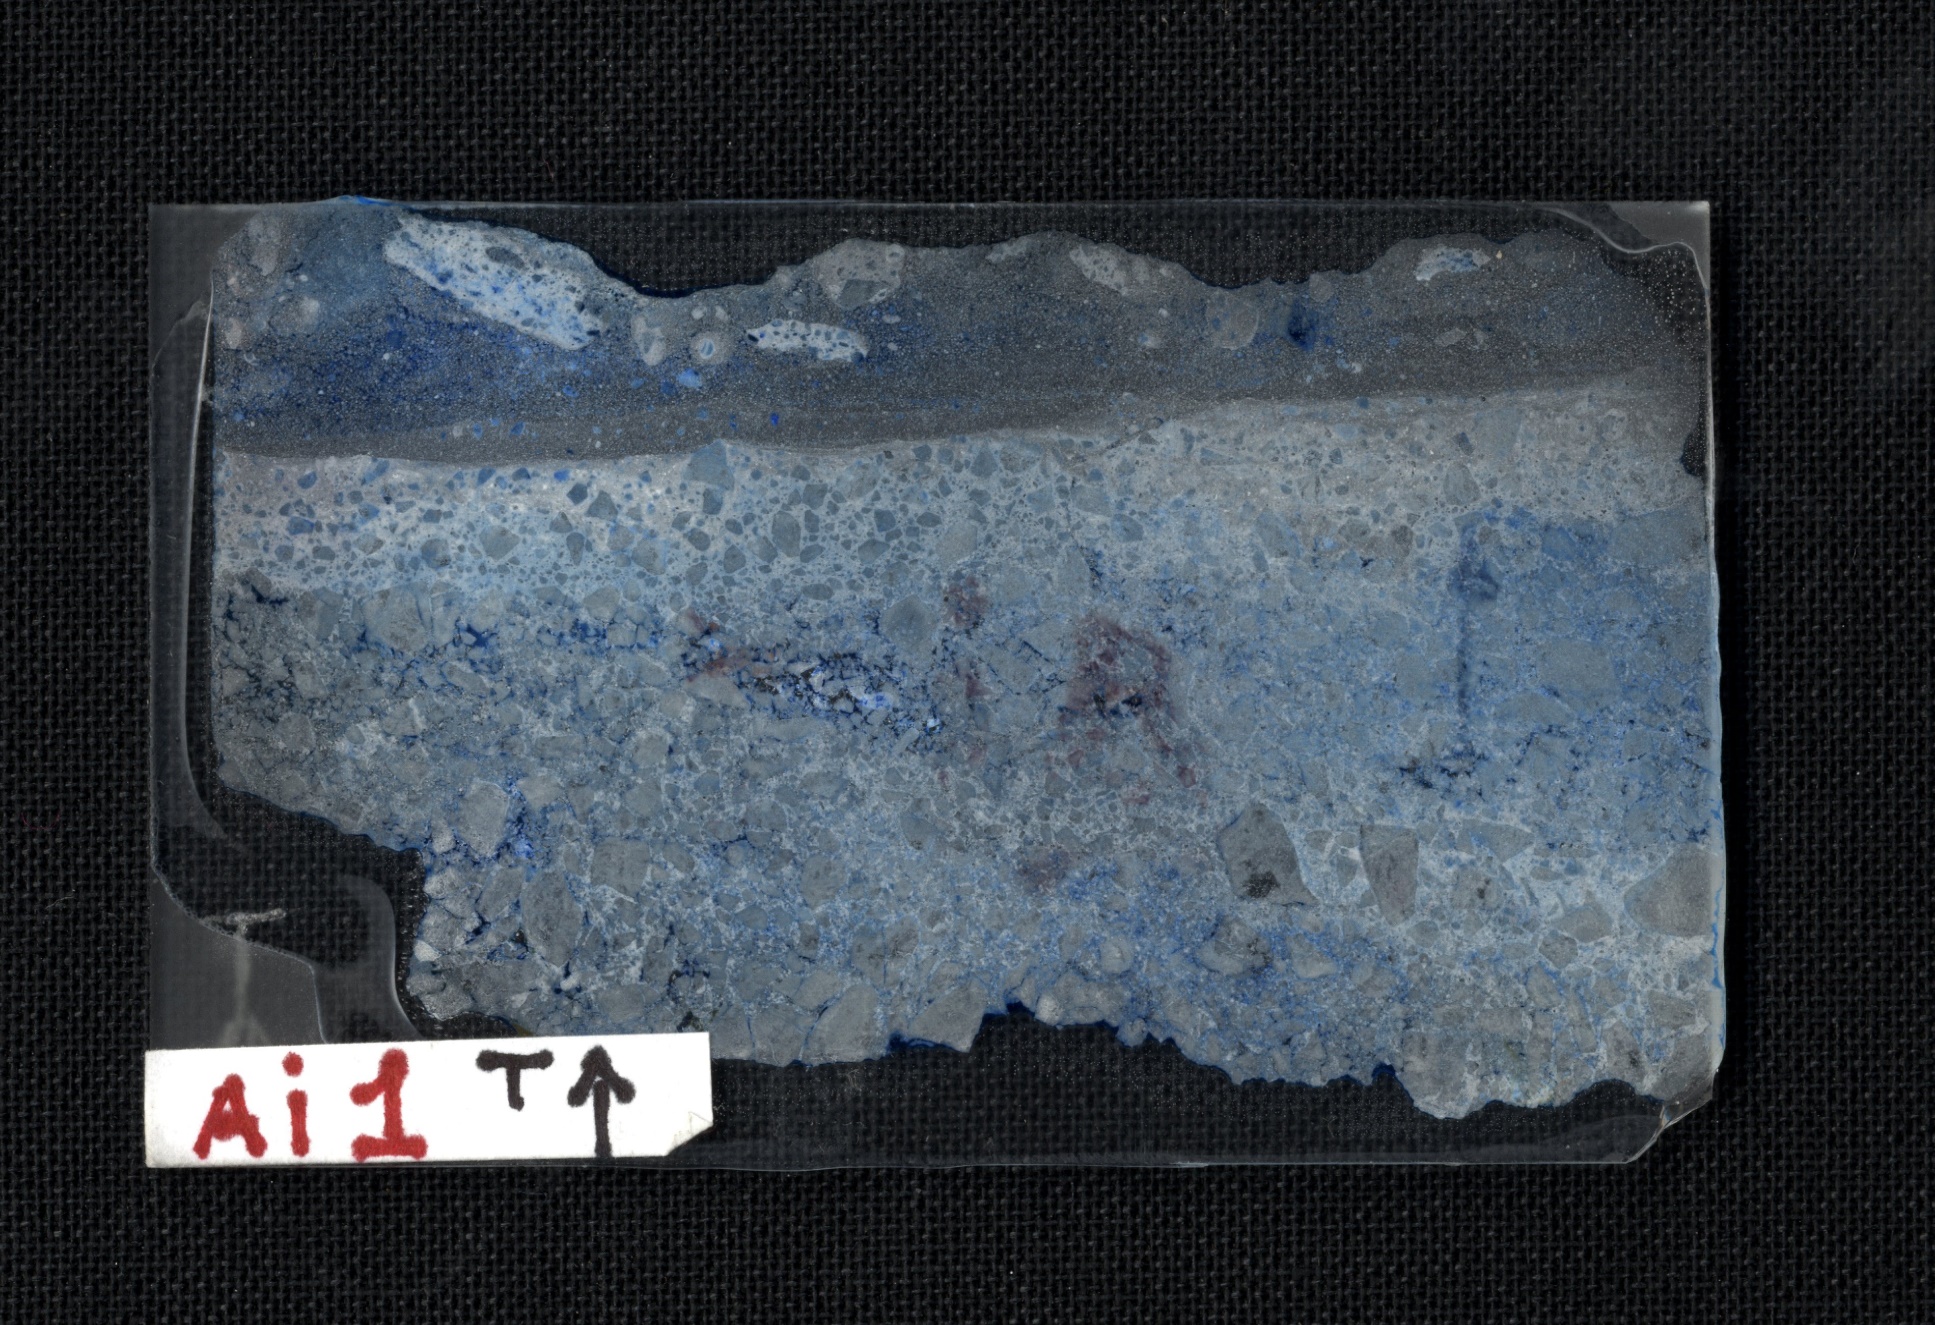 The section is defined in the upper part by an evident cutting area that identifies and separates an area with a remarkably mature cataclastic texture with a very fine matrix from the underlying area with a texture that can be defined as an intermediate cataclasite in the cemented part and more proximal to the cut surface and, lower down, as an embryonic cataclasite. In addition, there are traces of sub-horizontal and NW-SE foliation.
Sample ROC_2 (1 m)
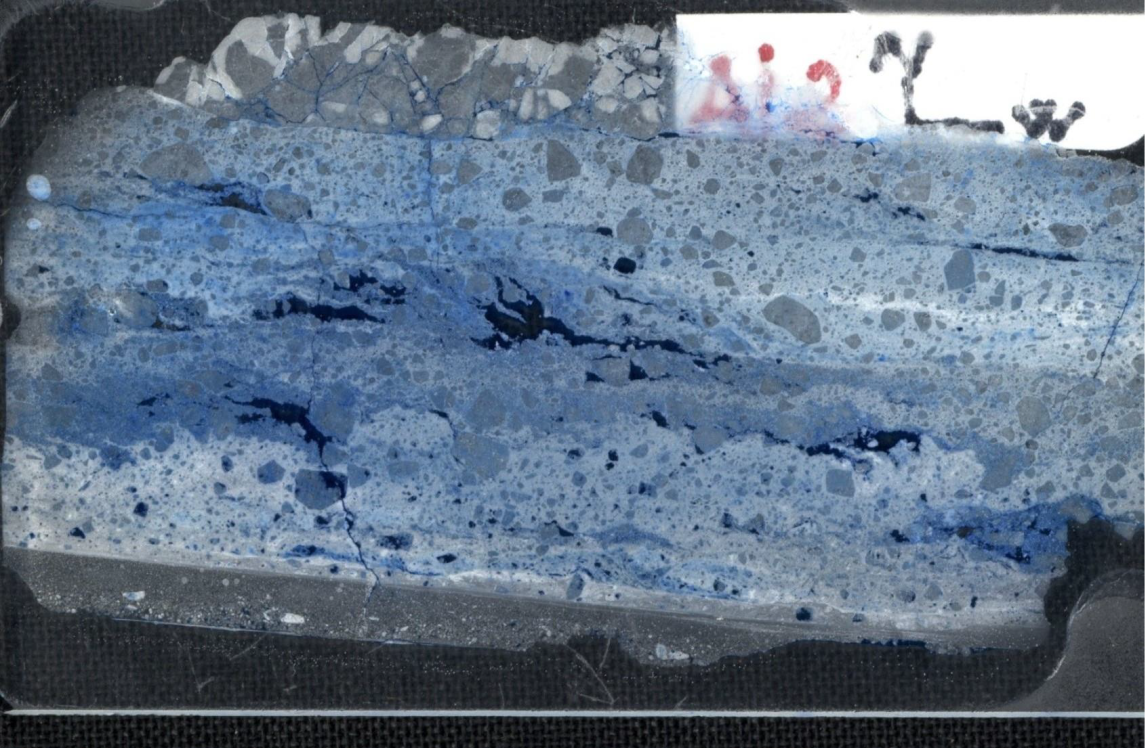
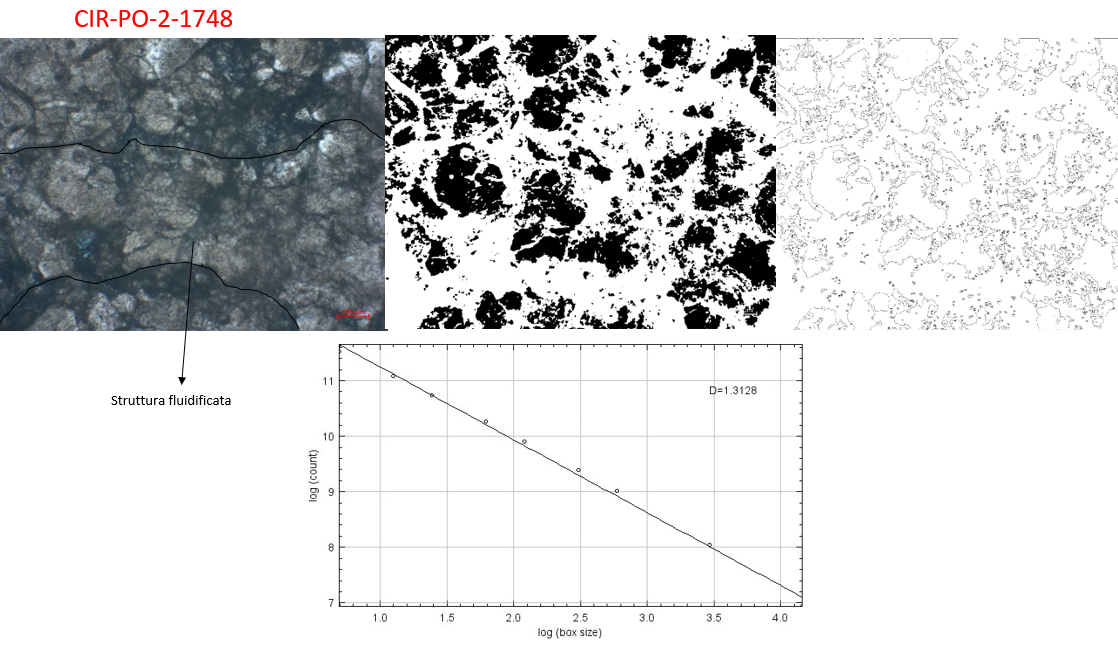
The section has a mature cataclastic texture that abruptly becomes embryonic cataclastic from bottom to top. Most of the rock shows traces of foliation that follow the orientation of the few major clasts and fluidized structures in the center that cement the area with a very fine matrix. The upper part is characterized by intragranular extensional fracture, which defines an incipient stage in the formation of a fine matrix.
Sample ROC_5 (4m)
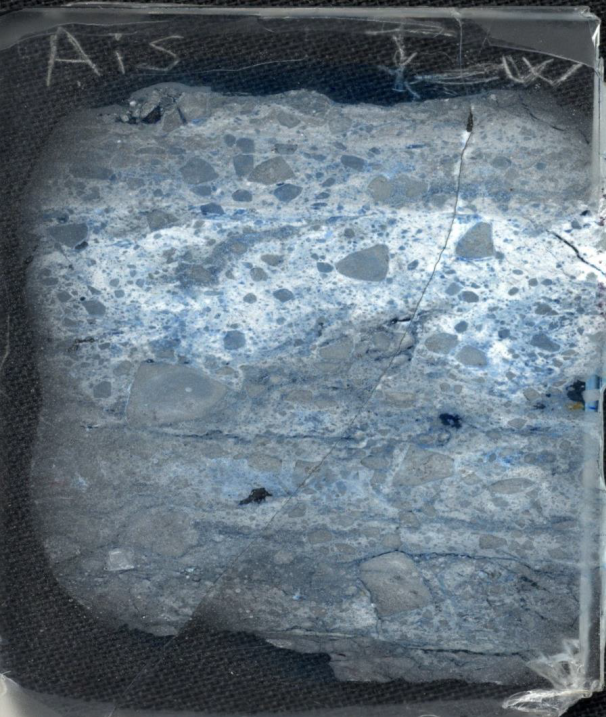
The section shows a fairly mature cataclasite texture which, towards the bottom, is defined as an intermediate cataclasite. There is an important cemented area in the upper part of the section and traces of sub-horizontal foliation are also evident within the intermediate cataclasite fabric.
Sample ROC_6 (5m)
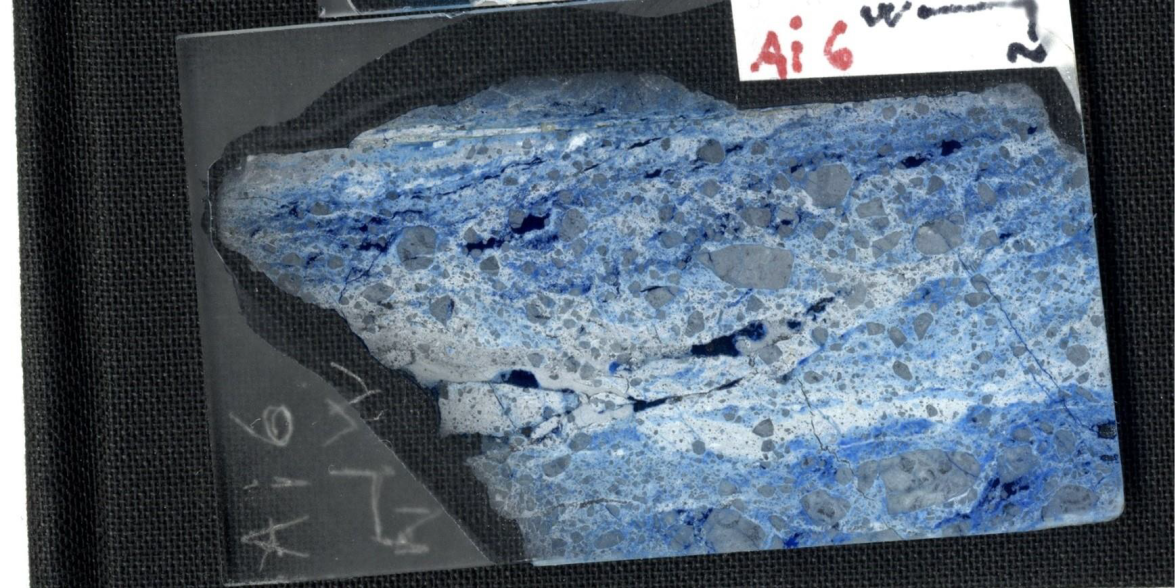
The section presents a repetition of the weaving, which, overall, gradually from a very mature cataclasite becomes downwards, typical of an intermediate cataclasite. Numerous fluidized structures incorporate the smaller clasts and surround the rare major clasts and traces of NE-SW orientation foliation.
Sample ROC_7 (6m)
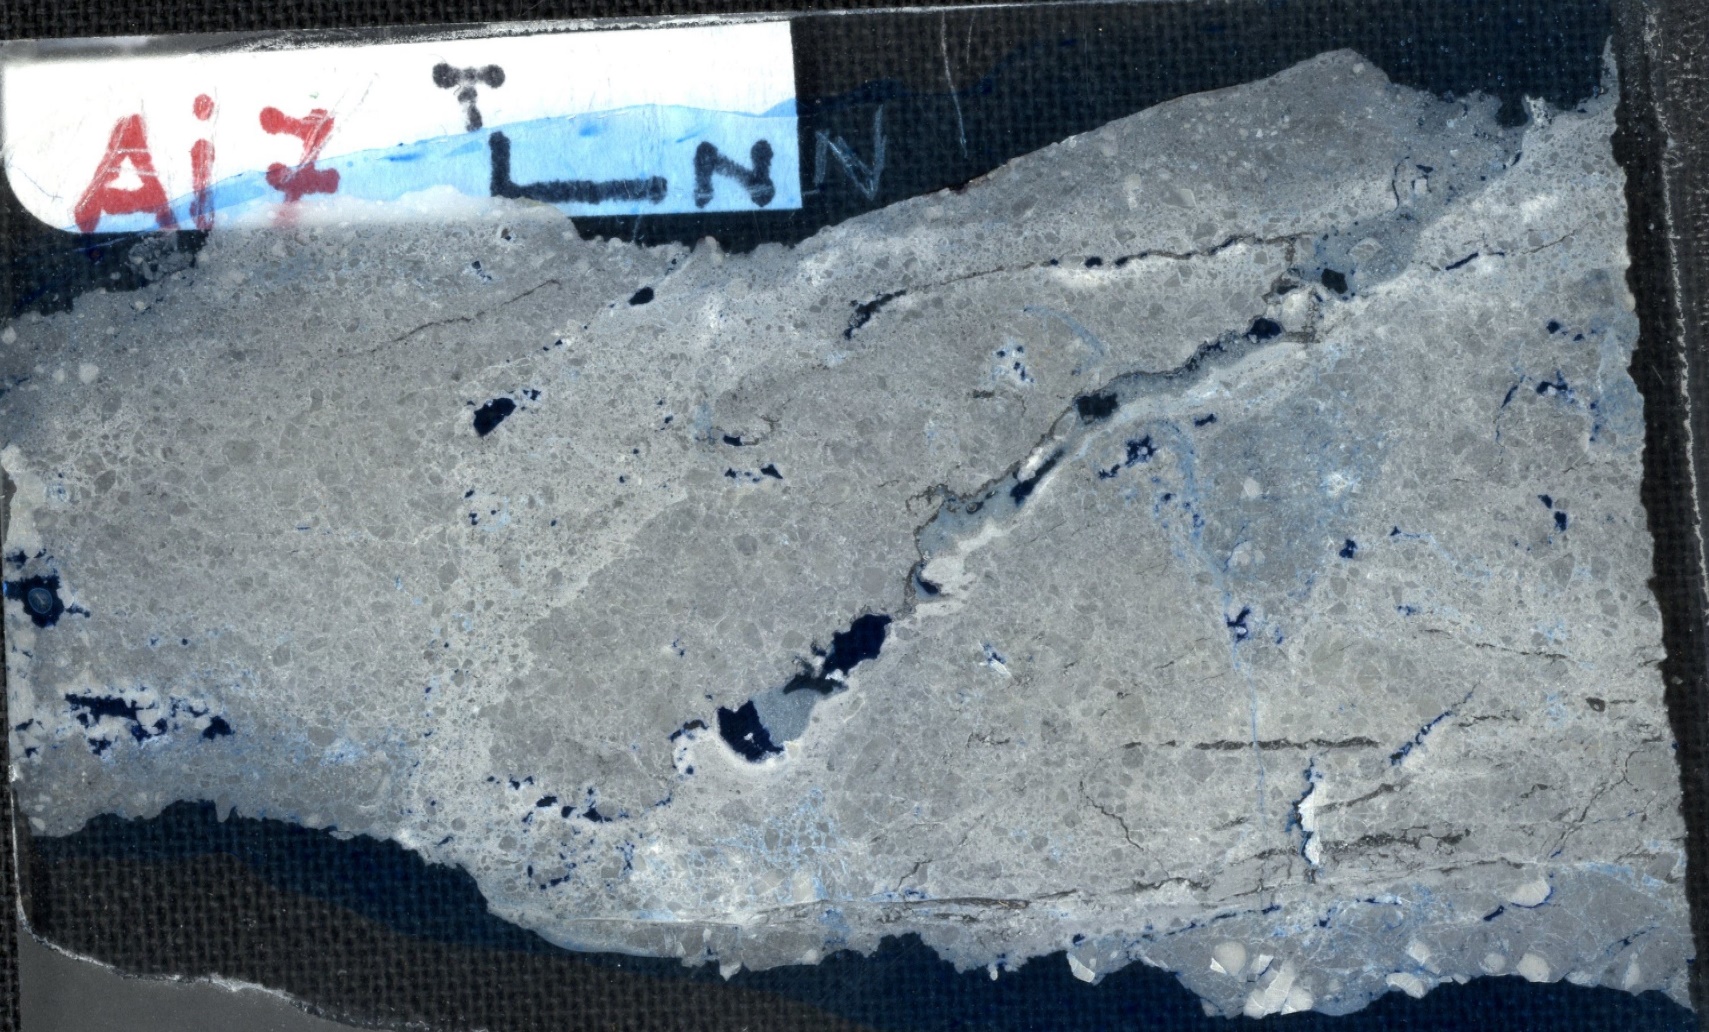
The section has a generally incipient mature cataclasitic texture with different fluidized structures that cross the area flowing according to the two main stress directions, better defined by the two major fractures, with NE-SW orientation and variable inclination (10 ° to 50 °) with respect the slip plane. No traces of general foliation are visible.
Sample ROC_10 (9m)
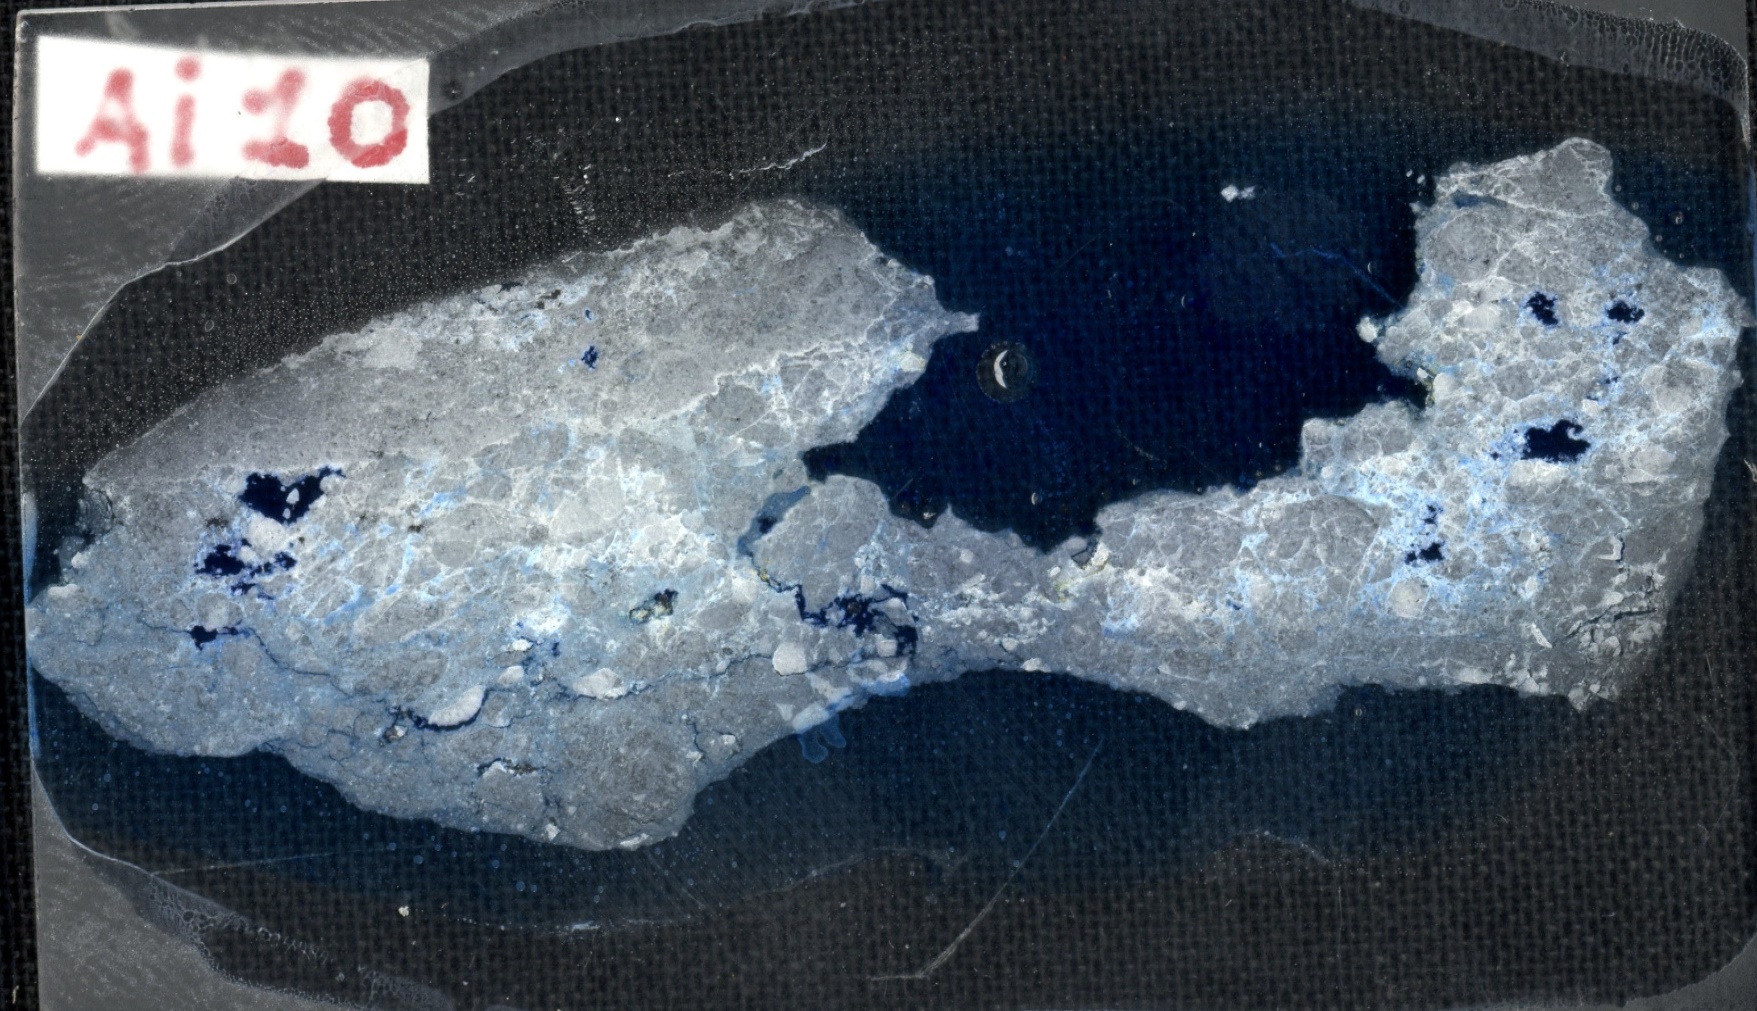
The section has an evident embryonic cataclastic texture, very porous and not very cemented. The point of contact with the still undeformed part of the rock or in a very incipient stage of deformation and brecciation is visible at the top.
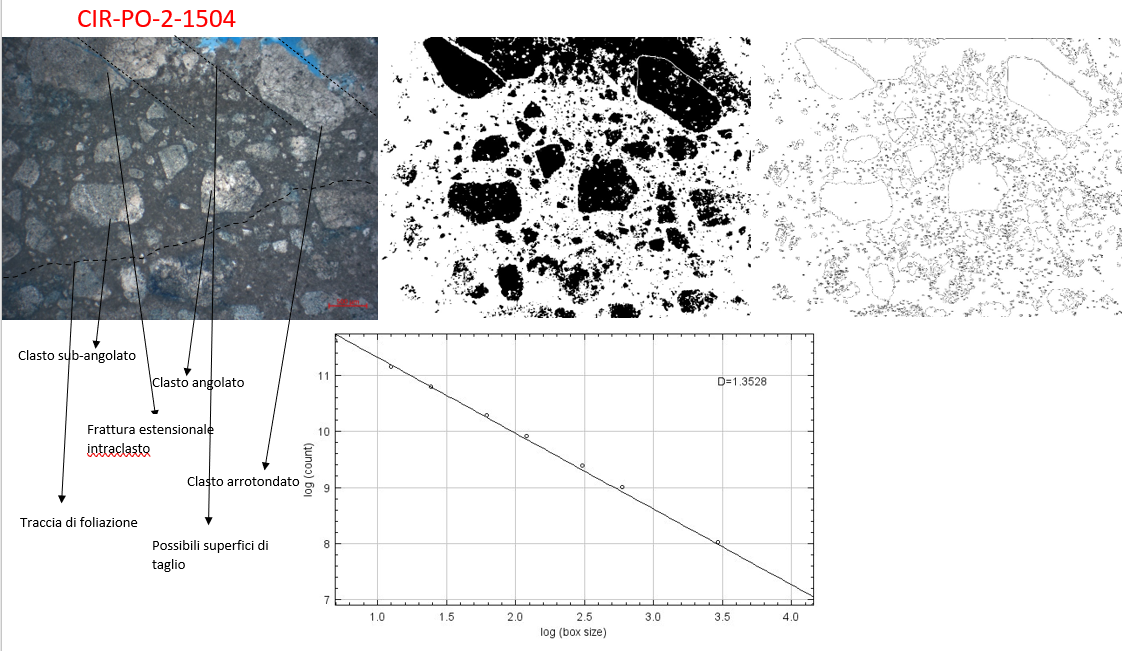
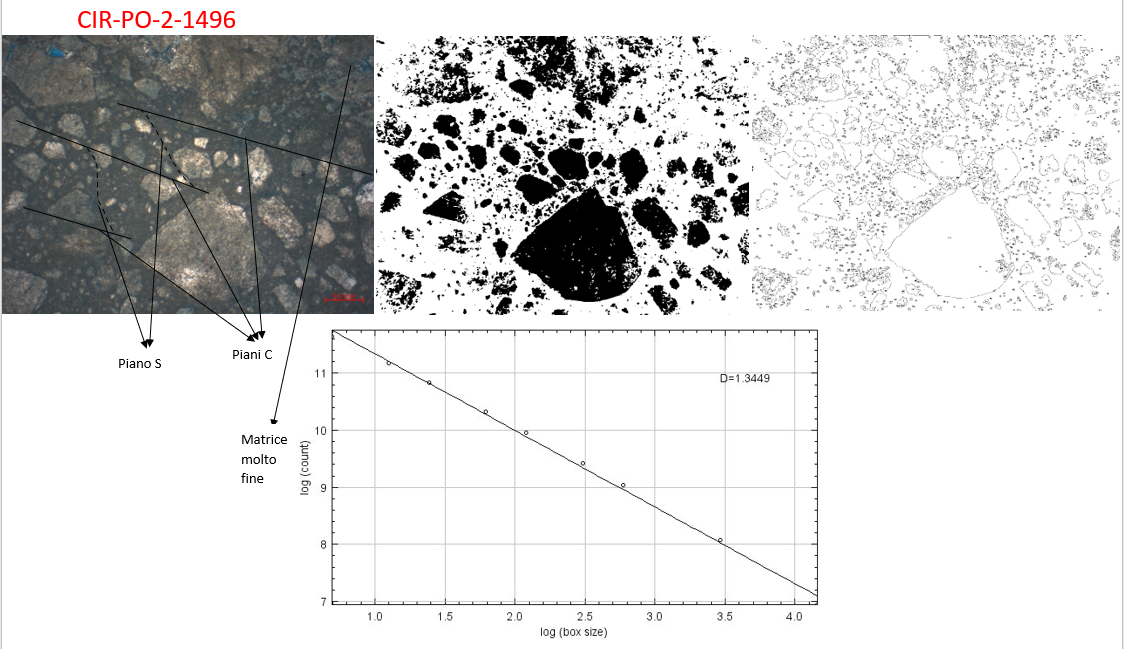
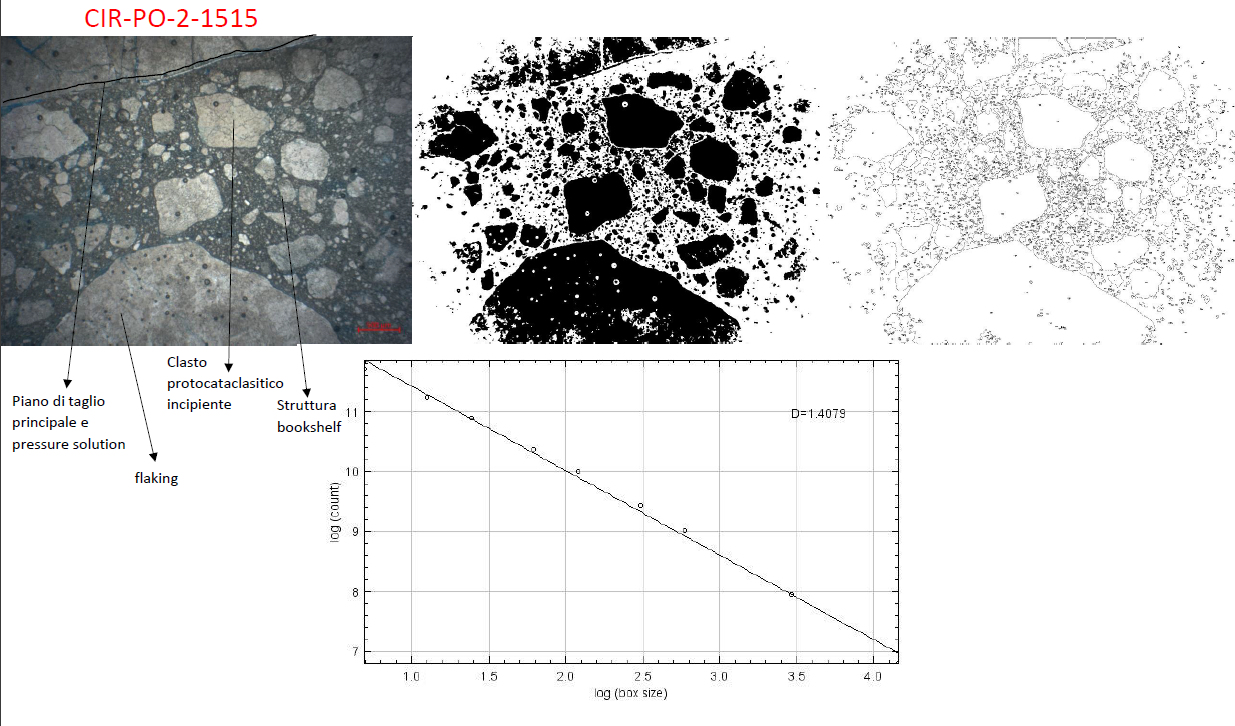
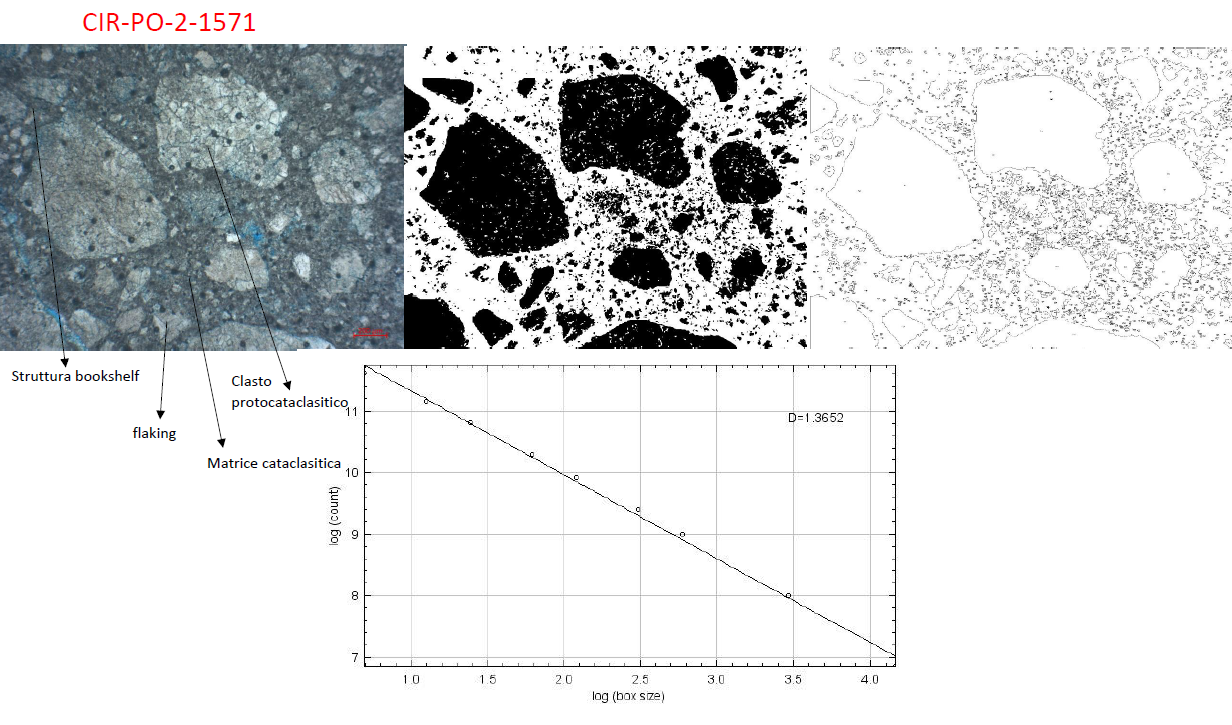
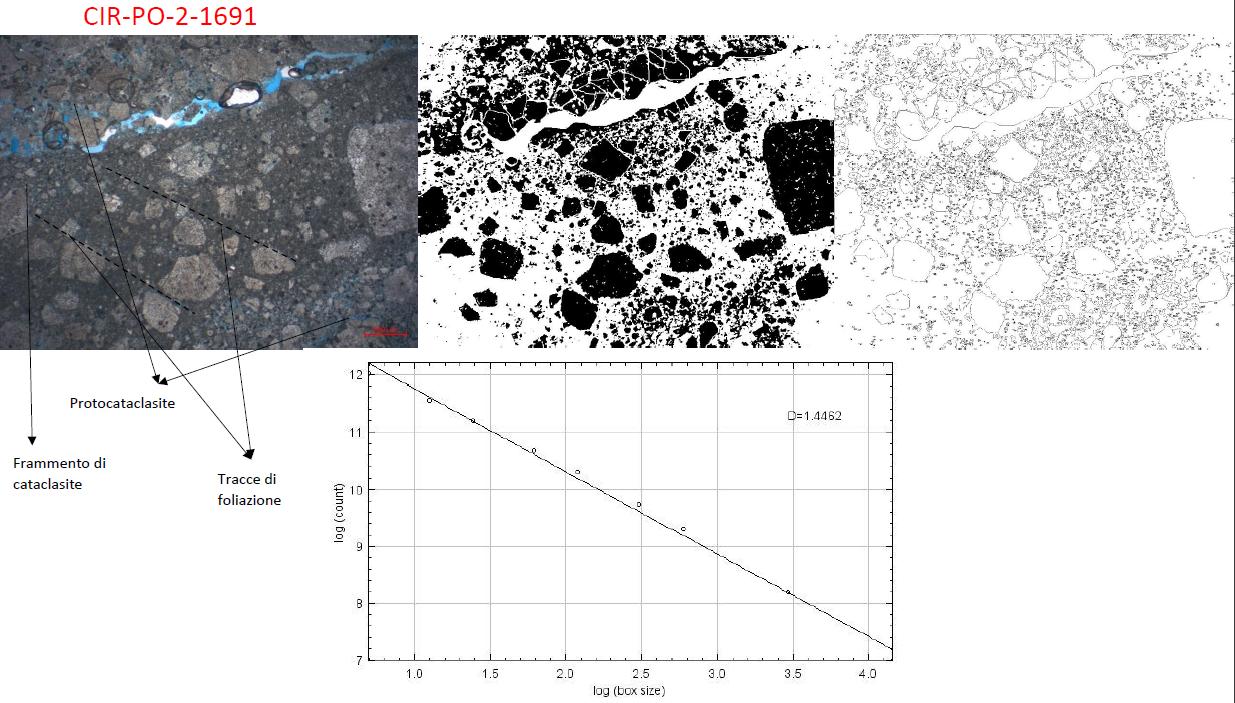
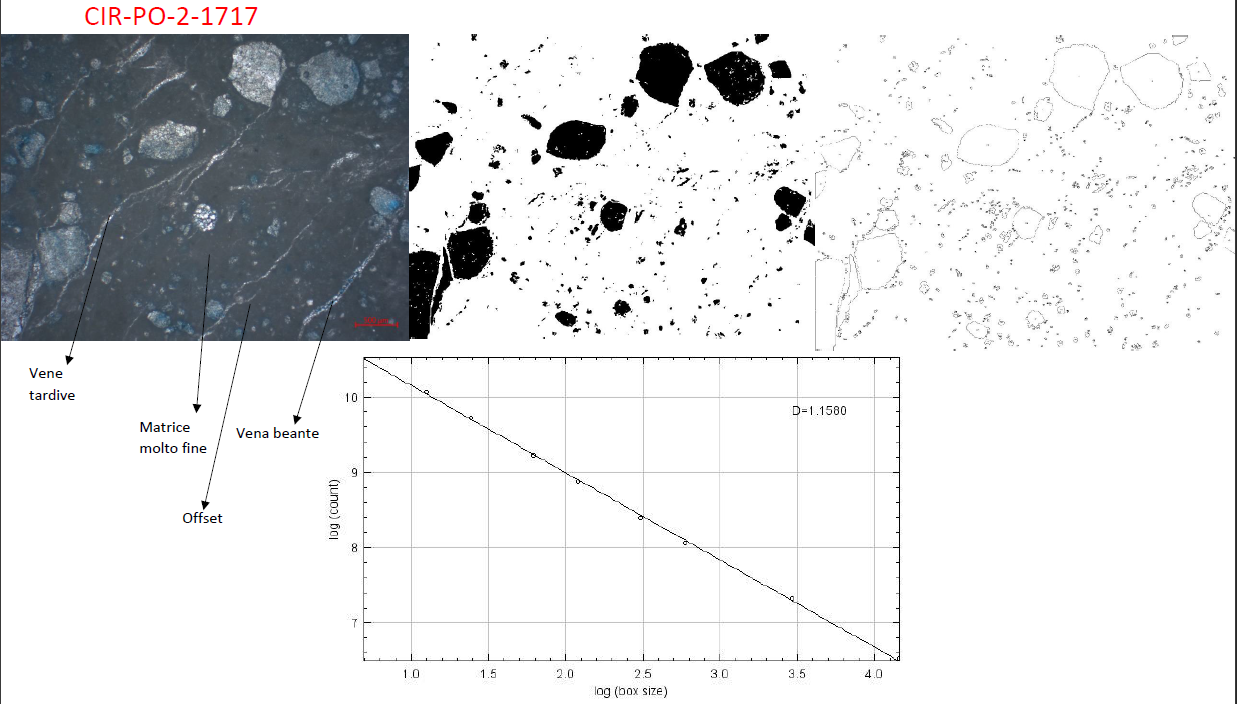
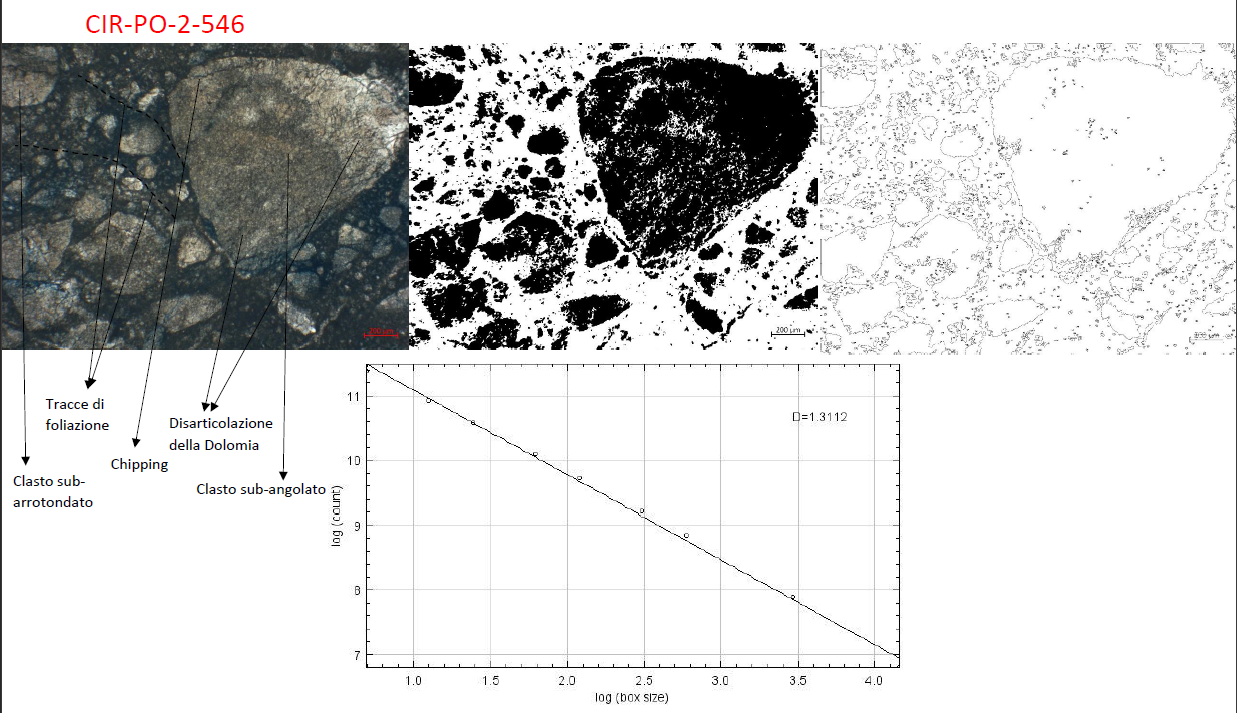
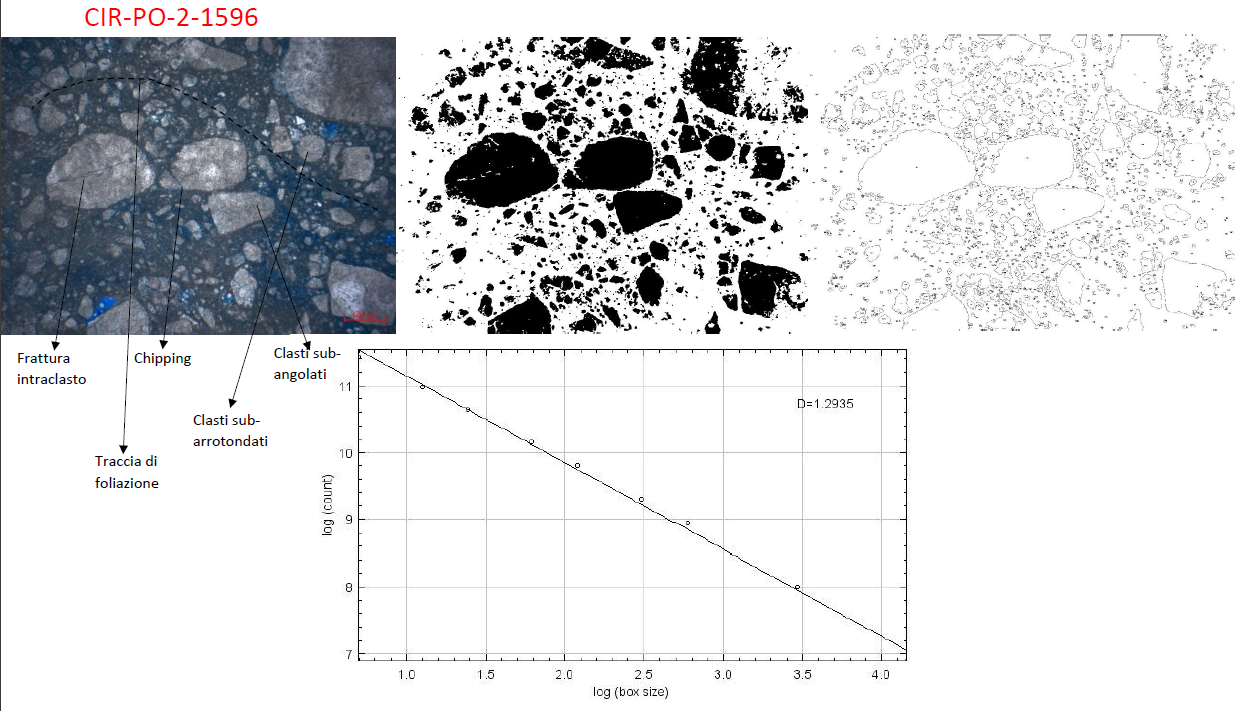
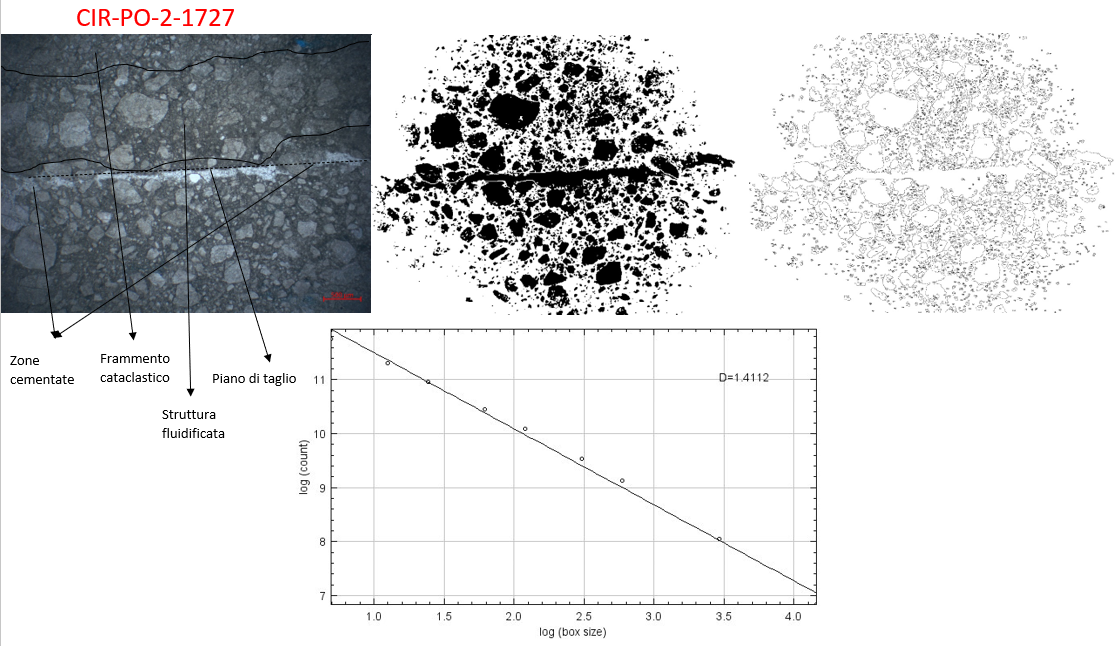
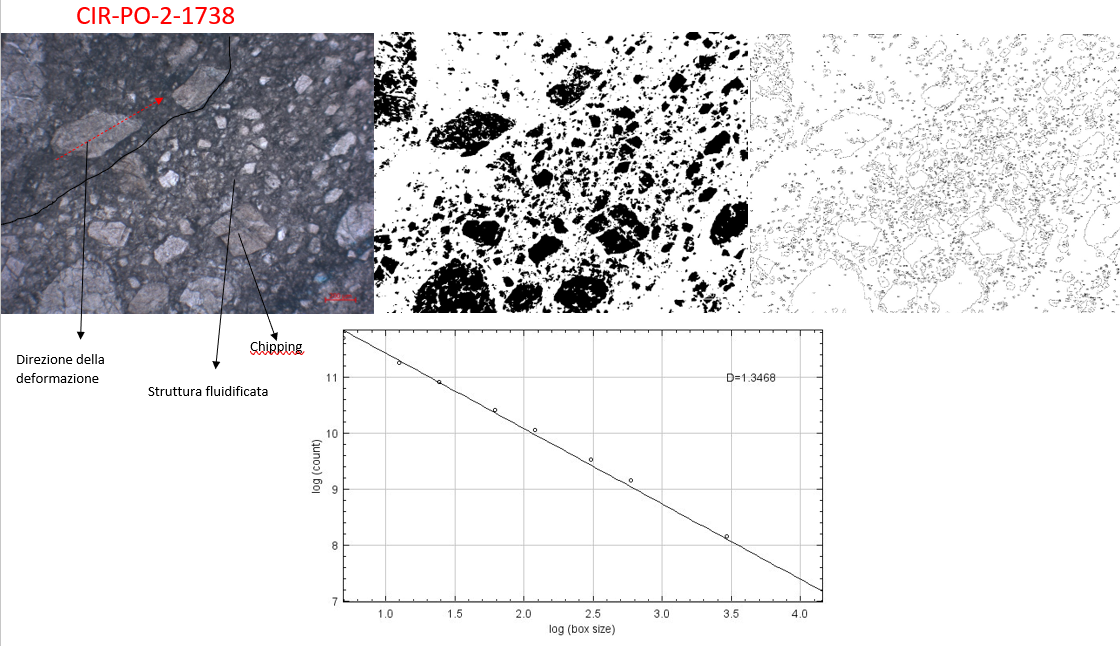
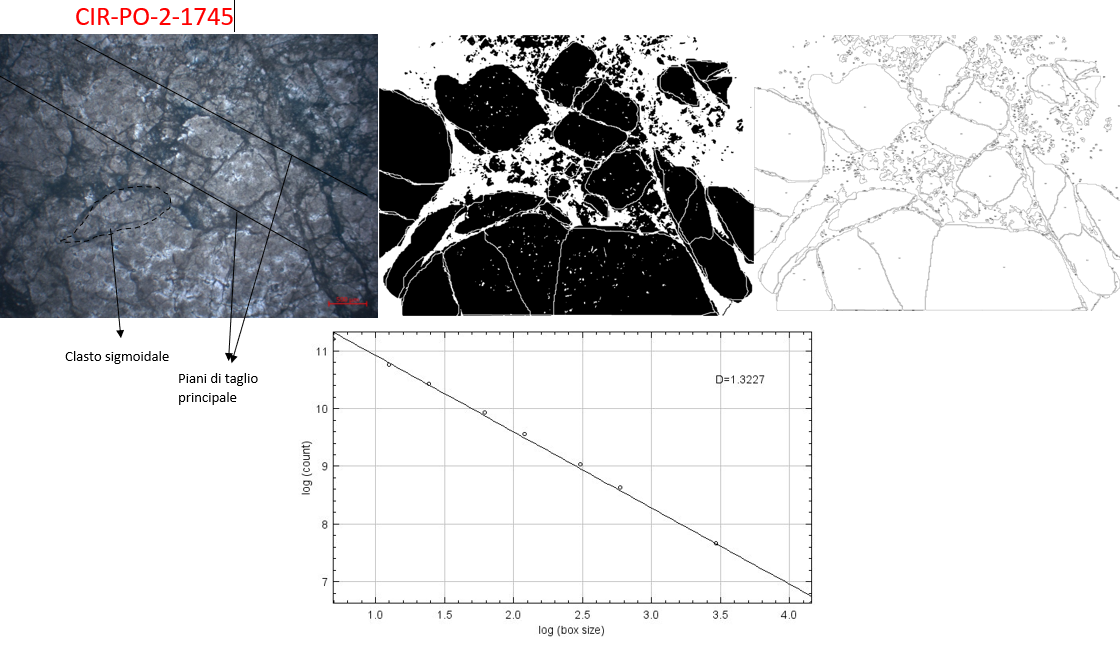
4.3.2 Image Analysis (Dr definition)
The image analysis with consequent fractal analysis was performed in the manner explained in paragraph 3.4.1 ImageJ of the chapter on analysis methodologies. The results of the most representative photos of each sample are shown below. For more details see the attached appendix.
Sample ROC_1 (0 m)
Sample ROC_2 (1m)
Sample ROC_5 (4m)
Sample ROC_6 (5m)
Sample ROC_7 (6m)
Sample ROC_10 (9m)
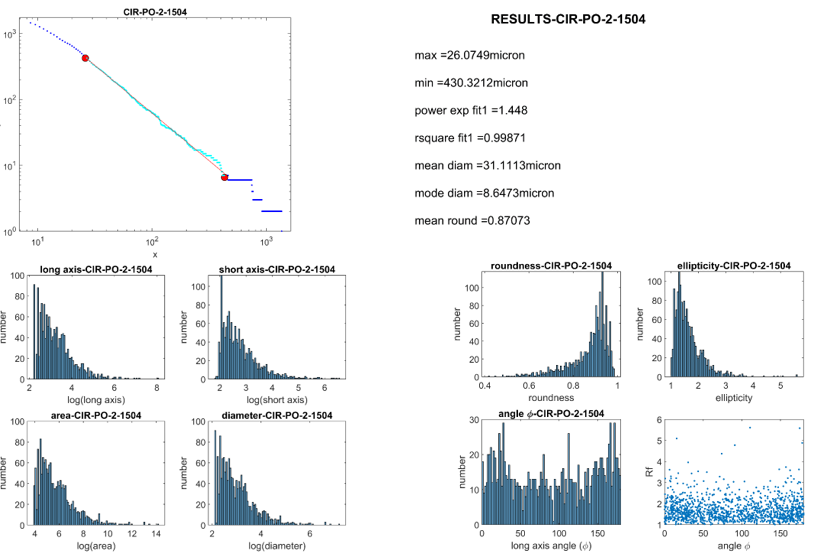
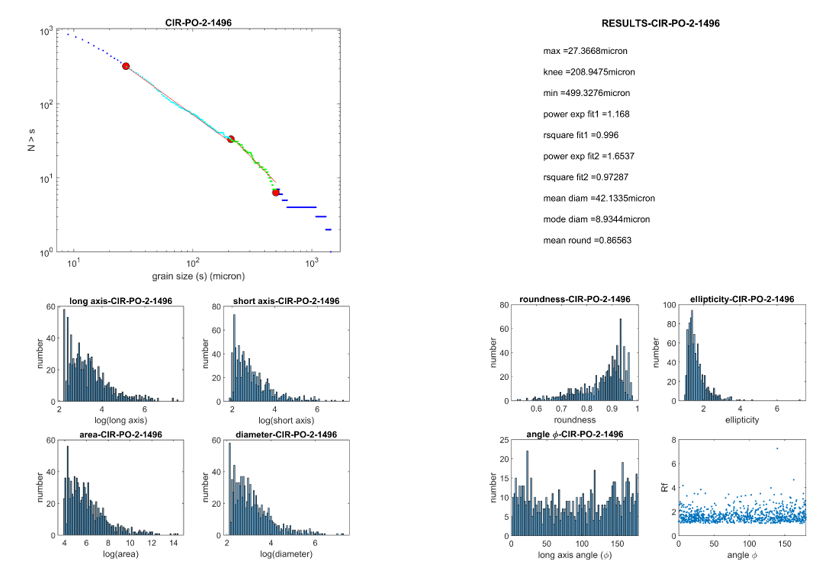
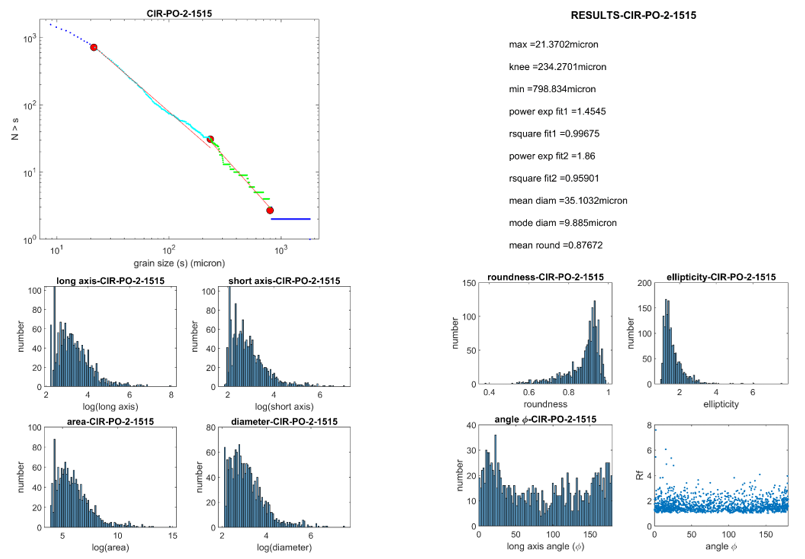
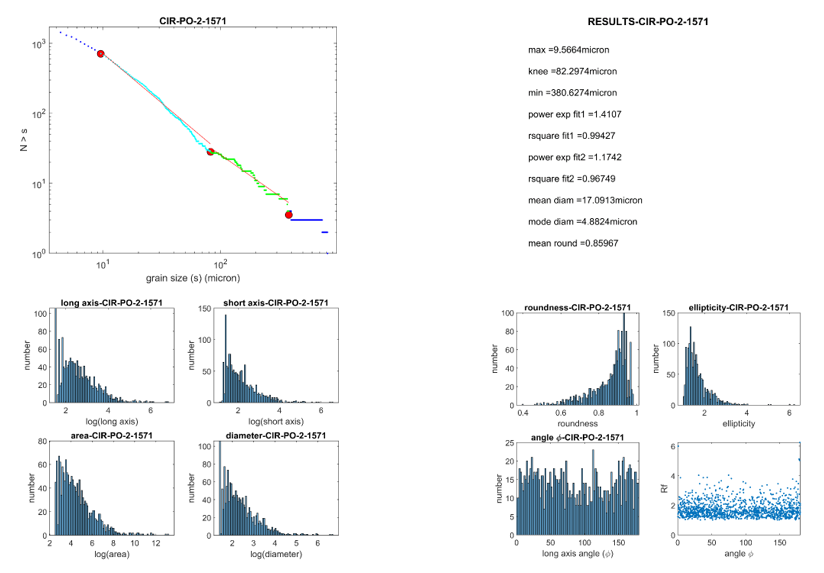
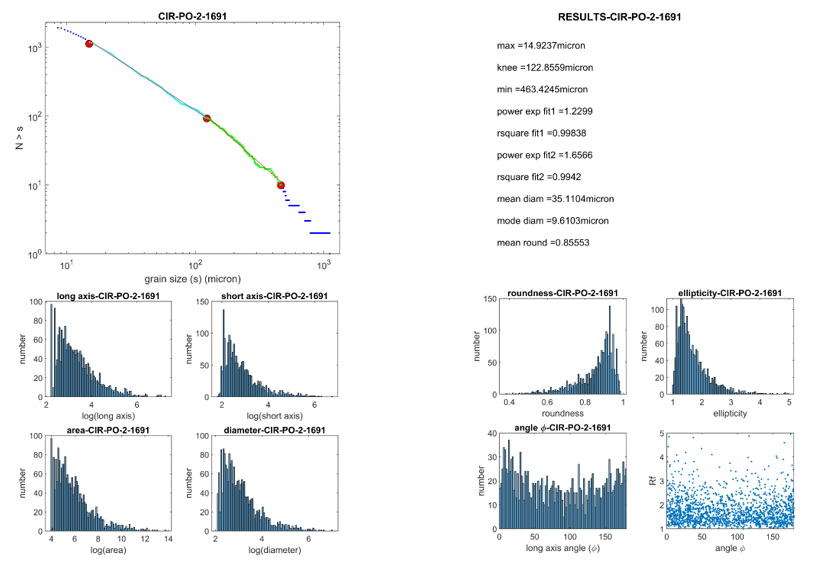
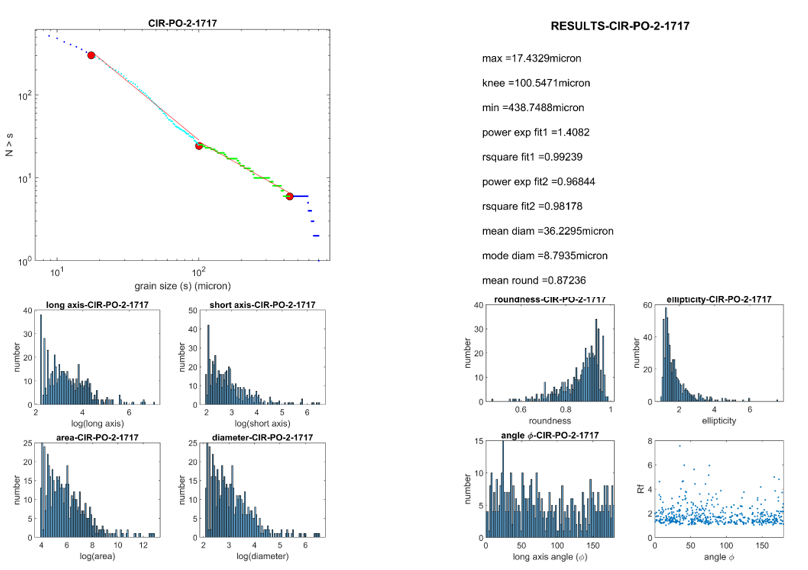
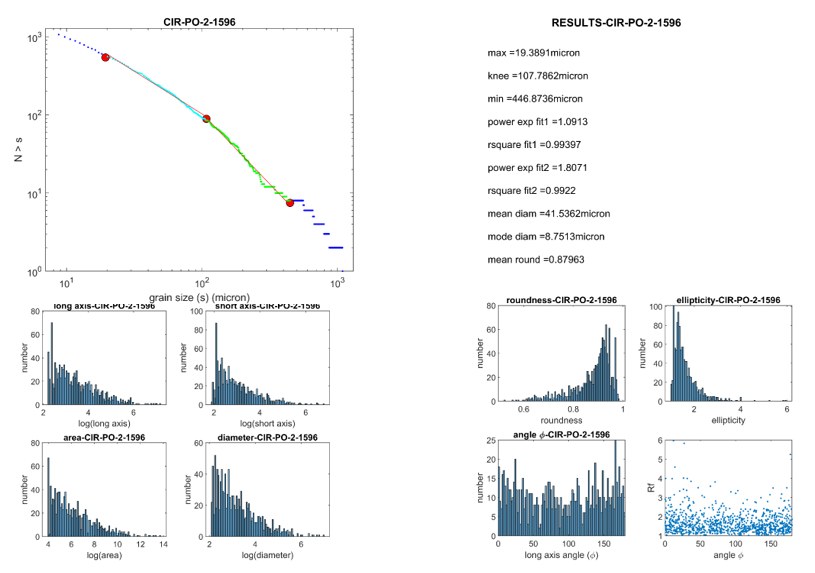
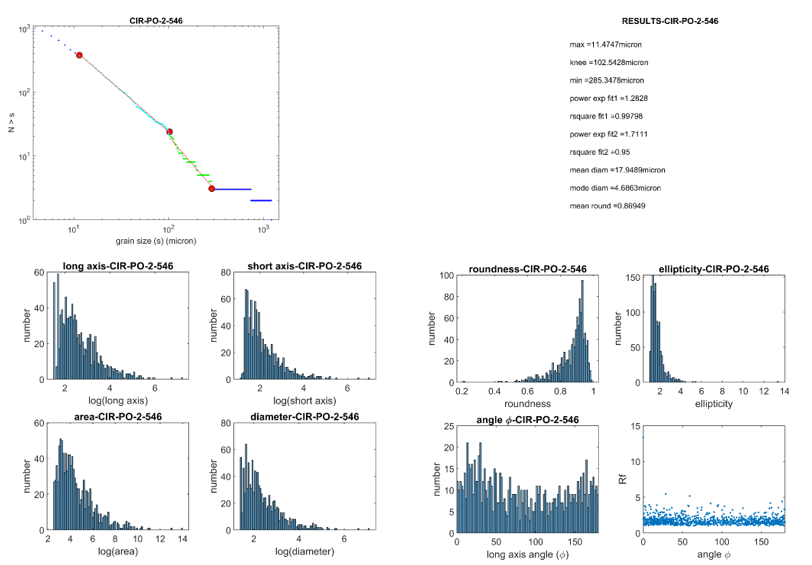
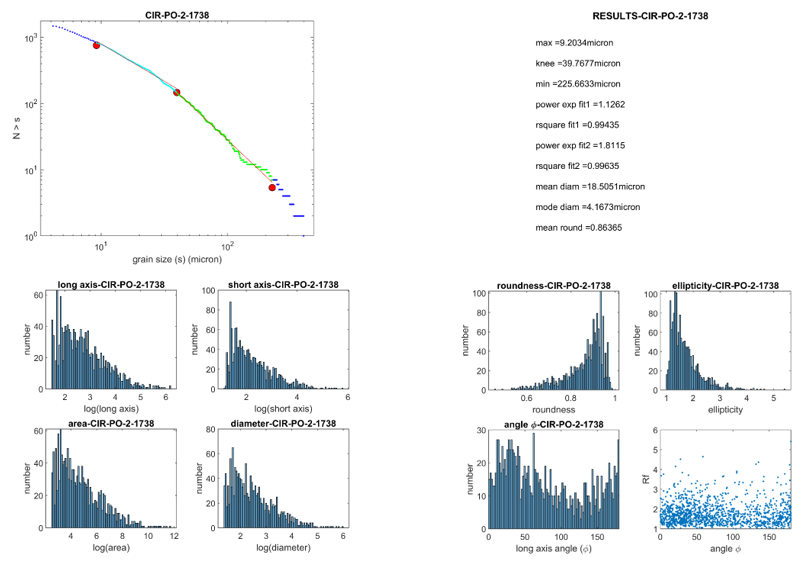
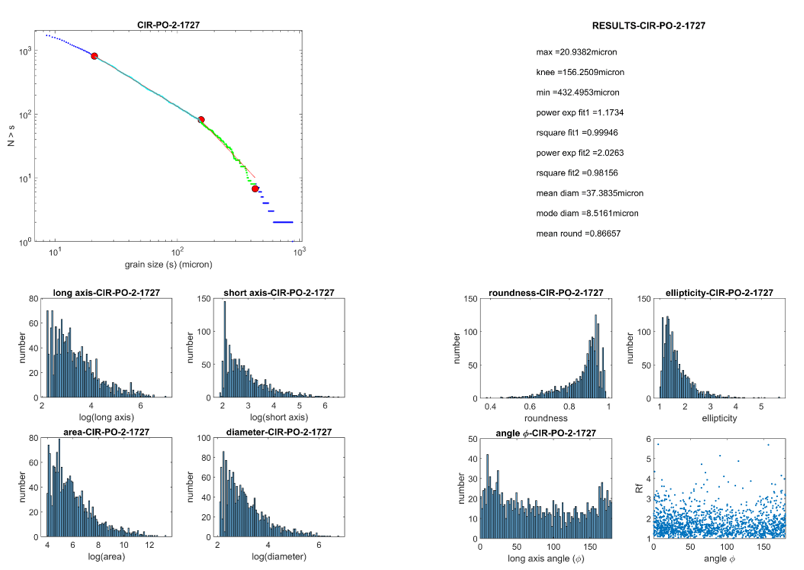
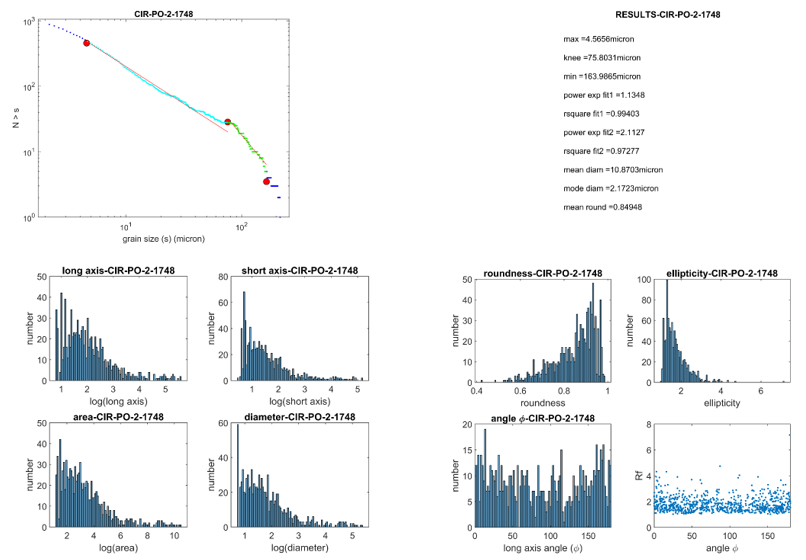
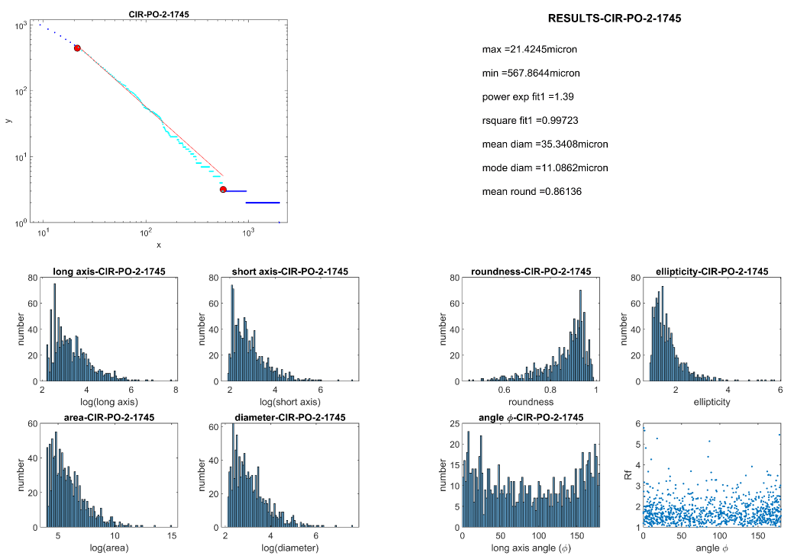
4.3.3 Frequency analysis (Ds definition)
The Frequency analysis was performed in the manner explained in paragraph 4.4.2 MATLAB of the chapter on analysis methodologies. The results of the most representative photos of each sample are shown below. For more details see the attached appendix.
Sample ROC_1 (0 m)
Sample ROC_2 (1m)
Sample ROC_5 (4m)
Sample ROC_6 (5m)
Sample ROC_7 (6m)
Sample ROC_10 (9m)
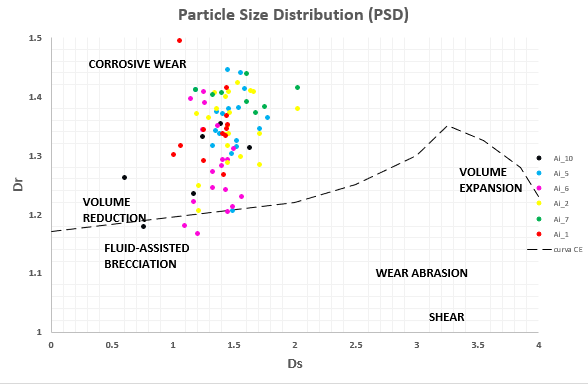
4.3.4 PSD graph
Downstream the results obtained regarding Dr and Ds parameters, I created the PSD graph as shown in the literature in paragraph 2.9 Application of Microstructural Analysis. Results shown in the graph are specified in the summary table in the attached appendix.