Chapter 8 Reporting your findings
A discussion of how to interpret and report sensitivity analyses
8.1 Methods
We propose a short checklist to ensure adequate reporting of the sensitivity analysis. The following items can be included in the “methods” section of a scientific manuscript, or in an attached supplement:
Description of each MNAR mechanism to be tested
DAG that includes MAR and MNAR mechanisms to be tested
List of assumptions that accompany each posited MNAR mechanism
Description of complete case, multiple imputation, and pattern-mixture model methods
Explanation of why additive and/or multiplicative offsets were tested
Explanation of how and why offset values were selected
8.2 Results
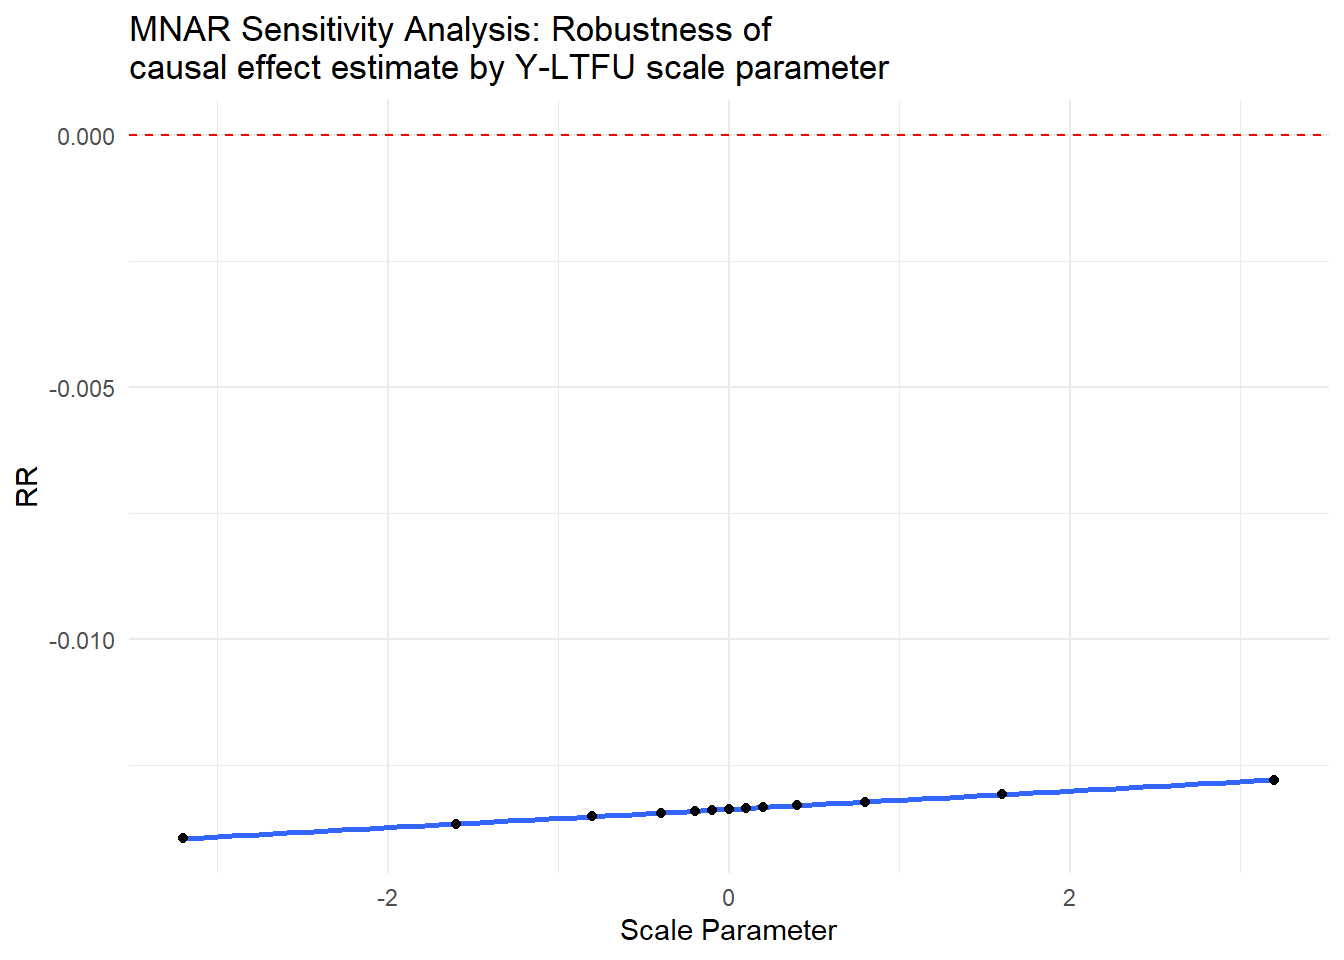
Scenario 3 (MNAR mechanism dependent on outcome \(Y\))
For scenario 3 (MNAR mechanism dependent on \(Y\)), we suggest that the following table, figure and interpretations can be used to more effectively communicate findings from the sensitivity analysis. These can be included in the main results of the manuscript or an attached supplement. Sample output is included below (more examples can be found in Section 5)
Tabular output
| Scale parameter | RR | se | PAA (mean) | PAA (sd) |
|---|---|---|---|---|
| -32 | -0.014 | 0.002 | -4.45 | 14.41 |
| -16 | -0.014 | 0.001 | -1.99 | 10.37 |
| -8 | -0.014 | 0.001 | -0.76 | 9.08 |
| -4 | -0.013 | 0.001 | -0.14 | 8.73 |
| -2 | -0.013 | 0.001 | 0.16 | 8.64 |
| -1 | -0.013 | 0.001 | 0.32 | 8.62 |
| 0 | -0.013 | 0.001 | 0.47 | 8.61 |
| 1 | -0.013 | 0.001 | 0.62 | 8.62 |
| 2 | -0.013 | 0.001 | 0.78 | 8.64 |
| 4 | -0.013 | 0.001 | 1.08 | 8.73 |
| 8 | -0.013 | 0.001 | 1.70 | 9.08 |
| 16 | -0.013 | 0.001 | 2.93 | 10.36 |
| 32 | -0.013 | 0.002 | 5.39 | 14.39 |
Graphical output
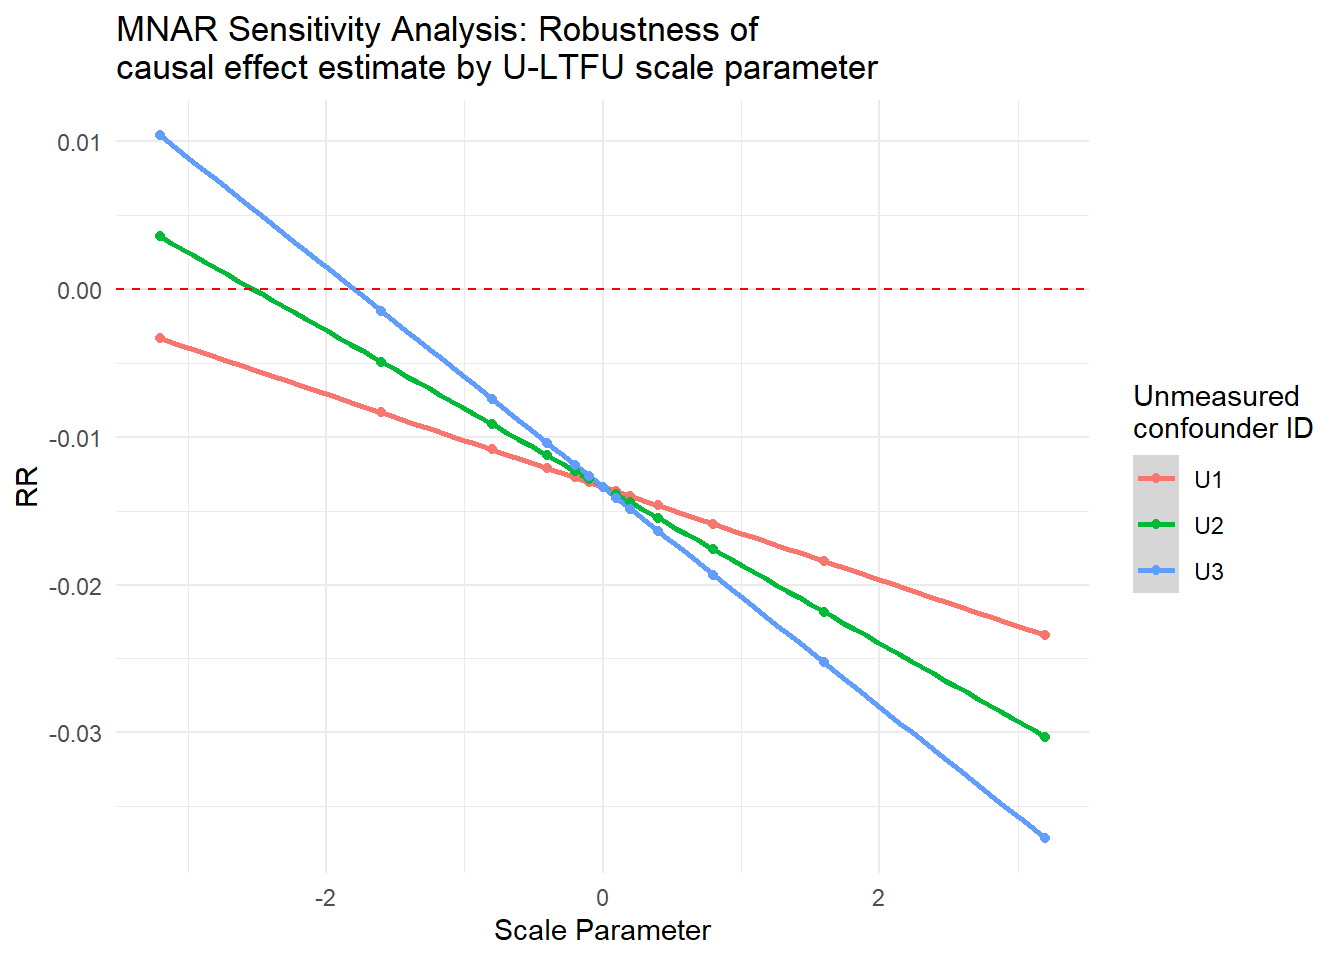
Scenario 4 (MNAR mechanism dependent on unmeasured confounder \(U\))
For MNAR scenarios in which LTFU is dependent on an unmeasured confounder \(U\), we suggest a parallel set of tables and figures that can be used to more effectively communicate findings from the sensitivity analysis. We further recommend reporting the magnitude of association between the generated “unmeasured” U, exposure, and disease, as follows, as shown at the end of this section.
Tabular output
| Unmeasured variable | Scale parameter | RR | se | PAA (mean) | PAA (sd) |
|---|---|---|---|---|---|
| U1 | -3.2 | -0.003 | 0.002 | -1.34 | 15.35 |
| U1 | -1.6 | -0.008 | 0.001 | -0.43 | 9.43 |
| U1 | -0.8 | -0.011 | 0.001 | 0.02 | 8.06 |
| U1 | -0.4 | -0.012 | 0.001 | 0.24 | 8.09 |
| U1 | -0.2 | -0.013 | 0.001 | 0.36 | 8.29 |
| U1 | -0.1 | -0.013 | 0.001 | 0.41 | 8.44 |
| U1 | 0.0 | -0.013 | 0.001 | 0.47 | 8.61 |
| U1 | 0.1 | -0.014 | 0.001 | 0.53 | 8.81 |
| U1 | 0.2 | -0.014 | 0.001 | 0.58 | 9.03 |
| U1 | 0.4 | -0.015 | 0.001 | 0.70 | 9.54 |
| U1 | 0.8 | -0.016 | 0.001 | 0.92 | 10.78 |
| U1 | 1.6 | -0.018 | 0.002 | 1.37 | 13.83 |
| U1 | 3.2 | -0.023 | 0.003 | 2.28 | 20.99 |
| U2 | -3.2 | 0.004 | 0.003 | -1.56 | 24.68 |
| U2 | -1.6 | -0.005 | 0.002 | -0.54 | 12.86 |
| U2 | -0.8 | -0.009 | 0.001 | -0.04 | 8.69 |
| U2 | -0.4 | -0.011 | 0.001 | 0.22 | 7.99 |
| U2 | -0.2 | -0.012 | 0.001 | 0.34 | 8.14 |
| U2 | -0.1 | -0.013 | 0.001 | 0.41 | 8.34 |
| U2 | 0.0 | -0.013 | 0.001 | 0.47 | 8.61 |
| U2 | 0.1 | -0.014 | 0.001 | 0.53 | 8.95 |
| U2 | 0.2 | -0.014 | 0.001 | 0.60 | 9.36 |
| U2 | 0.4 | -0.015 | 0.001 | 0.72 | 10.32 |
| U2 | 0.8 | -0.018 | 0.002 | 0.98 | 12.69 |
| U2 | 1.6 | -0.022 | 0.003 | 1.48 | 18.33 |
| U2 | 3.2 | -0.030 | 0.004 | 2.50 | 30.83 |
| U3 | -3.2 | 0.010 | 0.005 | -1.78 | 34.67 |
| U3 | -1.6 | -0.001 | 0.002 | -0.65 | 17.22 |
| U3 | -0.8 | -0.007 | 0.001 | -0.09 | 9.99 |
| U3 | -0.4 | -0.010 | 0.001 | 0.19 | 8.10 |
| U3 | -0.2 | -0.012 | 0.001 | 0.33 | 8.03 |
| U3 | -0.1 | -0.013 | 0.001 | 0.40 | 8.25 |
| U3 | 0.0 | -0.013 | 0.001 | 0.47 | 8.61 |
| U3 | 0.1 | -0.014 | 0.001 | 0.54 | 9.11 |
| U3 | 0.2 | -0.015 | 0.001 | 0.61 | 9.72 |
| U3 | 0.4 | -0.016 | 0.002 | 0.75 | 11.20 |
| U3 | 0.8 | -0.019 | 0.002 | 1.03 | 14.81 |
| U3 | 1.6 | -0.025 | 0.003 | 1.59 | 23.14 |
| U3 | 3.2 | -0.037 | 0.006 | 2.72 | 40.99 |
Graphical output
Reporting of \(U-A\) and \(U-Y\) relationship
| variable | RR | std.error |
|---|---|---|
| U1 | -0.7520250 | 0.0625914 |
| U2 | -0.4529040 | 0.0375505 |
| U3 | -0.3240197 | 0.0268205 |
| variable | RR | std.error |
|---|---|---|
| U1 | 0.6667669 | 8.3e-06 |
| U2 | 0.4000362 | 3.0e-06 |
| U3 | 0.2857328 | 1.5e-06 |
8.3 Recommended interpretations
Scenario 3 (MNAR mechanism dependent on outcome \(Y\))
Given that our DAG is correct and that our multiple imputation model is correctly specified, we can interpret our results to mean that:
If the the mean value of the outcome were [#] units higher/lower among those lost to follow-up compared to those not lost to follow-up, the causal effect estimate for the exposure-outcome relationship would be [MNAR-adjusted causal effect estimate].
The mean value of the outcome would need to be [#] units higher/lower among those lost to follow-up compared to those not lost to follow-up to explain away the relationship between exposure and outcome observed in the [complete-case or MI] analysis.
The conclusion we draw about the direction of the relationship between X and Y would remain the same if the mean value of Y were anywhere from [#] units higher to [#] units lower among people lost to follow-up (vs. those not lost to follow-up).
Scenario 4 (MNAR mechanism dependent on unmeasured confounder \(U\))
Given that our DAG is correct and that our multiple imputation model is correctly specified, we can interpret our results to mean that:
Given an unmeasured confounder that is related to exposure and disease as follows: [#] \(U-A\) risk ratio and [#] \(U-Y\) risk ratio, and when outcome missingness is related to this unmeasured confounder such that [describe \(U-LTFU\) relationship], our causal effect estimate for the exposure-outcome relationship would be [MNAR-adjusted causal effect estimate].
Given an unmeasured confounder that is related to exposure and disease as follows: [#] \(U-A\) risk ratio and [#] \(U-Y\) risk ratio, and when outcome missingness is related to this unmeasured confounder such that [describe \(U-LTFU\) relationship], the mean value of the outcome would need to be [#] units higher/lower among those lost to follow-up compared to those not lost to follow-up to explain away the relationship between exposure and outcome observed in the [complete-case or MI] analysis.
Given an unmeasured confounder that is related to exposure and disease as follows: [#] \(U-A\) risk ratio and [#] \(U-Y\) risk ratio, and when outcome missingness is related to this unmeasured confounder such that [describe \(U-LTFU\) relationship], the conclusion we draw about the direction of the relationship between X and Y would remain the same if the mean value of Y were anywhere from [#] units higher to [#] units lower among people lost to follow-up (vs. those not lost to follow-up).