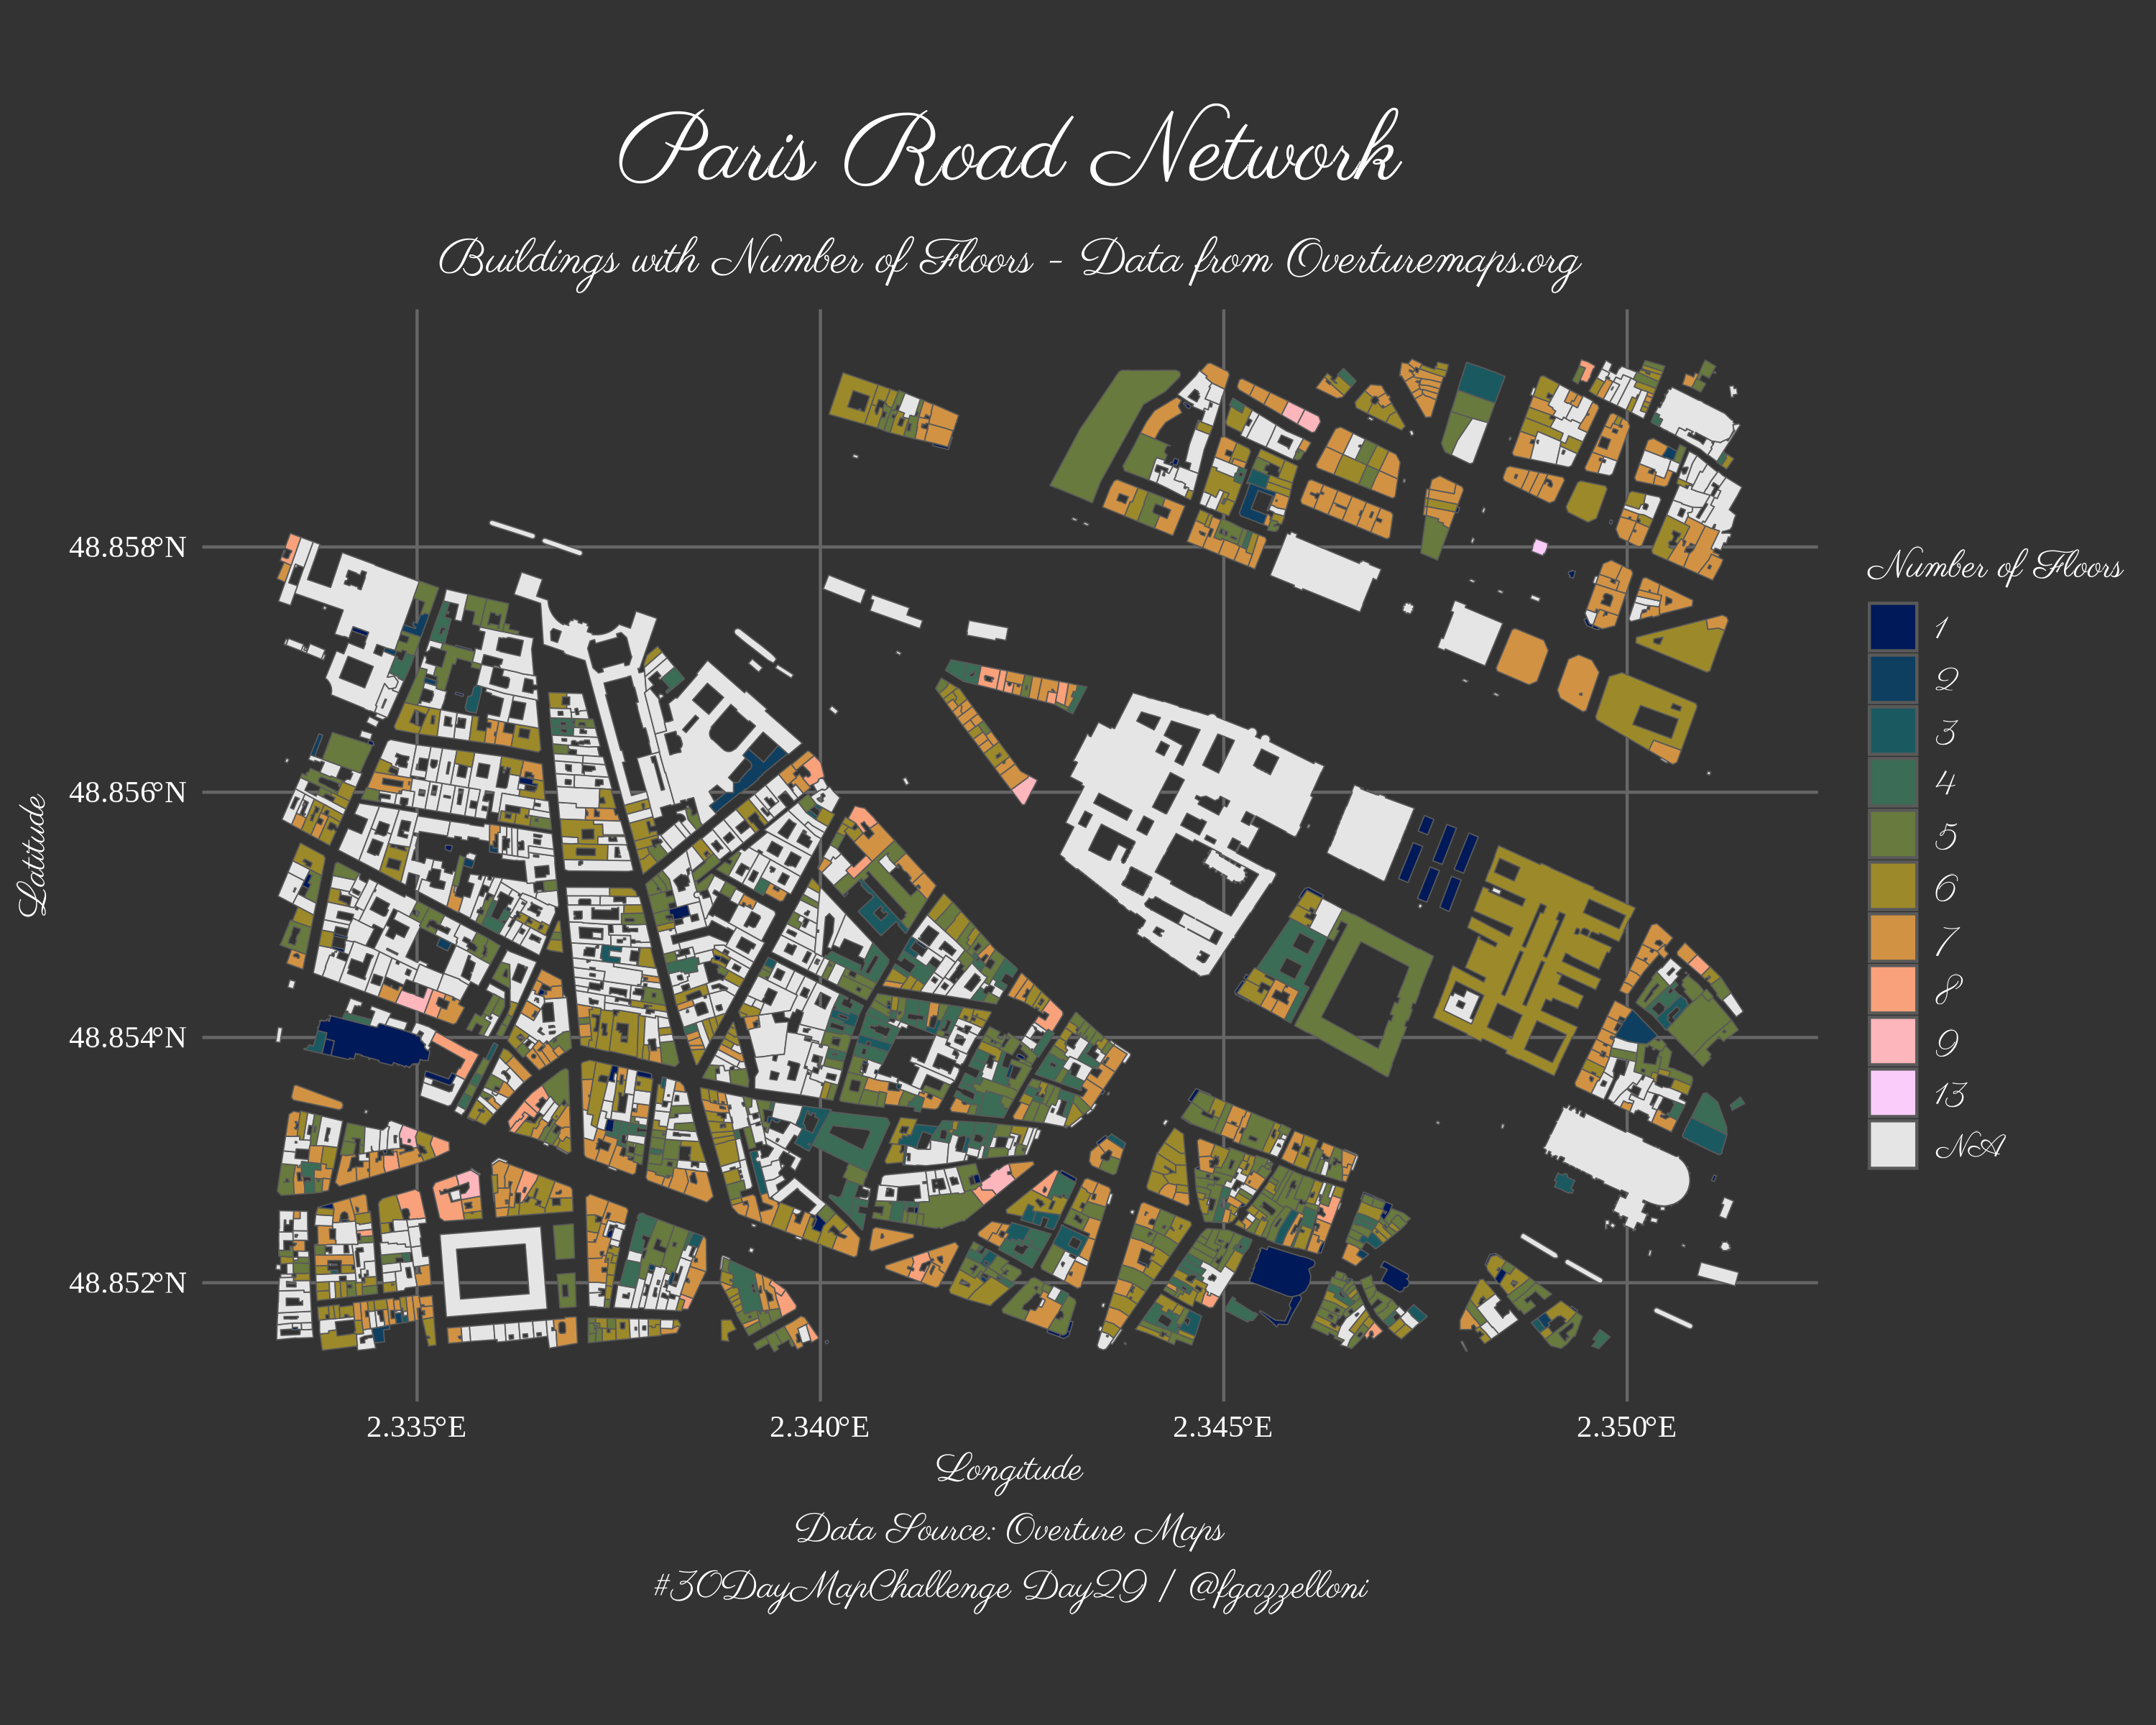
library(tidyverse)
library(sf)
Data Source: https://explore.overturemaps.org/#15.73/48.8552/2.3417/15.3/12
# Replace the path with your GeoJSON file location
geojson_file <- "data/overture-15.73-48.855200000000735-2.3417000000001735.geojson"

# Read the GeoJSON file as an sf object
geo_data <- st_read(geojson_file)library(showtext)
font_add_google(name = 'Parisienne',
family = 'Parisienne',
bold.wt = 800)
font_add_google(name = 'Tinos',
family = 'Tinos',
regular.wt = 400,
bold.wt = 700)
showtext_auto()geo_data %>%
mutate(num_floors= as.factor(num_floors)) %>%
ggplot() +
geom_sf(aes(fill=num_floors)) +
#scale_fill_discrete(na.value = 'grey90')+
scico::scale_fill_scico_d(palette = 'batlow',
na.value = 'grey90')+
labs(title = "Paris Road Network",
subtitle = "Buildings with Number of Floors - Data from Overturemaps.org",
caption = "Data Source: Overture Maps\n#30DayMapChallenge Day29 | @fgazzelloni",
fill= "Number of Floors",
x = "Longitude",
y = "Latitude") +
theme_minimal()+
theme(text = element_text(family = "Parisienne", size=40),
plot.background = element_rect(fill = "grey20",color=NA),
panel.background = element_rect(fill = "grey20",color=NA),
plot.title = element_text(color = "white",
size=100,
hjust=0.5),
plot.subtitle = element_text(color = "white",
size=50,
hjust=0.5),
plot.caption = element_text(color = "white",
size=40,
lineheight=0.4,
hjust=0.5),
axis.title = element_text(color = "white"),
axis.text = element_text(color = "white", family = "Tinos"),
panel.grid = element_line(color = "grey40"),
legend.title = element_text(color = "white"),
legend.text = element_text(color = "white"))save it as png
ggsave("day29_overture.png",
       width = 10, height = 8,
       units = "in",
       dpi = 300)