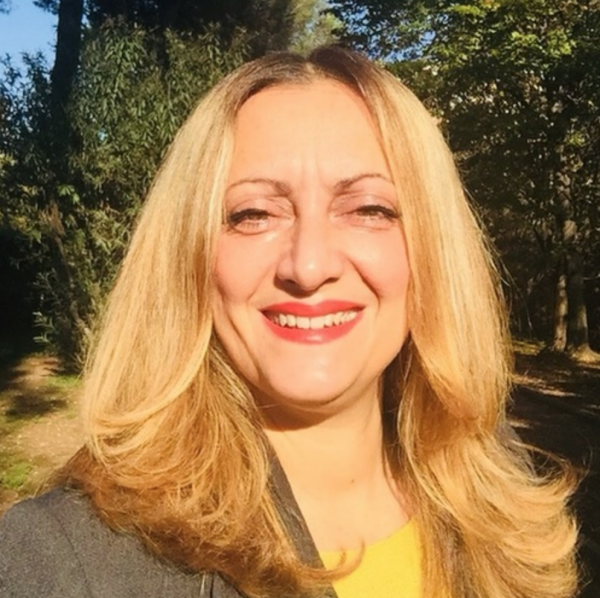
Welcome to this data visualization website, where I showcase my contributions to the #TidyTuesday, #30DayChartChallenge, #30DayMapChallenge and #DuBiosChallenge contributions spanning from 2021 to 2024.
My name is Federica Gazzelloni, and I am a passionate data enthusiast and a skilled storyteller who believes in the power of data visualization to communicate complex insights. With a keen eye for detail and a knack for making data accessible, I curated this unique collection of visualizations that tell stories beyond the numbers. Committed to sharing expertise for helping others to unlock the potential of data visualization, stay tuned for more exciting updates and insights as we continue this journey of discovery together.
