library(tidyverse)
library(showtext)
font_add_google(name = 'Georama',
                family = 'Georama')
showtext_auto()
bathy <- marmap::getNOAA.bathy(lon1 = -180, lon2 = 180,
                               lat1 = -90, lat2 = 90,
                               res = 15, keep = TRUE,
                               antimeridian=TRUE)
sp_grid <- marmap::as.SpatialGridDataFrame(bathy)
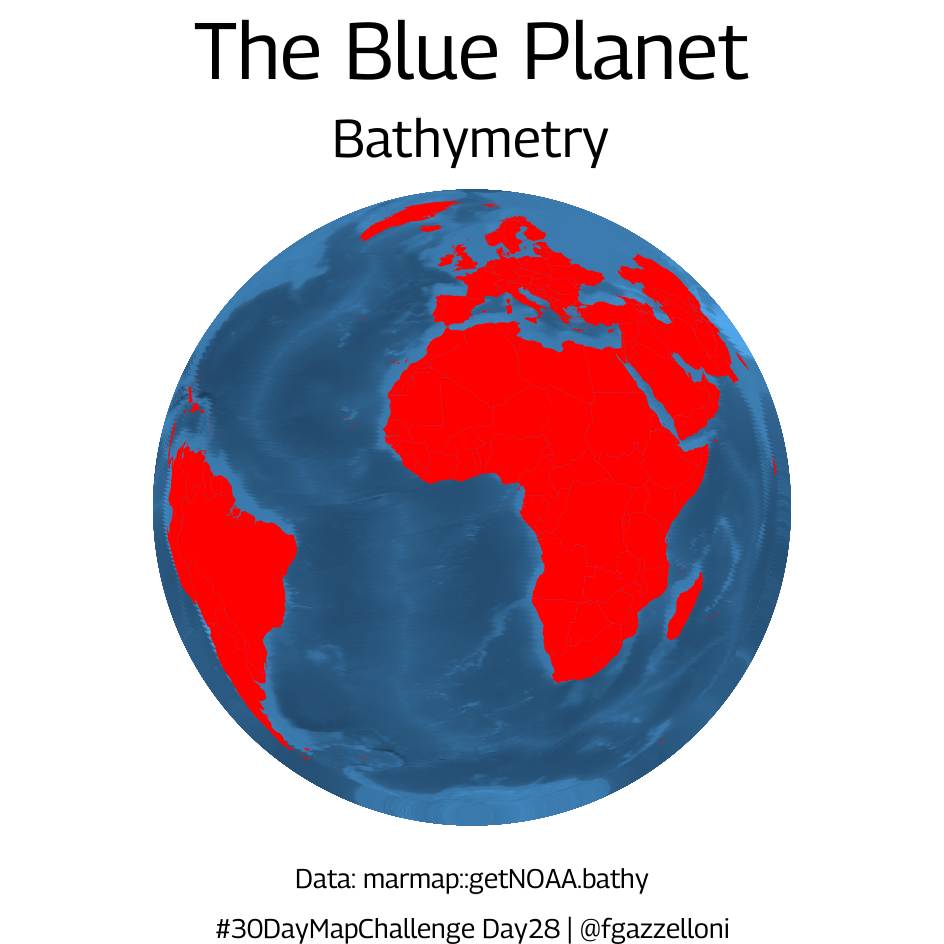
sp_gridPlot it with ggplot2 with an ortho projection
df <- as.data.frame(sp_grid) %>%
  rename(lon=s1, lat=s2)

df_sf <- df %>%
  sf::st_as_sf(coords = c("lon", "lat"),
               crs = 4326) %>%
  sf::st_transform(crs = "+proj=ortho")
df_sf
world <- rnaturalearth::ne_countries(scale = "medium",
returnclass = "sf") %>%
sf::st_transform(crs = "+proj=ortho")ggplot() +
geom_sf(data = df_sf,
aes(color = layer),
show.legend = F)+
geom_sf(data = world ,
fill = "red",
color = NA) +
coord_sf() +
labs(title = "The Blue Planet",
subtitle = "Bathymetry",
caption = "Data: marmap::getNOAA.bathy\n#30DayMapChallenge Day28 | @fgazzelloni") +
theme_void() +
theme(text = element_text(family = "Georama", size =40),
plot.title = element_text(hjust = 0.5, size = 60),
plot.subtitle = element_text(hjust = 0.5, size = 40),
plot.caption = element_text(hjust = 0.5, size=20,
lineheight=0.8))ggsave("day28_the_blue_planet.png",
bg = "white",
width = 8, height = 8,
units = "cm")