library(tidyverse)
library(rnaturalearth)
library(sf)
library(geodata)
library(terra)
library(showtext)
Create a Heat Map with Spatial Data to make a map that shows the density of points.
spain_boundaries <- rnaturalearth::ne_countries(scale = "medium",
                                                country = "Spain",
                                                returnclass = "sf")
ggplot() +
  geom_sf(data = spain_boundaries,
          fill = "white", color = "black") +
  coord_sf(xlim = c(-10, 5), ylim = c(35, 45))
sp_bbox <- sf::st_bbox(spain_boundaries)
sp_bboxlibrary(geodata)
spain <- worldclim_country("Spain",
var="tmax",
path=tempdir())spain %>% plot()dat <- spain$ESP_wc2.1_30s_tmax_11
plot(dat)dat %>% classdatdat %>% terra::rast()dat_sp <- crop(dat, ext( c(-10, 3, 35.5, 45)))
dat30 <- aggregate(dat_sp, fact = 1, fun = mean)
plot(dat30)dat_sp %>%
as.data.frame(xy = TRUE) %>%
head()Set the fonts:
font_add_google(name = 'Cormorant Garamond',
                family = 'Garamond')
showtext_auto()
dat_sp %>%
aggregate(dat_sp, fact = 9, fun = mean) %>%
as.data.frame(xy = TRUE) %>%
ggplot() +
geom_tile(aes(x = x, y = y,
fill = `ESP_wc2.1_30s_tmax_11`),
color= "grey30",
linewidth = 0.01) +
scale_fill_gradient2(low = "green",
mid = "gold",
high ="red",
midpoint = 1,
na.value = "grey50",
transform = "identity",
name = "") +
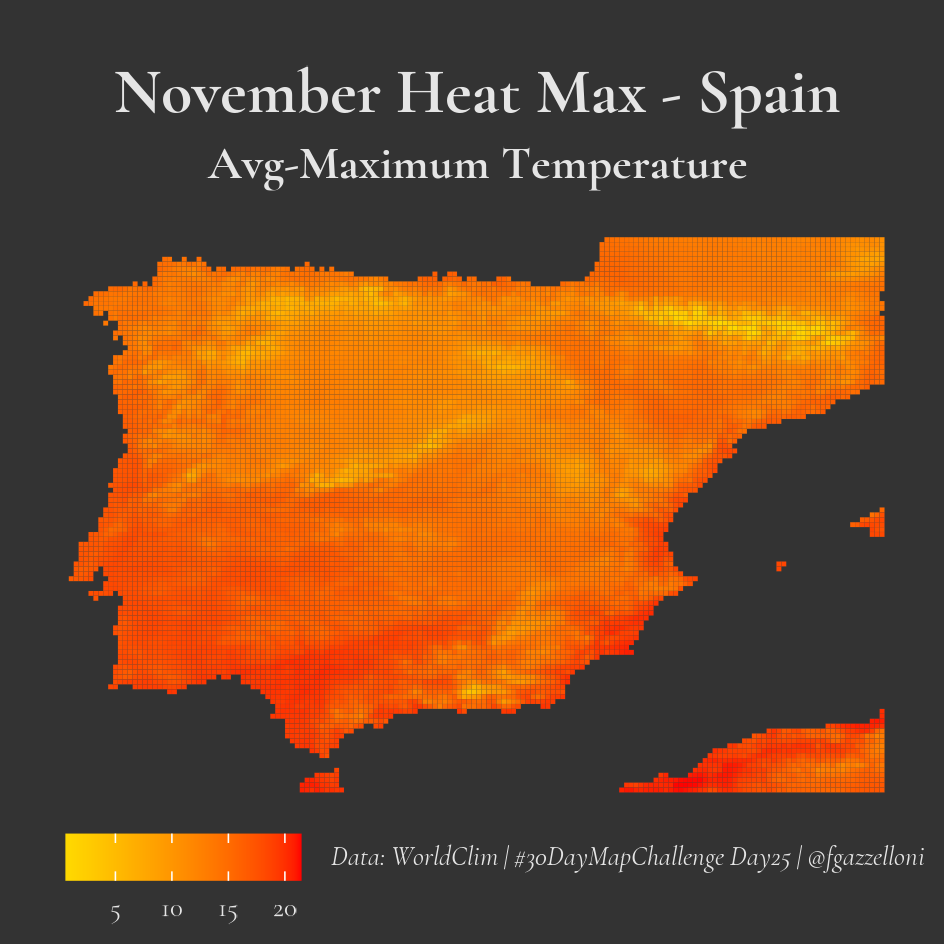
labs(title = "November Heat Max - Spain",
subtitle = "Avg-Maximum Temperature",
caption = "Data: WorldClim | #30DayMapChallenge Day25 | @fgazzelloni") +
coord_sf(clip = "off") +
ggthemes::theme_map() +
theme(text = element_text(family = "Garamond",
color = "grey90"),
plot.title = element_text(size = 48,
hjust = 0.5,
face = "bold"),
plot.subtitle = element_text(size = 35,
hjust = 0.5,
face = "bold"),
plot.caption = element_text(size = 20,
face = "italic"),
legend.position = c(0,-0.2),
legend.direction = "horizontal",
legend.text = element_text(size = 20),
legend.title = element_text(size = 0),
legend.key.size = unit(0.4, "cm"),
legend.background = element_rect(fill = "transparent"),
panel.grid = element_blank(),
panel.border = element_blank(),
axis.text = element_blank(),
axis.title = element_blank())
ggsave("day25_heat.png",
bg = "grey20",
width = 8, height = 8,
units = "cm")