library(tidyverse)
cases <- read.csv("https://raw.githubusercontent.com/CSSEGISandData/COVID-19/master/csse_covid_19_data/csse_covid_19_time_series/time_series_covid19_confirmed_global.csv")
deaths <- read.csv("https://raw.githubusercontent.com/CSSEGISandData/COVID-19/master/csse_covid_19_data/csse_covid_19_time_series/time_series_covid19_deaths_global.csv")
cases1 <- cases %>%
pivot_longer(cols = starts_with("X"),
names_to = "date",
values_to = "cases") %>%
mutate(date = gsub("X", "", date),
date = as.Date(date, format = "%m.%d.%y")) %>%
janitor::clean_names()deaths1 <- deaths %>%
pivot_longer(cols = starts_with("X"),
names_to = "date",
values_to = "deaths") %>%
mutate(date = gsub("X", "", date),
date = as.Date(date, format = "%m.%d.%y")) %>%
janitor::clean_names()COVID19 <- cases1 %>%
left_join(deaths1,
by = c("province_state",
"country_region",
"lat", "long", "date")) %>%
mutate(cases = ifelse(is.na(cases), 0, cases),
deaths = ifelse(is.na(deaths), 0, deaths)) %>%
group_by(country_region, date) %>%
mutate(cases = sum(cases),
deaths = sum(deaths),
cfr = round(deaths / cases, 3)) %>%
filter(cases > 0) %>%
arrange(country_region, date)worldmap <- map_data("world") %>%
filter(!region == "Antarctica")
centroids <- COVID19 %>%
group_by(country_region, lat, long) %>%
reframe(tot_cases = sum(cases),
tot_deaths = sum(deaths),
avg_cfr = round(mean(cfr), 3)) %>%
distinct()ggplot() +
geom_polygon(data = worldmap,
aes(x = long, y = lat, group = group),
fill = "grey",
color = "white") +
geom_point(data = centroids,
aes(x = long, y = lat,
size = tot_cases,
color = log(avg_cfr)),
alpha = 0.5) +
scale_size_continuous(
labels = scales::unit_format(unit = "M",
scale = 1e-6)) +
scale_color_viridis_c() +
coord_quickmap() +
labs(title = "COVID-19 Cases by Country",
caption = "Circle size: total cases, Color: average CFR",
size= "Total cases (M)",
color= "Average CFR (log scale)",
x = "", y = "") +
theme(axis.text = element_blank(),
plot.subtitle = element_text(size = 8))library(tidyverse)
library(viridis)
# Clean and prepare the data (as in your original script)
cases <- read.csv("https://raw.githubusercontent.com/CSSEGISandData/COVID-19/master/csse_covid_19_data/csse_covid_19_time_series/time_series_covid19_confirmed_global.csv")
deaths <- read.csv("https://raw.githubusercontent.com/CSSEGISandData/COVID-19/master/csse_covid_19_data/csse_covid_19_time_series/time_series_covid19_deaths_global.csv")
cases1 <- cases %>%
  pivot_longer(cols = starts_with("X"),
               names_to = "date",
               values_to = "cases") %>%
  mutate(date = gsub("X", "", date),
         date = as.Date(date, format = "%m.%d.%y")) %>%
  janitor::clean_names()
deaths1 <- deaths %>%
  pivot_longer(cols = starts_with("X"),
               names_to = "date",
               values_to = "deaths") %>%
  mutate(date = gsub("X", "", date),
         date = as.Date(date, format = "%m.%d.%y")) %>%
  janitor::clean_names()
COVID19 <- cases1 %>%
  left_join(deaths1,
            by = c("province_state",
                   "country_region",
                   "lat", "long", "date")) %>%
  mutate(cases = ifelse(is.na(cases), 0, cases),
         deaths = ifelse(is.na(deaths), 0, deaths)) %>%
  group_by(country_region, date) %>%
  mutate(cases = sum(cases),
         deaths = sum(deaths),
         cfr = round(deaths / cases, 3)) %>%
  filter(cases > 0) %>%
  arrange(country_region, date)
centroids <- COVID19 %>%
group_by(country_region, lat, long) %>%
reframe(tot_cases = sum(cases),
tot_deaths = sum(deaths),
avg_cfr = round(mean(cfr), 3)) %>%
distinct()
# Create the circular shapes map
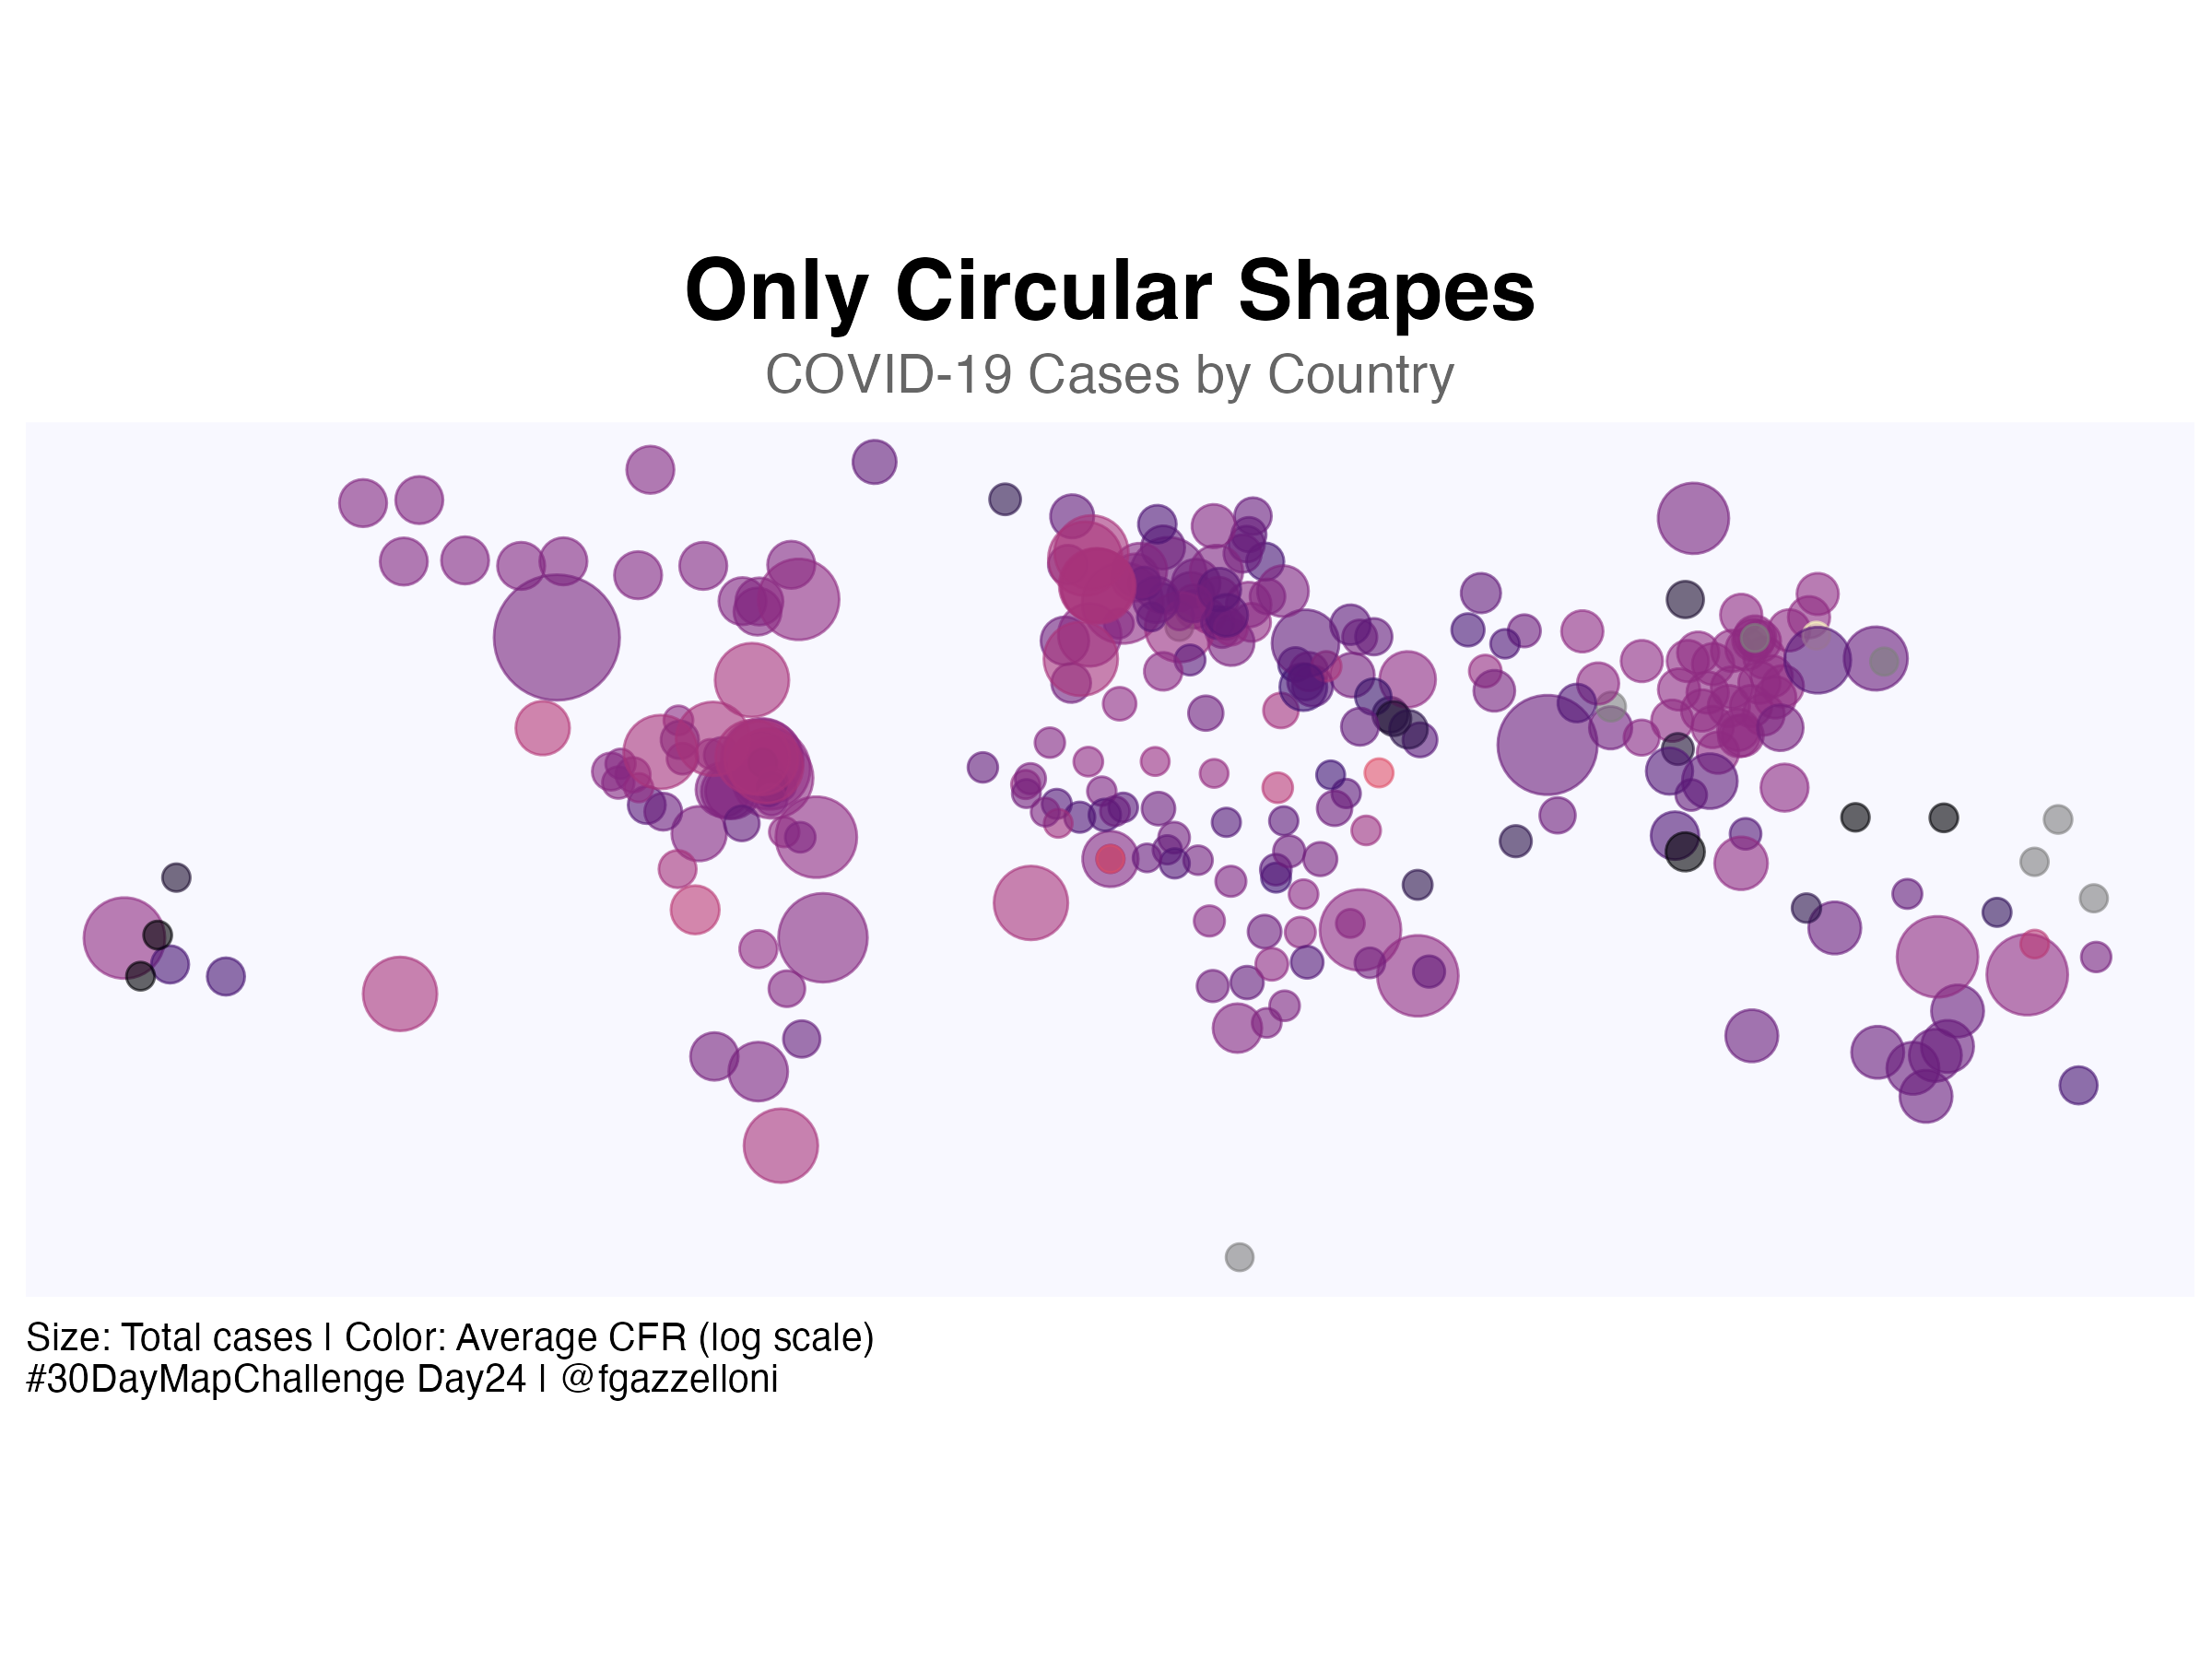
ggplot() +
# Base layer with empty background
geom_point(data = centroids,
aes(x = long, y = lat,
size = tot_cases,
color = log(avg_cfr)),
alpha = 0.6) +
scale_size_continuous(
range = c(3, 15), # Adjust size range for better visualization
labels = scales::unit_format(unit = "M", scale = 1e-6),
name = "Total Cases (M)"
) +
scale_color_viridis_c(
option = "magma", # Use a striking palette
name = "Avg CFR (log scale)"
) +
coord_quickmap() +
labs(
title = "Only Circular Shapes",
subtitle = "COVID-19 Cases by Country",
caption = "Size: Total cases | Color: Average CFR (log scale)\n#30DayMapChallenge Day24 | @fgazzelloni",
x = NULL, y = NULL
) +
ggthemes::theme_map() +
theme(legend.position = "none",
panel.background = element_rect(fill = "ghostwhite", color = NA), # Clean background
plot.background = element_rect(fill = "white", color = NA),
plot.title = element_text(size = 22, face = "bold", hjust = 0.5),
plot.subtitle = element_text(size = 14, hjust = 0.5, color = "gray40"),
plot.caption = element_text(size = 10, hjust = 0))Save it as png:
ggsave("day24_only_circular_shapes.png",
       bg = "white",
       width = 8, height = 6, dpi = 300)