library(showtext)
library(sysfonts)
library(extrafont)
showtext::showtext_auto()
showtext::showtext_opts(dpi=320)
font_add_google(name="Gideon Roman",
                family="Gideon Roman")
# load libraries for data manipulation
library(tidyverse)

# search for data
library(osmdata)
location <- "Rome"
getbb(location)available_features()feature <- "bicycle_road"
available_tags(feature)# bicycle_road points
br <- opq(c(12.23447,41.65564,12.85576,42.14103)) %>%
add_osm_feature(key = "bicycle_road") %>%
osmdata_sf(quiet = FALSE)xmin <- sf::st_bbox(br$osm_points)[1]
ymin <- sf::st_bbox(br$osm_points)[2]
xmax <- sf::st_bbox(br$osm_points)[3]
ymax <- sf::st_bbox(br$osm_points)[4]# saveRDS(br, file = "data/br.RDS")
br <- readRDS("data/br.RDS")streets <- opq(c(12.23447,41.65564,12.85576,42.14103)) %>%
add_osm_feature(key = "highway",
value = c("motorway", "primary",
"secondary", "tertiary")) %>%
osmdata_sf()saveRDS(streets, file = "data/streets.RDS")
streets <- readRDS("data/streets.RDS")small_streets <- opq(c(xmin,ymin,xmax,ymax)) %>%
add_osm_feature(key = "highway",
value = c("residential", "living_street",
"unclassified",
"service", "footway")) %>%
osmdata_sf()river <- opq(c(xmin,ymin,xmax,ymax)) %>%
add_osm_feature(key = "waterway", value = "river") %>%
osmdata_sf()Make the map
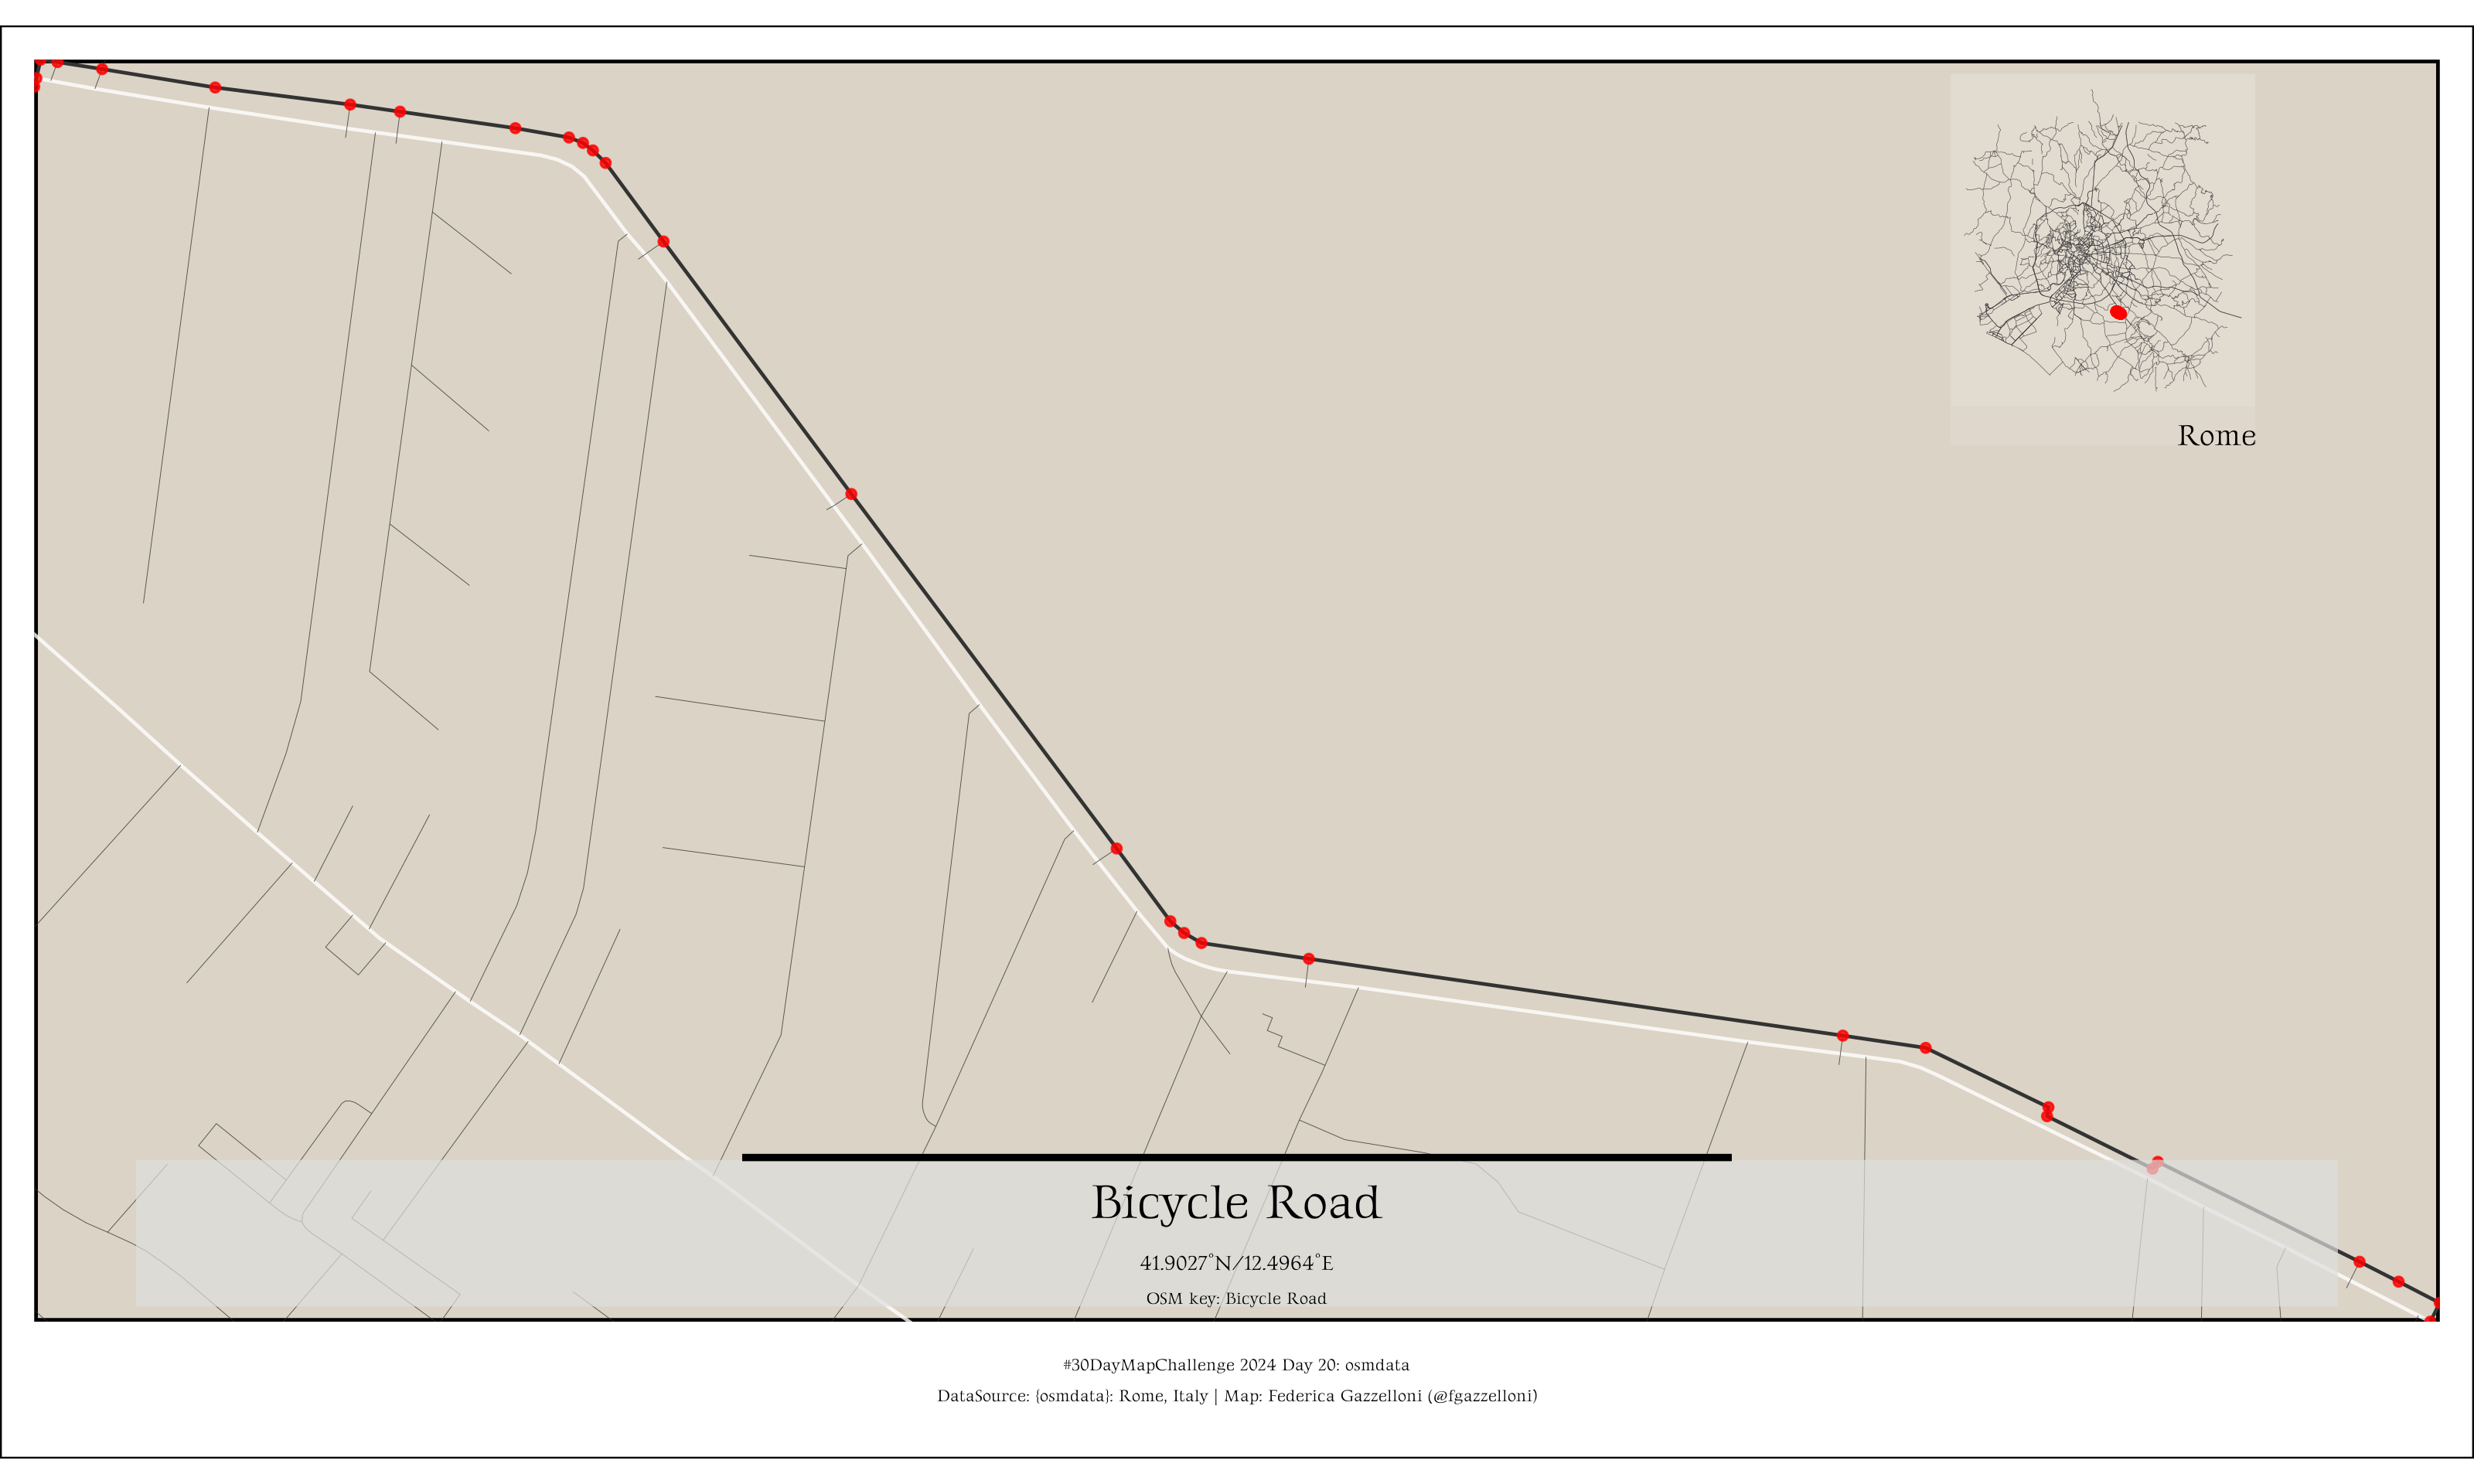
The latitude of Rome, Italy is 41.902782, and the longitude is 12.496366.
ggplot() +
 geom_sf(data = streets$osm_lines,
         inherit.aes = FALSE,
         color = "white",
         linewidth = .5,
         alpha = .8) +
 geom_sf(data = small_streets$osm_lines,
         inherit.aes = FALSE,
         color = "grey20",
         linewidth = .1,
         alpha = .8) +
    geom_sf(data = br$osm_lines,
          inherit.aes = FALSE,
          color = "grey20") +
    geom_sf(data = br$osm_points,
          inherit.aes = FALSE,
          color = "red",
          size = 1,
          alpha = .8) +
  coord_sf(xlim=c(xmin,xmax),
         ylim=c(ymin,ymax),
           expand = FALSE) +
  theme_void()+
  theme(text=element_text(family="Gideon Roman"),
        plot.background = element_rect(fill="white",linewidth=0.5),
        panel.background = element_rect(fill="#dbd3c5",linewidth=1),
plot.margin = margin(10,10,40,10,unit = "pt"))library(ggplot2)
library(sf)
library(cowplot)
# Main Map: Detailed View
main_map <- ggplot() +
geom_sf(data = streets$osm_lines,
inherit.aes = FALSE,
color = "white",
linewidth = .5,
alpha = .8) +
geom_sf(data = small_streets$osm_lines,
inherit.aes = FALSE,
color = "grey20",
linewidth = .1,
alpha = .8) +
geom_sf(data = br$osm_lines,
inherit.aes = FALSE,
color = "grey20") +
geom_sf(data = br$osm_points,
inherit.aes = FALSE,
color = "red",
size = 1,
alpha = .8) +
coord_sf(xlim=c(xmin,xmax),
ylim=c(ymin,ymax),
expand = FALSE) +
theme_void()+
theme(text=element_text(family="Gideon Roman"),
plot.background = element_rect(fill="white",linewidth=0.5),
panel.background = element_rect(fill="#dbd3c5",linewidth=1),
plot.margin = margin(10,10,40,10,unit = "pt"))
# Inset Map: Overview of the Region
inset_map <- ggplot() +
geom_sf(data = streets$osm_lines,
inherit.aes = FALSE,
color = "grey20",
linewidth = .07,
alpha = .8) +
geom_sf(data = br$osm_points,
inherit.aes = FALSE,
color = "red",
size = 1,
alpha = .8) +
labs(caption="Rome")+
theme_void() +
theme(text = element_text(family = "Gideon Roman"),
panel.background = element_rect(fill = alpha("white",alpha = 0.1),
linewidth = 0),
plot.background = element_rect(fill = alpha("white",alpha = 0.1),
linewidth = 0))
# Combine Main Map with Inset Map
combined_map <- ggdraw() +
draw_plot(main_map) +
draw_plot(inset_map, x = 0.7, y = 0.7,
width = 0.3, height = 0.25) +
draw_line(x=c(0.055,0.945),y=c(0.169,0.169),
size=20,
color="#dedede",
alpha=0.7)+
draw_line(x=c(0.3,0.7),y=c(0.22,0.22),
size=1)+
draw_label("Bicycle Road",
x=0.5,y=0.19,
size=14.5,
fontface = "bold",
fontfamily = "Gideon Roman")+
draw_label("41.9027°N/12.4964°E",
x=0.5,y=0.149,
size=6,
fontfamily = "Gideon Roman",
fontface = "bold") +
draw_label("OSM key: Bicycle Road",
x=0.5,y=0.125,
size=5,
fontfamily = "Gideon Roman") +
draw_label("#30DayMapChallenge 2024 Day 20: osmdata\nDataSource: {osmdata}: Rome, Italy | Map: Federica Gazzelloni (@fgazzelloni)",
x=0.5,y=0.07,
size=5,
lineheight = 1.5,
fontfamily = "Gideon Roman")
combined_map# save the base map
ggsave("day20_osm.png",
dpi=320,
width = 10,
height = 6,
bg="white")