library(leaflet)

# Create a simple leaflet map
collaborative_map <- leaflet() %>%
  addTiles() %>%
  addMarkers(lng = -0.1278, lat = 51.5074, popup = "London") %>%
  addMarkers(lng = 2.3522, lat = 48.8566, popup = "Paris")

# Save or share this map
collaborative_map
library(leaflet)
library(osmdata)
library(sf)

# Query OSM data for pharmacies in London and Paris
london_bbox <- c(-0.2, 51.4, -0.1, 51.6) # Approx bounding box for London
paris_bbox <- c(2.2, 48.8, 2.4, 48.9)   # Approx bounding box for Paris

# Get pharmacy data from OSM
london_pharmacies <- opq(bbox = london_bbox) %>%
  add_osm_feature(key = "amenity", value = "pharmacy") %>%
  osmdata_sf()

# Extract coordinates for pharmacies
london_coords <- st_coordinates(london_pharmacies$osm_points)

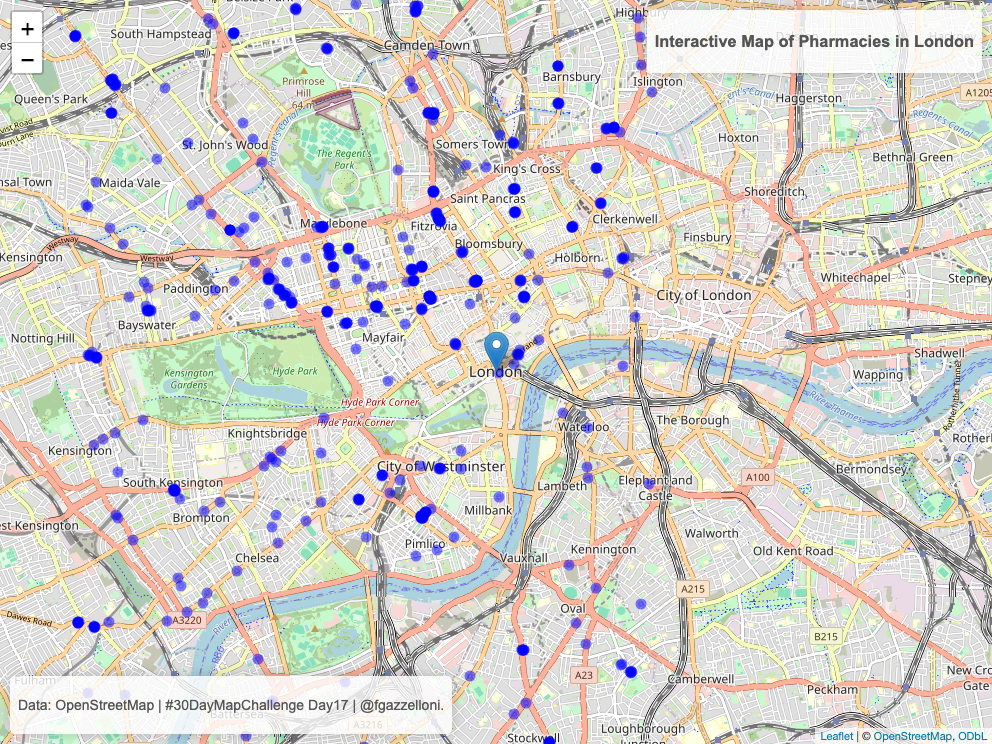
# Create a leaflet map with markers for pharmacies
collaborative_map <- leaflet() %>%
  addTiles() %>%
    # Set view to London city center with appropriate zoom level
  setView(lng = -0.1278, lat = 51.5074, zoom = 13) %>%
  # Add markers for London
  addMarkers(lng = -0.1278, lat = 51.5074,
             popup = "London") %>%
  # Add pharmacies in London
  addCircleMarkers(
    lng = london_coords[, "X"], lat = london_coords[, "Y"],
    radius = 3,
    color = "blue",
    popup = "Pharmacy (London)"
  ) %>%
    # Add a title as a top control
  addControl(
    html = "<h3>Interactive Map of Pharmacies in London</h3>",
    position = "topright"
  ) %>%
  # Add a caption as a bottom control
  addControl(
    html = "<p>Data: OpenStreetMap | #30DayMapChallenge Day17 | @fgazzelloni.</p>",
    position = "bottomleft"
  )

# Display the map
collaborative_maplibrary(htmlwidgets)
# Save the map as an HTML file
saveWidget(collaborative_map, "day17_collaborative_map.html")library(webshot2)
webshot("day17_collaborative_map.html",
file = "day17_collaborative_map.png",
cliprect = "viewport")