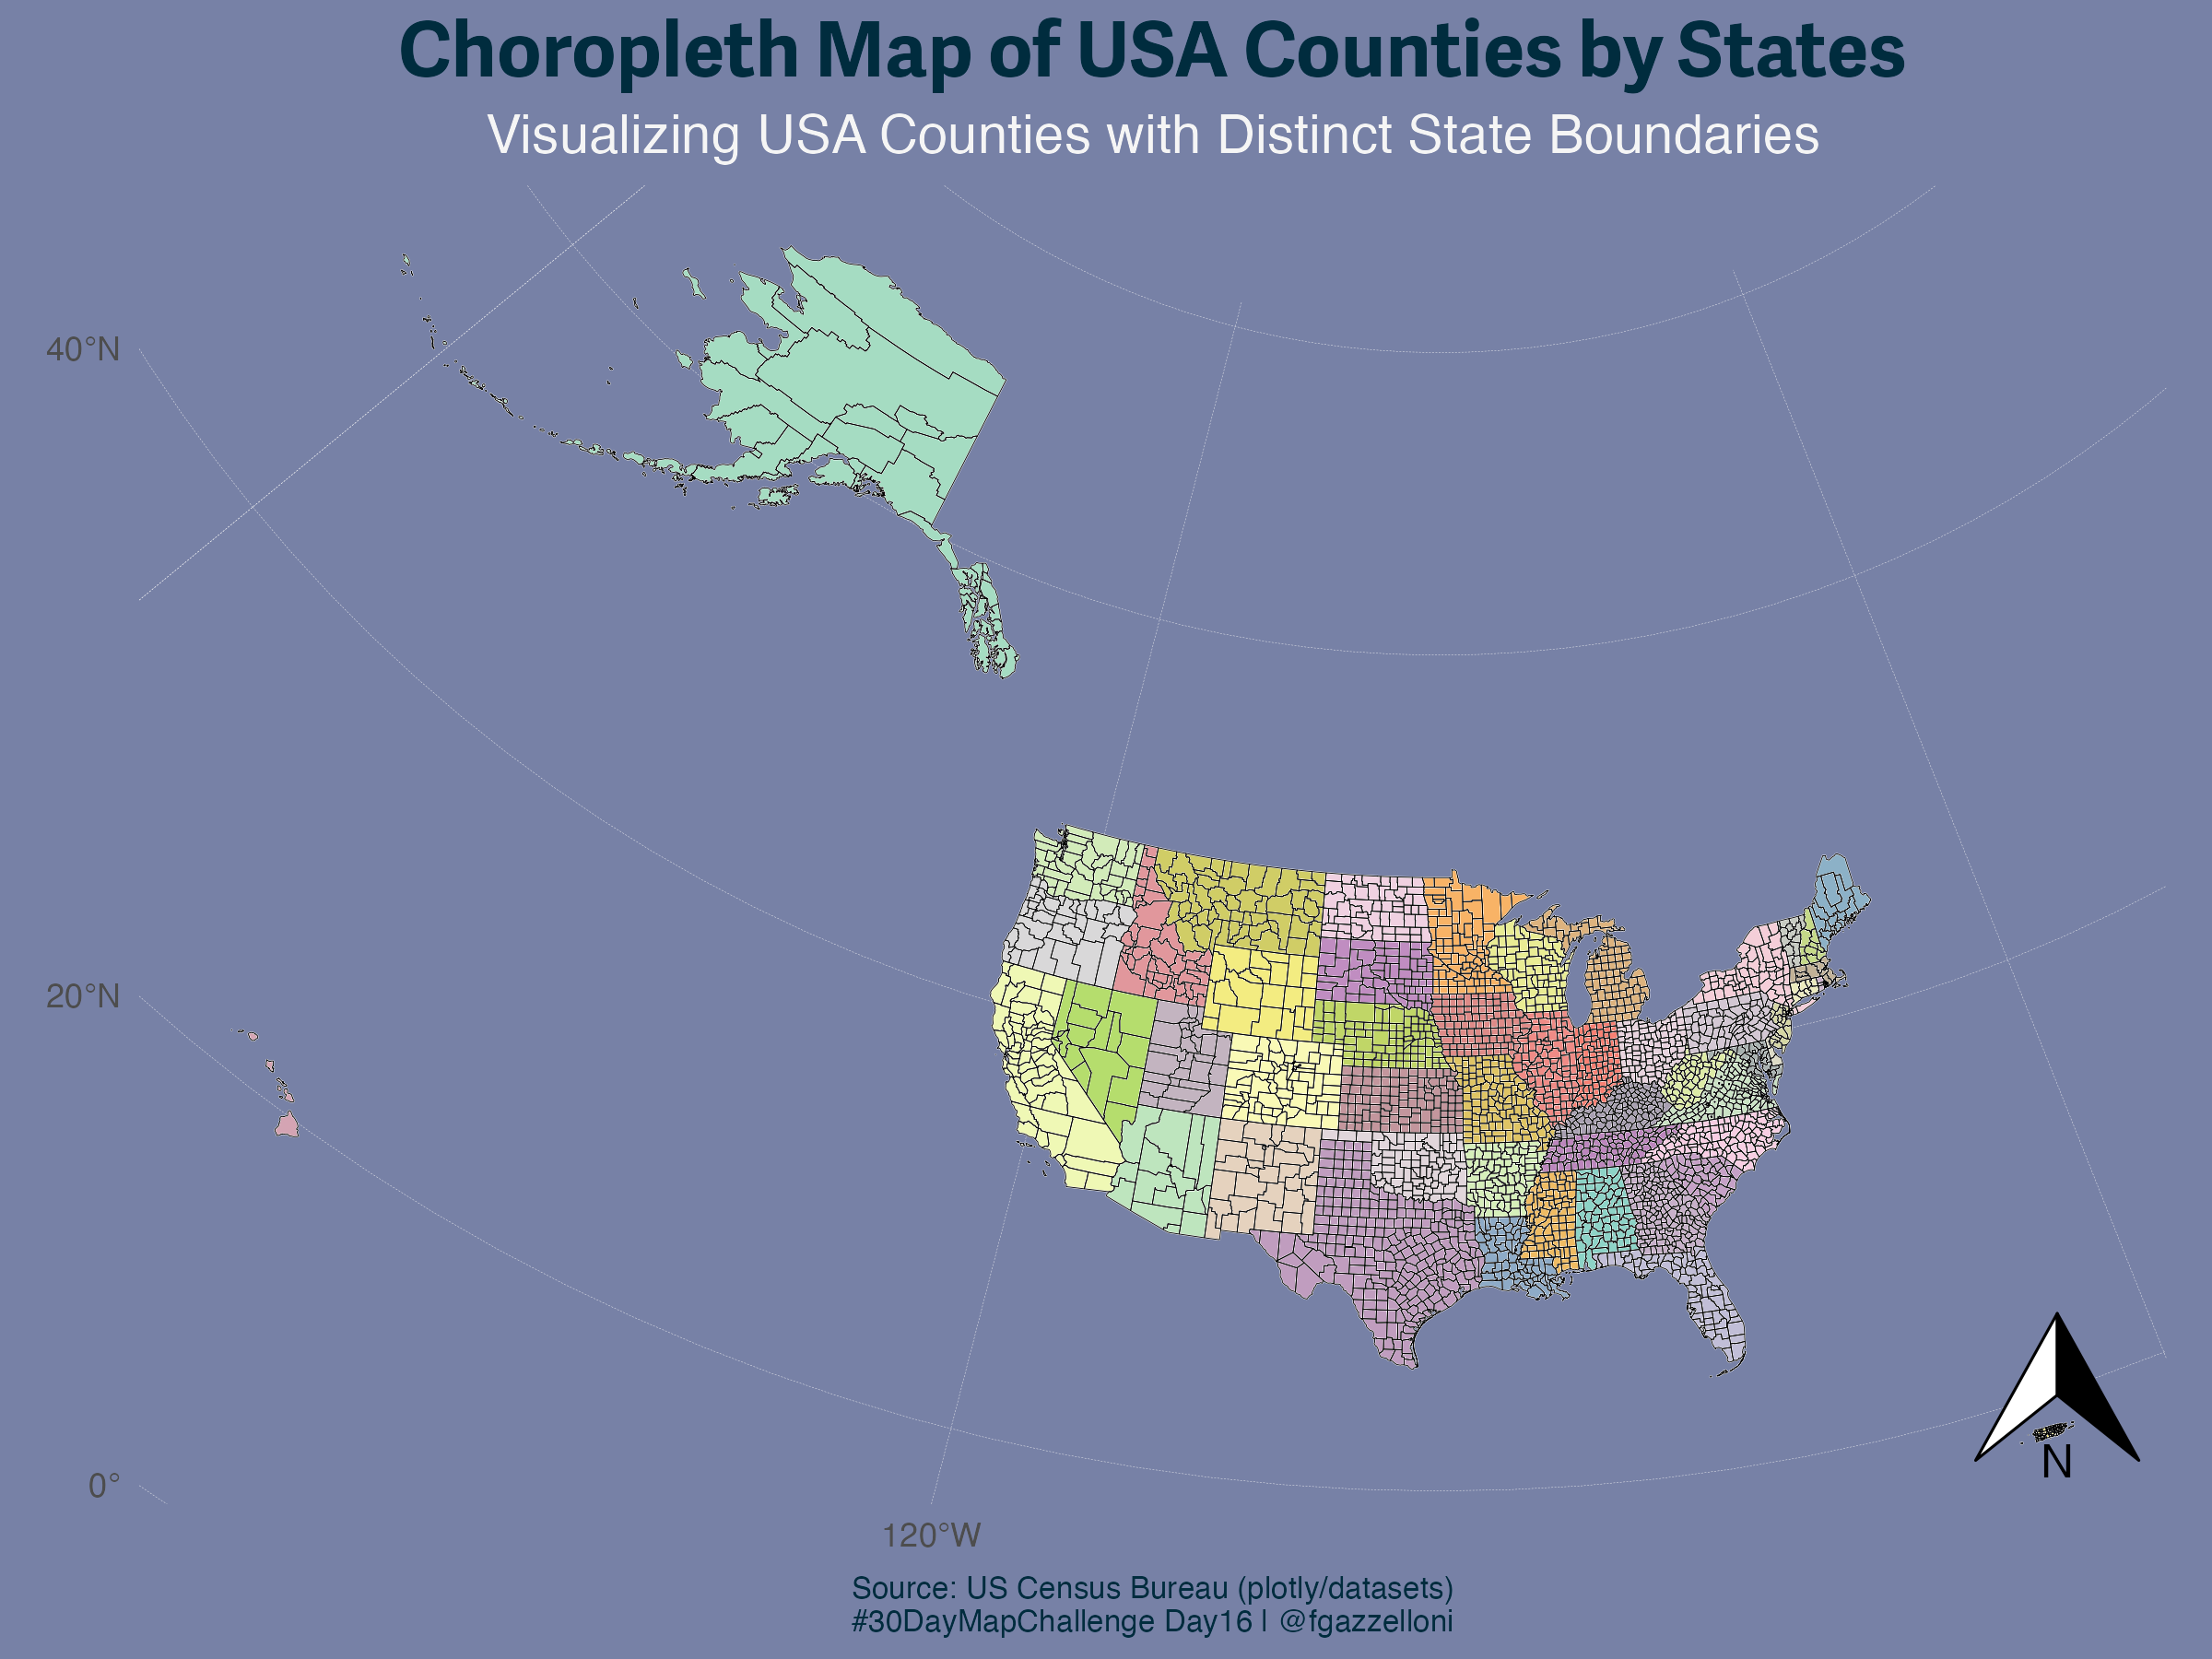
library(tidyverse)
library(sf)
url <- "https://raw.githubusercontent.com/plotly/datasets/master/geojson-counties-fips.json"geojson_data <- sf::st_read(url)geojson_data %>%
ggplot() +
geom_sf(aes(fill = STATE), color = "white", size = 0.1, show.legend = F) +
coord_sf(crs = 5070, clip = "off") +
labs(title = "Choropleth Map of USA Counties by States", caption = "Source: US Census Bureau (plotly/datasets)\n#30DayMapChallenge Day16 | @fgazzelloni") +
theme_minimal()library(sysfonts)
library(showtext)
sysfonts::font_add_google("Roboto Condensed", "roboto")
showtext::showtext_auto(enable = F)ggplot(geojson_data) +
geom_sf(aes(fill = STATE), color = "white", size = 0.1) + # Fill counties by state
geom_sf(data = geojson_data %>% group_by(STATE) %>% summarise(geometry), # Overlay state borders
color = "black", linewidth = 0.1, fill = NA) +
coord_sf(crs = 5070, clip = "off") +
scale_fill_manual(values = colorRampPalette(brewer.pal(12, "Set3"))(length(unique(geojson_data$STATE)))) + # Custom colors
labs(
title = "Choropleth Map of USA Counties by States",
subtitle = "Visualizing USA Counties with Distinct State Boundaries",
caption = "Source: US Census Bureau (plotly/datasets)\n#30DayMapChallenge Day16 | @fgazzelloni"
) +
theme_minimal() +
theme(text = element_text(family = "roboto"),
plot.title = element_text(size = 20, face = "bold", hjust = 0.5, color = "#002c3e"),
plot.subtitle = element_text(size = 14, hjust = 0.5, color = "#f5f5f5"),
plot.caption = element_text(size = 8, hjust = 0.5, color = "#002c3e"),
panel.grid = element_line(color = "#f5f5f5",linewidth=0.05,linetype="dashed"),
#panel.grid = element_blank(), # Remove distracting grid lines
legend.position = "none", # Remove legend
plot.background = element_rect(fill = "#7781a6", color = NA) # Light background for contrast
) +
# add a north arrow and a scale bar
ggspatial::annotation_north_arrow(location = "br") save it as png
ggsave("day16_choropleth_map.png",
       bg = "#7781a6",
       width = 8, height = 6, dpi = 300)