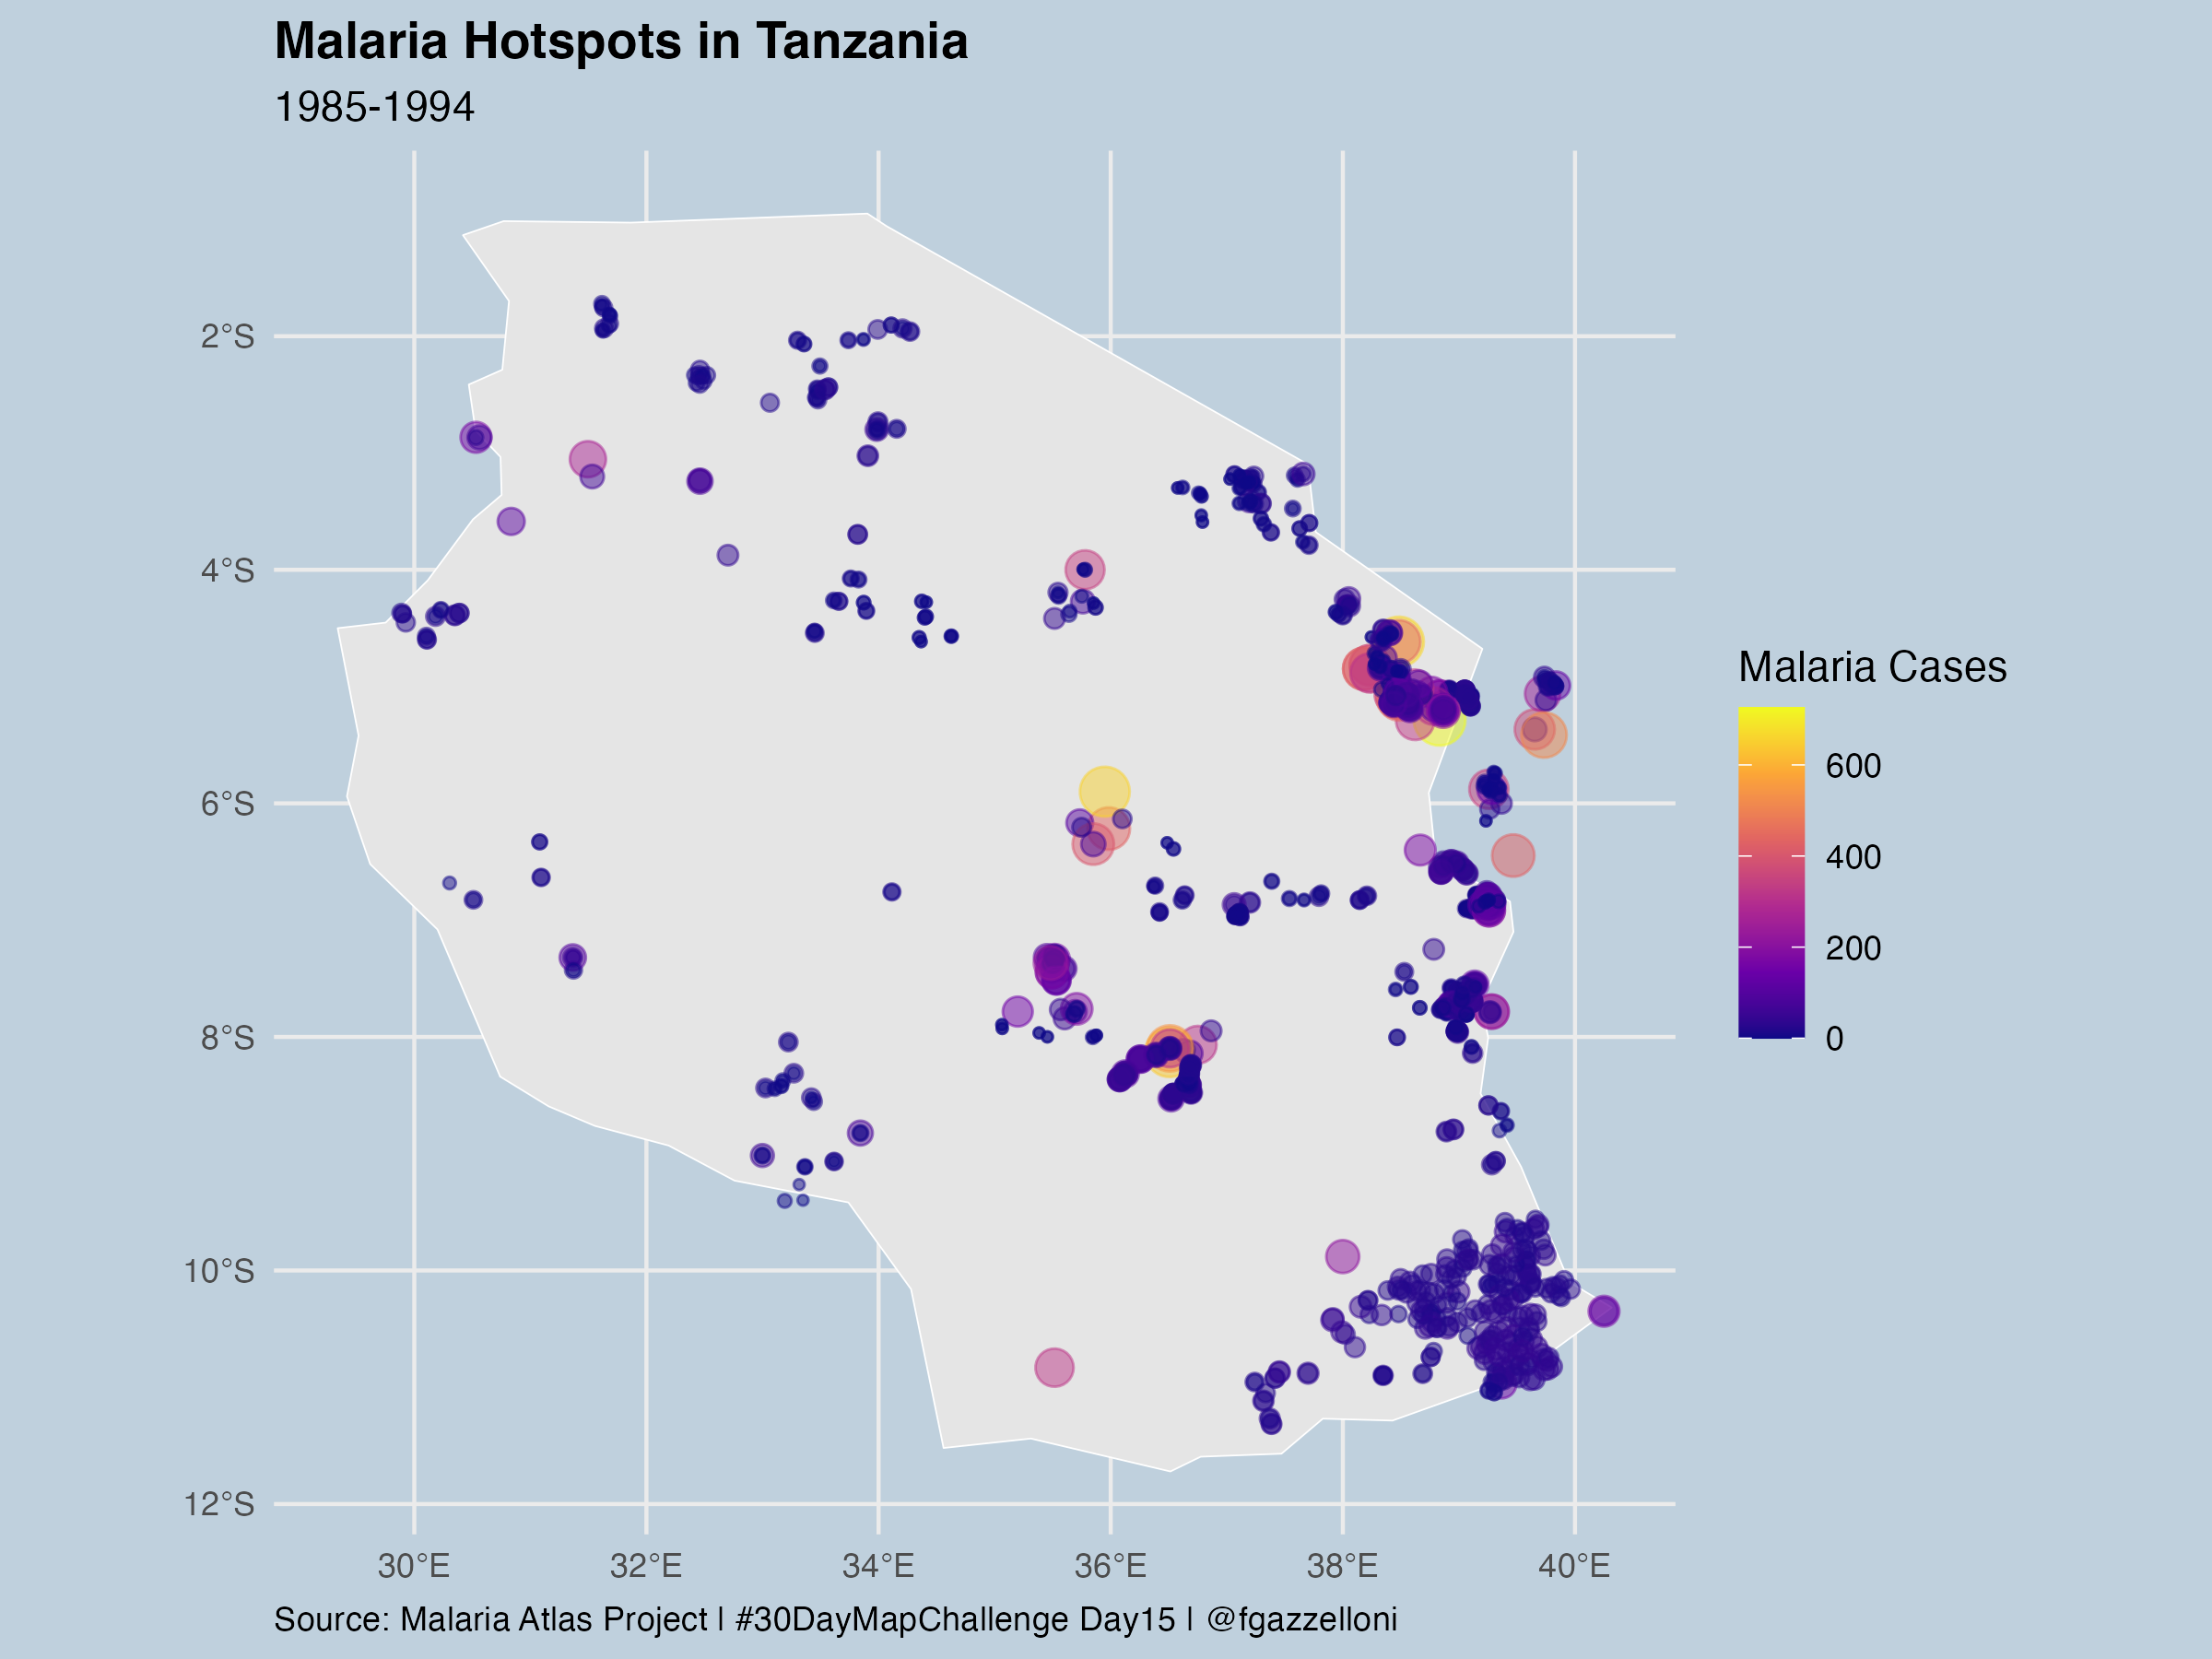
library(malariaAtlas)
library(tidyverse)
library(sf)
library(rnaturalearth)
#tanzania_data <- getPR(country = "Tanzania", species = "Pf")
#saveRDS(tanzania_data, "data/inst/extdata/tanzania_data.rds")
tanzania_data <- readRDS("data/inst/extdata/tanzania_data.rds")
tanzania_data_sf <- tanzania_data %>%
arrange(year_start) %>%
select(year_start,longitude,latitude,positive) %>%
filter(!is.na(longitude) & !is.na(year_start)) %>%
st_as_sf(coords = c("longitude", "latitude"),
crs = 4326)
tanzania_sf <- ne_countries(country = "United Republic of Tanzania",
returnclass = "sf")
ggplot() +
geom_sf(data = tanzania_sf,
fill = "gray90",
color = "white")+
geom_sf(data = tanzania_data_sf,
aes(size=positive, color = positive),
alpha=0.5)+
scale_color_viridis_c(option = "plasma", name = "Malaria Cases") +
guides(size = "none") +
labs(title = "Malaria Hotspots in Tanzania",
subtitle = "1985-1994",
caption = "Source: Malaria Atlas Project | #30DayMapChallenge Day15 | @fgazzelloni") +
theme(legend.position = "right")+
theme(plot.caption = element_text(hjust = 0))save as png
ggsave("day15_my_data/day15_my_data.png",
bg = "#bfd0dd",
width = 8, height = 6, units = "in")